Spreading the iPhone and diffusing innovation

Theoretical and practical studies converge in the fact that the spread of innovation is displayed as an S-shaped curve. Indeed, the S-shaped pattern of diffusion of innovation appears to be a basic anthropological phenomenon.
This observation dates back to the distant 1895, when the French sociologist Gabriel Tarde first described the process of social change through the imitative, by its nature, mechanism of “group thinking” and the S-shaped pattern [1]. In 1983, Everett Rogers developed a more advanced four-step model of the innovation decision-making process, consisting of: (1) knowledge, (2) persuasion, (3) decision and implementation, and (4) confirmation.
')
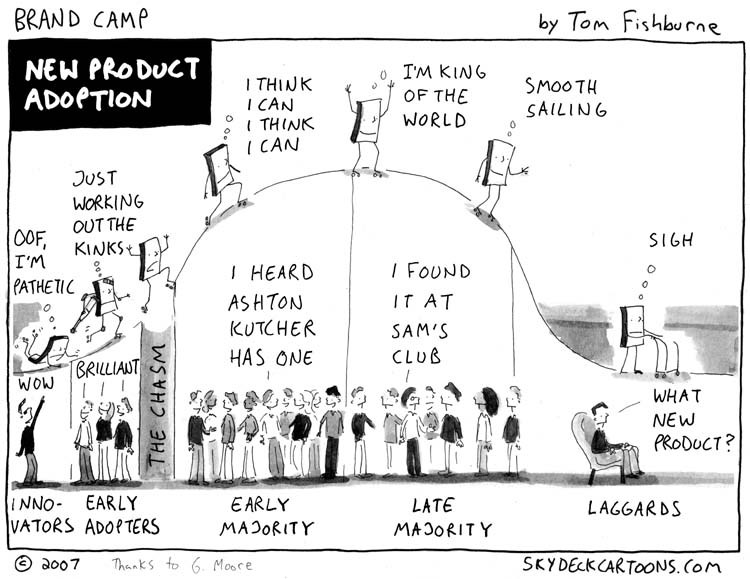
Rogers divided the population of potential followers according to the time period at which they “accepted” the innovation and divided them into categories according to their standard deviation from the “average” moment of adoption. He demonstrated extensive empirical evidence of the fidelity of the assumption that the symmetrical bell-shaped curve represents the distribution of followers in time. The shape of the curve corresponds to the first derivative of the logistic growth and substitution curve, as shown in the figure below:

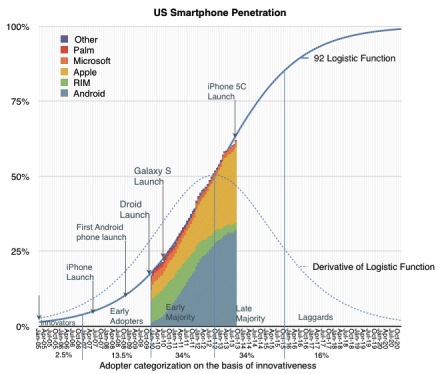
In the graph below, I applied the classification of Rogers followers to the data on the "adoption" of smartphones in the United States. Data collected through September 2013 inclusive.
The fact that the data on smartphones in the United States correspond to the theory is shocking, but what conclusions can we draw on specific platforms? In the first half of this time period, the market leader changed. This is illustrated in more detail by the following graphs showing minor changes in the distribution of market shares.

Please note that, with the exception of the iPhone, each platform taken separately does not correspond to a logistic (eg linear) pattern, even though in general, all the technology corresponds to it.
And then there is a serious snag: although we can predict how smartphones will be adopted in society, we cannot predict how each particular firm will perceive society. This means that an investor cannot confidently make a “bet” on technology [2]. If he "puts" on a particular company, it is likely that he will lose. Among all platforms, there is usually only one unexpected leader.
Before we continue to delve into the question of finding winners or predicting the future distribution of market shares among competitors, we need to understand the reasons behind the innovation “adoption” pattern.
Rogers concluded that the symmetry of the process of diffusion of innovation is based on the behavior of individuals in the process of cognition. At the beginning, when a person is faced with a new situation (with something that needs to be learned), he makes many mistakes. Their number is gradually reduced (in the process of learning) over time, because a person receives more and more information, which acts as an incentive [ for further cognition - translation note]. The gain gained through training in practice is proportional to the product of the amount already studied by the amount of information that remains to be studied.
Arnulf Grübler explains:
This is exactly equivalent to the transformation of the logistic curve in the F (1-F) format. It should be emphasized that these characteristics of the learning process are reflected in real situations associated with learning and are confirmed by a large number of laboratory and field experiments. Therefore, such adoption of innovations in the social system is equivalent to the process of studying the use of an innovative product by an individual. Thus, a symmetrical pattern of diffusion is the result of the way in which messages about innovations are created and distributed in the process of “social learning”.
So, these researchers consider behavior in the learning process the reason for adopting technology. Can such a statement be applied to individual platforms? It sounds tempting.
The hypothesis is as follows: the followers of innovation not only serve as sources of information about the new technology, but also use different platforms as they become available and the OS updates on smartphones. If we perceive the choice of a platform as a learning process, then if one platform has a natural advantage over the others, it allows the platform to take a dominant position, since users “learn in the process of learning” about this advantage. Conversely, if no platform has any advantages over the other, the leaders will continue to change as competitors lose / take advantageous market positions.
The graph shown above seems to indicate that the iPhone logistics pattern has characteristics that allow the company to benefit from the learning pattern. Alternative platforms, in this case, are simply trying to manipulate the current position in search of temporary advantages.
This is a curious hypothesis. To develop it further, you need to answer the question, what advantages can be gained in the learning process. I suspect that they are related to the ability to address unmet and implicit needs. In other words, the winning product solves a set of tasks like “ jobs to be done ”, the occurrence of which is difficult to “calculate” in advance.
Notes:
- Tardat was probably influenced by the mathematician Pierre Francois Verhulst, who first published materials on the logistic function in 1845.
- Of course, investors often lose their investment when a new technology appears on the horizon. As technology develops, the individual companies supplying them often fail. Take a look at the history of transport, communications, computing and energy.
- Quote from The Rise and Fall of Infrastructures, Physica-Verlag 1990
Source: https://habr.com/ru/post/222643/
All Articles