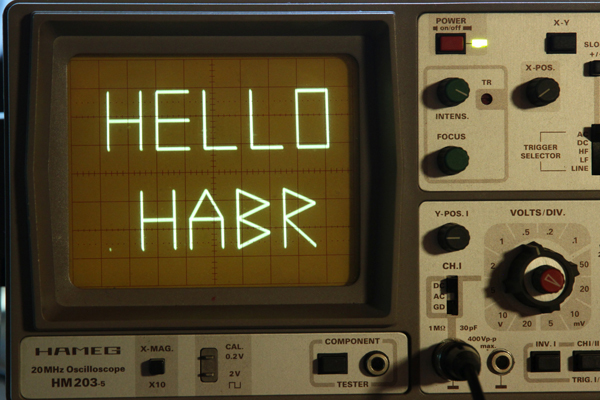
We draw on the screen of an oscillograph
 My first acquaintance with the oscilloscope took place in the school radio circle, then I learned about the XY mode, in which the scanning is turned off and the beam is controlled directly by the voltages applied to the X and Y inputs. Again this topic surfaced a few years later, at the university, when in laboratory work With the help of Lissajous figures, we learned to determine the frequency multiplicity of signals. Then I went to work as a programmer, and for the next couple of decades I did not return to the ray running across the screen until at the end of last year my neighbors called me. Putting in order in the basement, they stumbled upon an old box with electronics, which they immediately gave me, in exchange for the obligation to take it all away. So I got an old analog oscilloscope, at least 25 years old. Surprisingly, after replacing the old network cable, it immediately started working, and I decided to use my programming skills to draw something on the screen.
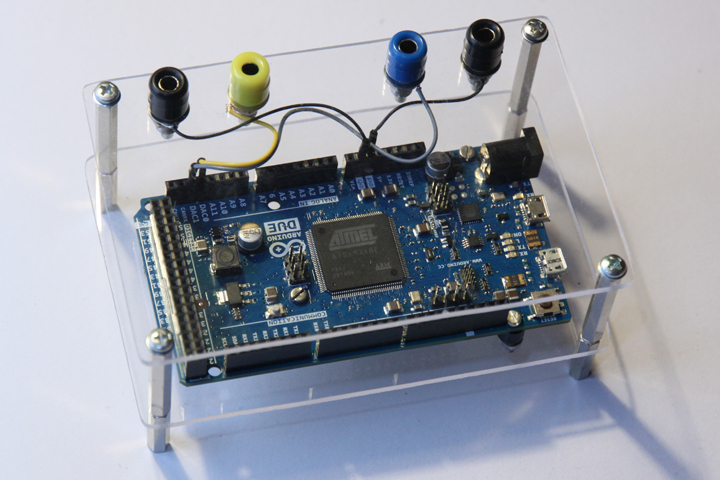
 On the Internet, there were examples of audio files created on a computer that should be played by connecting the inputs of the oscilloscope to the right and left channels of the audio card. Some of them are not even afraid to listen to the human ear. I also wanted to control the oscilloscope beam directly from the program, in real time, so I chose a microcontroller. The Arduino DUE has two 12-bit D / A converters on board, and a clock frequency of 84 MHz and 96 KB of memory reduces the requirements for optimizing programs. When writing code, you can put the readability of the code ahead of speed, while the controller still copes with the creation of fairly complex images. No shields or other external electronics are required, the oscilloscope can be connected directly to the arduink outputs:
')
A simple graphic library was created with functions for drawing points and lines, plus the ability to set the drawing speed. I don’t think it makes sense to retell the Brezenheim algorithm; I ported it almost unchanged from Wikipedia. All source code is freely available on GitHub . The program consists of a dozen classes of heirs to GraphBase, each of them draws a simple plot on the screen. For example, a moving text, a Christmas tree, or a holiday salute. The oscilloscope was put the Christmas tree in the form of an e-card, so the motifs are mostly New Year's.
It is better to see once than read a hundred times, so I immediately turn to the video:
The experimental results and conclusions:
- I tried to connect a modern digital oscilloscope to the microcontroller, but the picture on the analog is much more pleasant. Smoothly fading afterglow of the phosphor creates a “warm tube” atmosphere.
- Arduino DUE in a split second copes with the calculation of trigonometric functions, the speed is enough to calculate the coordinates of the "flower" in real time. For Lissajous figures, a greater amount of computation is needed, so the microcontroller has to first calculate the sine table and use integer arithmetic.
- VisualStudio with free Visualmicro plugin is much more convenient than native Arduino IDE.
- Drawing on an oscilloscope is pretty simple. Debugging code on the Arduino can be difficult, but in this case it is hardly needed.
- DACs have a final speed, so when switching from one line to another, first the voltage at output X, and then at output Y switches, artifacts appear on the screen. Visible in the form of individual points, for example, on the frames with a floating inscription "2014".
In general, in my opinion, it turned out very nice. The next logical step is to replace the oscilloscope with a pair of mirrors on galvanometers, and draw a laser beam on the wall.
Source: https://habr.com/ru/post/221591/
All Articles