Data based monitoring
When working on Webzilla cloud services, we pay great attention to the monitoring system. We are confident that only with properly working and reliable monitoring, we can provide service at the level of quality required by customers. While working on the first of the company's cloud products, the Webzilla Instant Files cloud storage, we started building a monitoring system before we started building the product itself, we thought out monitoring for each function at the planning stage.
Our monitoring system has several objectives:
We worked on the monitoring system not less time than on the functional part of the service - and we share our accumulated experience.
In general, our monitoring system consists of three main subsystems:
')
Usually, when they say “monitoring,” this word means event monitoring (
In the simplest case - if the server is turned off (for example, due to a power outage) - this data has a simple form: 1 server is available less than we expected. If the situation is more complicated: for example, for some reason, the application has gradually degraded and it has become slower to respond to requests, measurements can show, for example, that "the 95th percentile of response time has doubled in the last week." At the same time, a specific point in time when the system “broke down” does not exist. The frog cannot name the exact time when boiling water formed around it.
In other words, it is usually not difficult to reformulate usual events in a data language, but the data have their own added value. We decided to build data-driven monitoring.
First we collect data. Then we make decisions.
We chose Ganglia to collect operational data. Several of its features proved useful to us:
Ganglia consists of three component types:
Ganglia is easy to configure so that data is available and not lost during an accident. The system supports multicast configuration of monitoring daemons. This means that all collected operational data is delivered to each node in the cluster and stored on it. After that, the meta-daemon chooses which of the monitoring daemons to interrogate and polls it. If polling fails, the next node in the cluster is polled. The process continues until either success is achieved or the entire cluster is bypassed.
Configuring such a system is quite simple.
Cluster membership is defined in the gmond.conf daemon configuration file
All nodes of the cluster should have the following lines in the configuration of the monitoring daemon, allowing multicast data to be sent:
and receive data from other nodes
In addition, the meta-daemon must be allowed to poll:
The meta-daemon itself through its configuration file gmetad.conf must be configured to bypass all nodes in turn:
The configuration described above is depicted as follows:

Ganglia monitoring demons communicate with each other. A meta daemon polls one monitoring daemon from a cluster. With his inaccessibility, he refers to the following - and so on. The web frontend receives XML from the monitoring daemon and displays it in human-readable form.
The described approach allows to collect operational data from all clusters. Each cluster has its own characteristics related to the nature of the data collected. We have many subsystems that are different from each other - but at the same time we have one method to control them all. I will mention only two examples:
If you are interested to see how the Ganglia web front-end looks like, you can do this on the open front end of Wikipedia . We use the same default interface. He looks unfriendly, but not make friends with him for long. In addition, he has a very decent mobile version , which pleases the manager. The ability to compulsively monitor the work of the system, being anywhere and at any time is priceless.
Logs are important for three reasons:
For the organization of the system of collecting logs, we chose Logstash

You can not go past the project with such a nice logo
We configured Logstash as an rsyslog server . Thanks to this, Logstash can collect logs from any software that can write to syslog.
Having a simple system for collecting logs is not enough. We want to benefit from it. The centralized log repository carries several advantages at once.
When the number of servers is measured in dozens, not to mention hundreds, the convenience of working with logs matters. This convenience has two aspects: flexibility and ease of use.
Logstash can be used in conjunction with software that provides these capabilities - Elasticsearch and Kibana .
Elasticsearch is a search system equipped with a REST API built on the basis of Apache Lucene . The presence of an API makes the system flexible.
Kibana is a web front end capable of running on top of Elasticsearch. He is responsible for ease of use. Kibana's work can be seen on the demo page.
When someone builds a monitoring system, it may not have a system for collecting logs or operational data (although this is wrong). But it definitely has event monitoring - in fact, the search for “Habrahabru” tells us that when discussing monitoring, people mean, first of all, its event component.
Event monitoring is important because it provides the main interfaces for the interaction of support operators with the system. It serves as a dashboard for them and sends notifications.
We chose Shinken as an event monitoring system. This is a Nagios-like monitoring system, but not a fork of Nagios. Shinken was rewritten completely from scratch, while maintaining compatibility with plug-ins for Nagios.
On the website of the system it is advertised as having the following features:
In “concentrating on the impact on business” and “finding root problems” we did not find much value for ourselves: in fact, the logic that Nagios provides for this is enough.
In terms of scalability and reliability, Shinken provides interesting opportunities.
Shinken is a truly modular system. One of the main innovations presented in Shinken is a clear division into various demons:
Each of these demons can run completely independently of the others. In addition, you can run as many demons as you need (except for the arbiter).
Providing a reservation for arbitrators is fairly straightforward. Each demon can have a spare copy. The configuration parameter 'spare' is responsible for this. In determining the principal arbitrator, he is set to zero,
and when configuring the spare - unit
When the chief arbiter fails, the substitute takes control. If arbitrators are configured identically (and this is the only correct way to tune them), the loss of connectivity between them does not threaten anything. The spare will do everything the same as the main one and will not do any harm.
A description of event monitoring would be incomplete, do not we mention the events that we are tracking. Many of them are quite specific (and therefore of little interest to most readers), others are very general (and therefore well described in a dozen other places). However, a couple of them are closely related to the entire system described above and therefore are of interest.
You can come up with many definitions of a “live” host. Some believe that a host responding to ICMP can be considered alive. In reality, choosing the right definition is not a big deal. What is important is the service running on the host, not the host itself. The main reason why we need to know whether the host is alive or not in some formal sense is the correct definition of dependencies. Having built the described system, we received a check for the liveliness of the host “for free”. Each host must send their data to Ganglia. As long as he really sends them away - in a sense he is "alive." If he does not, he is not exactly fine. We verify the availability of this data with a Ganglia plugin for Nagios , slightly modified for our purposes.
Having a system for collecting operational data, it would be unwise to not use it in event monitoring. The easiest way to do this is to compare the resulting values with some threshold values. The Ganglia-plugin for Nagios mentioned in the previous paragraph does it out of the box.
High-level interaction monitoring component
It is easier to understand than to draw.
The application cluster sends operational data to Ganglia, logs to Logstash and event checks to Shinken.
Ganglia sends data on the “liveliness” of the hosts and the verification of the operational data to Shinken.
Shinken processes the output in two ways. It sends notifications to operators and runs event handlers that fix some problems.
Logs, operational data and information about events are sent to the “dashboards” - Kibana, Ganglia web frontend and Shinken web, respectively, where they are watched by operators.
The monitoring system, which we built, did not reflect as a panacea corresponding to some “correct” practices. Nevertheless, in life she proved to be a reliable helper on whom you can rely.
The main element of our system for the prevention and handling of emergency situations is our support team, which operates continuously. We did not try to come up with an autonomous system capable of working without human intervention.
The fact that she works in our environment does not mean that she will work in another without making changes to it. Monitoring is a part of our common ecosystem, which includes both technical measures (such as the availability and proper use of the configuration management system) and business processes in the work of our support team.
Nevertheless, we are sure that our approach is quite flexible and can be applied in one form or another in a fairly wide range of situations that are encountered in their work by teams supporting IT services.
Our monitoring system has several objectives:
- In the event of a failure, we should not waste time trying to determine what happened. We must immediately and firmly know this.
- To prevent the maximum number of failures to the point where they affect customers, we need to monitor metrics and events foreshadowing problems.
- After any incident, we must have full access to all the data needed to investigate its causes, even if at the time of the removal of the cause it was not clear.
- Our support team must respond to failures promptly and correctly. The only way to achieve this is to provide employees with a tool that does not load them with unnecessary information.
We worked on the monitoring system not less time than on the functional part of the service - and we share our accumulated experience.
In general, our monitoring system consists of three main subsystems:
- collection and analysis of operational data;
- collecting and analyzing logs;
- event monitoring and alerts.
')
System for collecting and analyzing operational data
Usually, when they say “monitoring,” this word means event monitoring (
** PROBLEM Host Alert: server01 is DOWN ** ). The cornerstone of our monitoring is continuous work with operational data. The condition of all systems under observation is described by indicators that vary throughout the entire observation.In the simplest case - if the server is turned off (for example, due to a power outage) - this data has a simple form: 1 server is available less than we expected. If the situation is more complicated: for example, for some reason, the application has gradually degraded and it has become slower to respond to requests, measurements can show, for example, that "the 95th percentile of response time has doubled in the last week." At the same time, a specific point in time when the system “broke down” does not exist. The frog cannot name the exact time when boiling water formed around it.
In other words, it is usually not difficult to reformulate usual events in a data language, but the data have their own added value. We decided to build data-driven monitoring.
First we collect data. Then we make decisions.
We chose Ganglia to collect operational data. Several of its features proved useful to us:
- Out of the Box works with clusters;
- Scales naturally;
- It creates a low load on the nodes from which it collects data;
- Supports fault tolerant configuration;
- It mates well with event monitoring systems;
- The toolbar does not require modification by the file.
Ganglia consists of three component types:
- Ganglia monitoring daemon (gmond) - the monitoring daemon Ganglia, running on each node. Gmond collects data from its server and sends it to other nodes.
- Ganglia meta daemon (gmetad) is a Ganglia meta demon polling monitoring demons and collecting metrics. The measurement results collected by the meta-daemon are recorded in a structured form and can be published to an arbitrary set of trusted hosts. The data format is documented . We use this data for graphs in the web interface and informing event monitoring about anomalies.
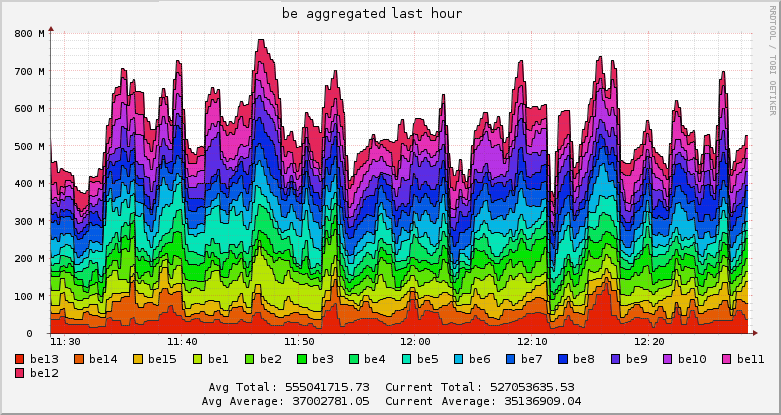
- Ganglia web interface. In an ideal world where all processes are fully automated, it is not necessary to have a web interface to the data collection system. We are quite actively looking at the graphics and identify patterns on their own. You can use any web interface or write your own. We use standard. Each employee can create their own set of graphs for simultaneous display and thus track exactly those parameters that interest him. It is also possible to build aggregated graphs for several hosts.
Ganglia is easy to configure so that data is available and not lost during an accident. The system supports multicast configuration of monitoring daemons. This means that all collected operational data is delivered to each node in the cluster and stored on it. After that, the meta-daemon chooses which of the monitoring daemons to interrogate and polls it. If polling fails, the next node in the cluster is polled. The process continues until either success is achieved or the entire cluster is bypassed.
Configuring such a system is quite simple.
Configuring Ganglia
Cluster membership is defined in the gmond.conf daemon configuration file
cluster { name = "databases" ... } All nodes of the cluster should have the following lines in the configuration of the monitoring daemon, allowing multicast data to be sent:
udp_send_channel { mcast_if = eth0 mcast_join = 239.2.11.71 port = 8651 ttl = 1 } and receive data from other nodes
udp_recv_channel { mcast_if = eth0 mcast_join = 239.2.11.71 port = 8651 bind = 239.2.11.71 } In addition, the meta-daemon must be allowed to poll:
tcp_accept_channel { port = 8649 } The meta-daemon itself through its configuration file gmetad.conf must be configured to bypass all nodes in turn:
data_source “databases” node_1_ip_address node_2_ip_address … node_N_ip_address The configuration described above is depicted as follows:
Ganglia monitoring demons communicate with each other. A meta daemon polls one monitoring daemon from a cluster. With his inaccessibility, he refers to the following - and so on. The web frontend receives XML from the monitoring daemon and displays it in human-readable form.
Practical use
The described approach allows to collect operational data from all clusters. Each cluster has its own characteristics related to the nature of the data collected. We have many subsystems that are different from each other - but at the same time we have one method to control them all. I will mention only two examples:
- Our management systems, collection of information about resource consumption and billing are written in ruby. For ruby, there is a gmetric gem designed by Ilya Grigorik. With it, during the development phase, we included billing into the monitoring system in a couple of days. Immediately after this, we found several bottlenecks and eliminated them.
- The most important software we use is Openstack Swift . Data collection from it is organized using StatsD . StatsD, in turn, has a backend for Ganglia - and with its help we send data to our collection system.
If you are interested to see how the Ganglia web front-end looks like, you can do this on the open front end of Wikipedia . We use the same default interface. He looks unfriendly, but not make friends with him for long. In addition, he has a very decent mobile version , which pleases the manager. The ability to compulsively monitor the work of the system, being anywhere and at any time is priceless.
Log collection and analysis system
Logs are important for three reasons:
- Logs are the most important element of post-mortem and incident analysis. If something is broken, you need to examine the logs in order to understand the causes of the incident.
- Logs help identify problems. We know for sure that this or that program behavior causes problems to our users and this behavior can be monitored using logs.
- Logs also provide some metrics. You can consider the frequency of certain events using logs and send it to the system for collecting operational data.
For the organization of the system of collecting logs, we chose Logstash
You can not go past the project with such a nice logo
We configured Logstash as an rsyslog server . Thanks to this, Logstash can collect logs from any software that can write to syslog.
Having a simple system for collecting logs is not enough. We want to benefit from it. The centralized log repository carries several advantages at once.
Indexing and searching
When the number of servers is measured in dozens, not to mention hundreds, the convenience of working with logs matters. This convenience has two aspects: flexibility and ease of use.
Logstash can be used in conjunction with software that provides these capabilities - Elasticsearch and Kibana .
Elasticsearch is a search system equipped with a REST API built on the basis of Apache Lucene . The presence of an API makes the system flexible.
Kibana is a web front end capable of running on top of Elasticsearch. He is responsible for ease of use. Kibana's work can be seen on the demo page.
Event Monitoring
When someone builds a monitoring system, it may not have a system for collecting logs or operational data (although this is wrong). But it definitely has event monitoring - in fact, the search for “Habrahabru” tells us that when discussing monitoring, people mean, first of all, its event component.
Event monitoring is important because it provides the main interfaces for the interaction of support operators with the system. It serves as a dashboard for them and sends notifications.
We chose Shinken as an event monitoring system. This is a Nagios-like monitoring system, but not a fork of Nagios. Shinken was rewritten completely from scratch, while maintaining compatibility with plug-ins for Nagios.
On the website of the system it is advertised as having the following features:
- smart filtering and root problem detection leading to fewer unnecessary alerts;
- focus on “business impact”;
- scalability;
- reliability.
In “concentrating on the impact on business” and “finding root problems” we did not find much value for ourselves: in fact, the logic that Nagios provides for this is enough.
In terms of scalability and reliability, Shinken provides interesting opportunities.
Scaling and failover
Shinken is a truly modular system. One of the main innovations presented in Shinken is a clear division into various demons:
- Pollers - run checks and return results;
- Reactionners - react to results by sending notifications or triggering event handlers;
- Schedulers - distribute tasks between pollers and results between reactionaries. Schedulers have some internal intelligence that allows them, for example, if one of the checks returns an error, raise the check queues on which it depends.
- Brokers - get data from schedulers and save them to storage specified with plugins.
- Arbiter - the arbiter knows the entire system configuration and distributes the configuration parts and tasks between schedulers. He checks the performance of other demons, and if, for example, one of the schedulers does not respond, he divides his tasks among others. You cannot have more than one active arbiter in the same cluster.
Each of these demons can run completely independently of the others. In addition, you can run as many demons as you need (except for the arbiter).
Providing a reservation for arbitrators is fairly straightforward. Each demon can have a spare copy. The configuration parameter 'spare' is responsible for this. In determining the principal arbitrator, he is set to zero,
define arbiter{ arbiter_name arbiter-master address master_ip host_name master_hostname port 7770 spare 0 } and when configuring the spare - unit
define arbiter{ arbiter_name arbiter-slave address spare_ip host_name slave_hostname port 7770 spare 1 } When the chief arbiter fails, the substitute takes control. If arbitrators are configured identically (and this is the only correct way to tune them), the loss of connectivity between them does not threaten anything. The spare will do everything the same as the main one and will not do any harm.
A description of event monitoring would be incomplete, do not we mention the events that we are tracking. Many of them are quite specific (and therefore of little interest to most readers), others are very general (and therefore well described in a dozen other places). However, a couple of them are closely related to the entire system described above and therefore are of interest.
Little about checks
Host Liveliness
You can come up with many definitions of a “live” host. Some believe that a host responding to ICMP can be considered alive. In reality, choosing the right definition is not a big deal. What is important is the service running on the host, not the host itself. The main reason why we need to know whether the host is alive or not in some formal sense is the correct definition of dependencies. Having built the described system, we received a check for the liveliness of the host “for free”. Each host must send their data to Ganglia. As long as he really sends them away - in a sense he is "alive." If he does not, he is not exactly fine. We verify the availability of this data with a Ganglia plugin for Nagios , slightly modified for our purposes.
Performance Check
Having a system for collecting operational data, it would be unwise to not use it in event monitoring. The easiest way to do this is to compare the resulting values with some threshold values. The Ganglia-plugin for Nagios mentioned in the previous paragraph does it out of the box.
TL; DR
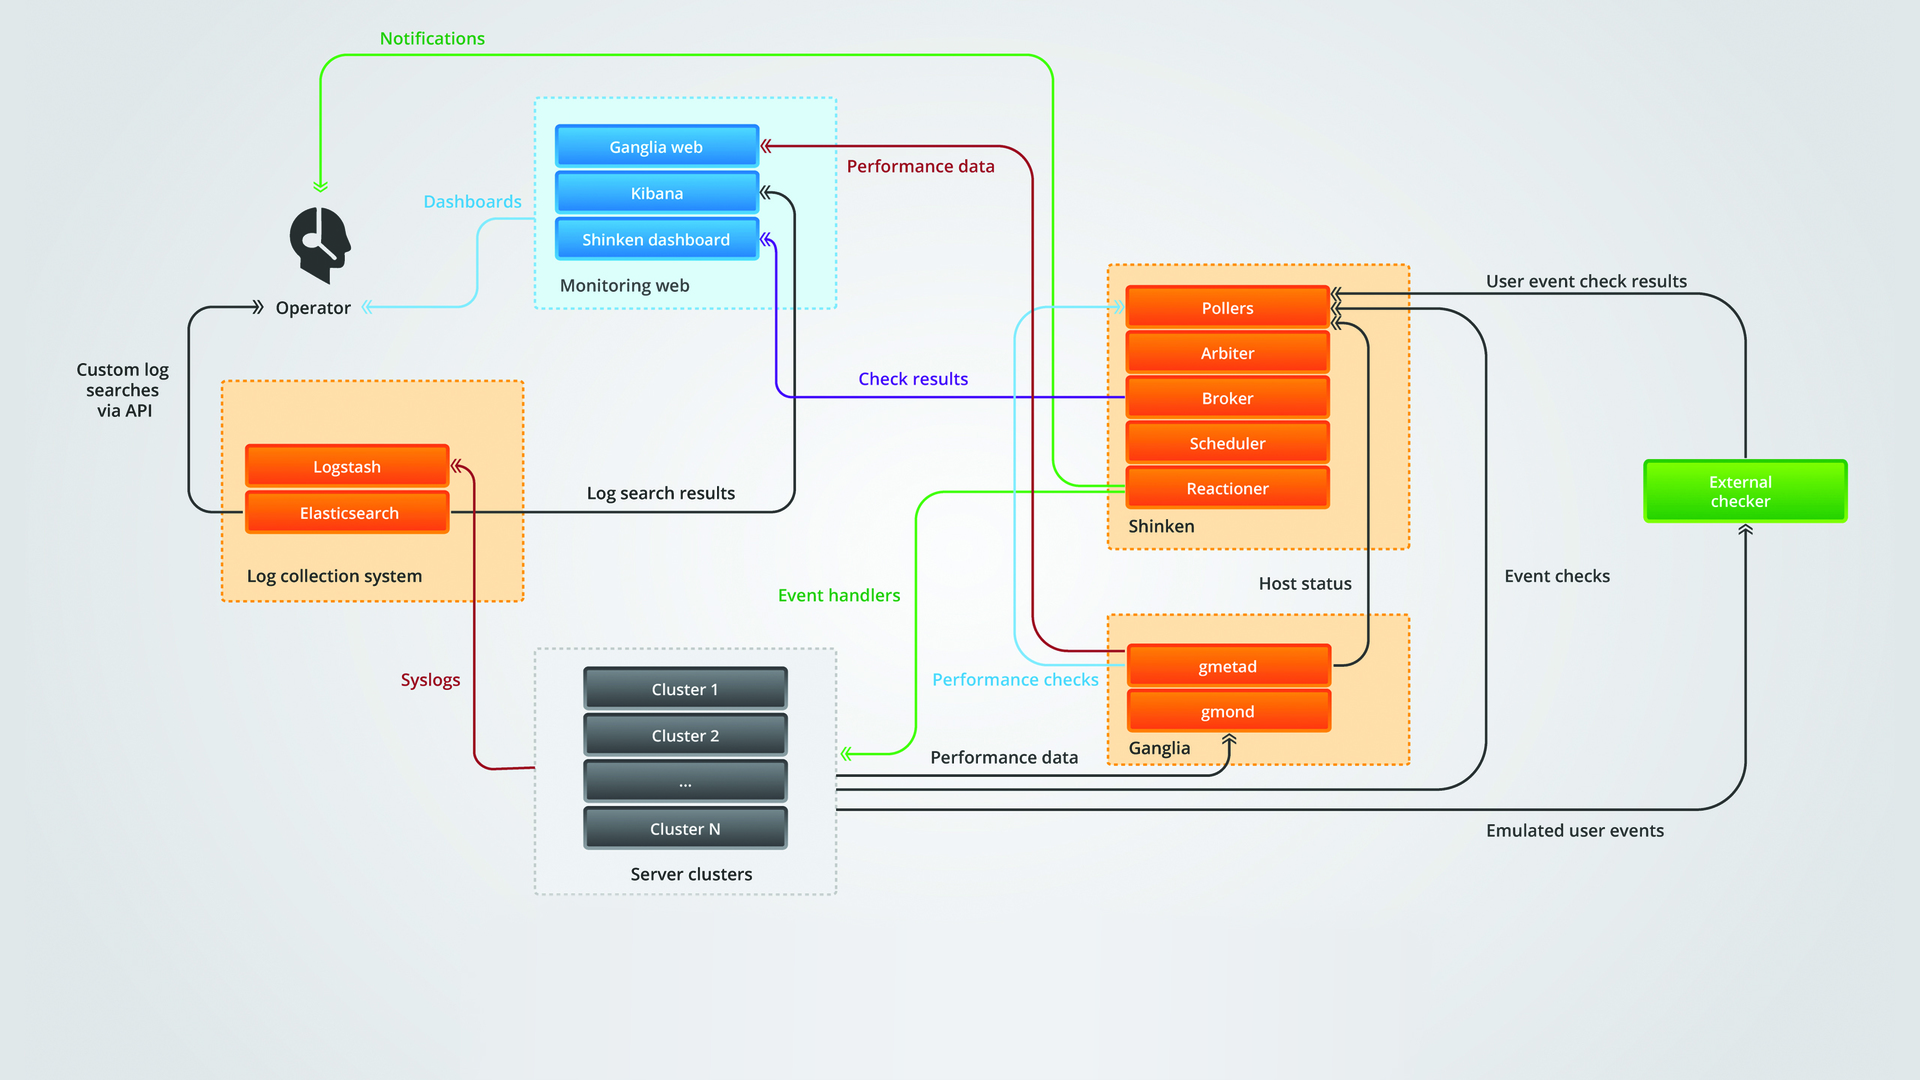
High-level interaction monitoring component
It is easier to understand than to draw.
The application cluster sends operational data to Ganglia, logs to Logstash and event checks to Shinken.
Ganglia sends data on the “liveliness” of the hosts and the verification of the operational data to Shinken.
Shinken processes the output in two ways. It sends notifications to operators and runs event handlers that fix some problems.
Logs, operational data and information about events are sent to the “dashboards” - Kibana, Ganglia web frontend and Shinken web, respectively, where they are watched by operators.
Why did we decide to write about it?
The monitoring system, which we built, did not reflect as a panacea corresponding to some “correct” practices. Nevertheless, in life she proved to be a reliable helper on whom you can rely.
The main element of our system for the prevention and handling of emergency situations is our support team, which operates continuously. We did not try to come up with an autonomous system capable of working without human intervention.
The fact that she works in our environment does not mean that she will work in another without making changes to it. Monitoring is a part of our common ecosystem, which includes both technical measures (such as the availability and proper use of the configuration management system) and business processes in the work of our support team.
Nevertheless, we are sure that our approach is quite flexible and can be applied in one form or another in a fairly wide range of situations that are encountered in their work by teams supporting IT services.
Source: https://habr.com/ru/post/220707/
All Articles