Cisco ASA traffic accounting using NetFlow, nfdump, and MySQL on FreeBSD or Linux (Part 2)
Introduction
A few months ago, I had several Cisco ASA devices of different models. After configuring them, I had a question about counting the traffic that will pass through them. I decided to keep records using the standard NetFlow protocol, which is supported by this equipment. But what a bad luck, to this day there is no free solution for traffic accounting that can normally count and account for traffic by users.
The only thing that could be found on the Internet is the ability to configure the equipment so that it sends NetFlow packets to a specific host, where these packets are stored in files. But the description of how to get normal statistics on users using these files, just was not found. Therefore, I decided to write my own application, which can show statistics on users and keep records of traffic in the company.
The first thing I had to start with was to study this article - http://habrahabr.ru/post/127613/ (the author of gag_fenix has a lot of respect). This is the only normal and complete article on how you can receive and account for traffic on Cisco ASA network equipment using nfdump . This article perfectly describes only the implementation of how to configure the equipment to transfer NetFlow packets to a host, as well as how to use the data for subsequent analysis. The very analysis of traffic and its accounting is not considered in the article.
')
Before reading further, I strongly recommend that you carefully study the above article, as some features of the settings will be omitted. The article will look at such questions as how to keep track of NetFlow (using MySQL on the collector), how to calculate VPN traffic, what type of packets to consider, how to avoid “doubling” and “duplicating” traffic, and how to use my application.
What you need to know about NetFlow, which is used on Cisco ASA equipment
To whom the theory is not interesting, just skip this section.
Looking ahead, I will say the following, that I failed to make friends with other " software " routers that use NetFlow. For example, I could not make a router like pfSense , because the plugin responsible for sending NetFlow provides incorrect data (in my case there were packets where traffic was calculated in terabytes over a period of 10 minutes).
NetFlow v9 is supported by Cisco hardware starting with ASA 5505 .
The average amount of NetFlow traffic in a company will be 10-20 megabytes per hour, so don’t rush to allocate a port for your collector using a 1 Gbit / s switch. In my case, the amount of traffic is no more than 15 megabytes per hour from several Cisco ASA devices.
Now let's start with what type of NetFlow packet or what type of packet to use for traffic accounting. There are 4 types of them: DENIED, CREATED, UPDATED, DELETED (Torn Down) . On the other equipment, only IGNORED is still found, for example, in the same pfSense (there NetFlow packages do not differ in type).
DENIED - NetFlow packets, which indicate which traffic was blocked, the amount of traffic will always be zero in the incoming or outgoing field, therefore we will ignore this type;
CREATED, UPDATED - NetFlow packets that specify initialization ( CREATED ), and periodic traffic updates after initialization ( UPDATED ), these types will also not be taken into account by us for traffic accounting (explanation below);
DELETED (Torn Down) - NetFlow packets, which contain complete information about the traffic that was completed, the amount of incoming and outgoing traffic "always" must satisfy the following formula CREATED + UPDATED = DELETED , this type we will take into account.
In order to avoid " doubling " of traffic, you must use either CREATED + UPDATED packets, or only DELETED . If you use both, your real traffic will be displayed as real traffic multiplied by two! Ideally, you should consider CREATED + UPDATED traffic, as these 2 types give a more accurate idea of how busy your Internet is at the current time. DELETED is the traffic information in which the session has ceased to exist, and for example, if someone in the company puts a very large file download in the morning and stops downloading it in the evening, then the traffic data will be displayed ONLY in the evening!
Alas, but I had to keep track of traffic as DELETED , since there is a bug in the Cisco NetFlow + nfcapd (nfdump) + UPDATED bundle . The bug is that with a certain frequency when parsing nfdump in UPDATED packets, traffic of 4.3 GB is encountered. I could not figure out what caused this bug, or the implementation of the Cisco equipment itself, where the package contains some “tricky” information that nfdump cannot handle, or a bug in the nfcapd + nfdump implementation itself . In the DELETED packages such a bug was not noticed for a couple of months of equipment operation.
How to keep track of NetFlow, including VPN traffic
To whom and this theory is not interesting, also skip this section.
It is clear that we want to consider and take into account only the " real " traffic that comes ONLY from the provider. And we do not want local traffic to be added to this traffic, for example, traffic between the LAN and the DMZ , or traffic between all the " white " hosts on your subnet (the IP address subnet assigned by your provider). Everything is simple here, we consider only such traffic from the NetFlow package, where our local host goes somewhere to the Internet and filter the traffic that goes either to the DMZ , or to some of your " white " IP address, or any VPN subnet (why ignore VPN subnet described below).
The whole snag is based on real traffic, where any type of VPN is used . For example, the following VPN traffic routes: LAN (DMZ) -to-VPN, VPN-to-LAN (DMZ), VPN-to-VPN, VPN-to-INTERNET . So, after analyzing the files using the nfdump utility, I made the following conclusions on how to account for traffic with such routes. If you want to know how much VPN traffic is consumed by your employees, for example, LAN (DMZ) -to-VPN, VPN-to-VPN , then you just have to consider this traffic as it is, that is, just count the amount of traffic that comes from your local subnet or DMZ on the VPN subnet, or VPN-to-VPN (this number will almost accurately reflect the amount of VPN traffic consumed). The received amount of VPN traffic cannot be used for “ real ” traffic accounting, since “ real ” traffic will be displayed between white IP addresses, for example, between your IP office and remote client IP, or between white IP 2x offices. Firstly, this number will fully reflect the amount of VPN traffic between white hosts, and secondly, this number will be significantly higher than the amount of ANY-to-VPN traffic, since this amount will take into account such traffic as VPN-to-INTERNET , as well as additional system traffic.
Thus, traffic accounting must be done on your WAN subnets along with the LAN . We do 2 traffic counts: WAN-to -! (LAN, DMZ, VPN, YOUR WAN) and ! (LAN, DMZ, VPN, YOUR WAN) -to-WAN . So we will accurately take into account all the " real " traffic, as well as the traffic that is initialized on the Cisco ASA themselves, or comes from outside. VPN-to-INTERNET traffic accounting is accounted for exactly the same way as LAN (DMZ) -to-INTERNET .
The final formula for calculating real traffic on NetFlow: (LOCAL-to-INTERNET) + (INTERNET-to-LOCAL)
LOCAL - these are all subnets like WAN, LAN, DMZ, VPN ;
INTERNET - all other traffic that does not apply to WAN, LAN, DMZ, VPN .
In practice, when calculating traffic of the type " INTERNET-to-LOCAL " you will only consider traffic of the type " INTERNET-to-WAN ", since you will not have other NetFlow data, for example, there will be no data like " INTERNET-to- ( LAN, DMZ, VPN) ".
The final formula for calculating VPN traffic over NetFlow: LOCAL-to-VPN
LOCAL - these are all WAN, LAN, DMZ, VPN subnets
This VPN traffic can NOT be summed up with real traffic, as it already includes full statistics on all VPN sessions between VPN_REMOTE_HOST-to-WAN , WAN-to-VPN_REMOTE_HOST . This traffic displays only the approximate amount of traffic that goes through VPN sessions.
From theory to practice or doing sensor and collector training
To begin with, I will write the versions of the software I work with at the time of this writing:
Cisco ASA - ASDM 7.1.6 , ASA 9.1.5 ( http://software.cisco.com/download/type.html?mdfid=279513399 )
Collector (PC Core2Duo, 2GB RAM , 160GB HDD) - Debian 7.4 , MySQL 5.5.35 , Apache 2.2.22 , PHP 5.4.4-14
nfdump 1.6.12 ( http://sourceforge.net/projects/nfdump/files/stable/ )
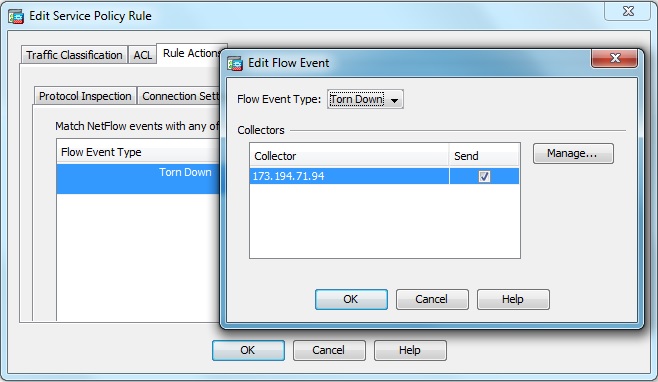
We agreed that only NetFlow packages with a DELETED type will be considered. Therefore, in the ASDM, we will only send this type of packet.
Now we need to prepare the collector. All we need is to download the sources and compile them with NSEL support:
- 1) ./configure --enable-nsel
- 2) make
- 3) make install
Preparation of MySQL database under NetFlow on the collector:
- 1) Create a database: CREATE DATABASE NetFlow CHARACTER SET utf8 COLLATE utf8_general_ci;
- 2) Add a netflow user: GRANT ALL PRIVILEGES ON NetFlow. * TO 'netflow' @ '%' IDENTIFIED BY 'nfpass' WITH GRANT OPTION;
- 3) We reset privileges: FLUSH PRIVILEGES;
- 4) Import a clean database: mysql -u root -p root_pass NetFlow </var/www/netflow/setup/netflow.sql (where root_pass , the password from your MySQL server).
MySQL optimization:
In our case, we will need to change the default settings, since the database will use more resources than is written in the default MySQL config. For example, only one INSERT request may be several megabytes. The main task is to ensure that all INSERT requests pass, and the data are not lost, as I had at the very beginning of the study. And also to optimize the performance of SELECT queries so that the database sends the data at a reasonable time. I could not optimize the base for InnoDB , so I use MyISAM .
Let me remind you that I have 2GB RAM installed on my collector, so in your case the parameters may differ both up and down. I will give my settings that helped me optimize MySQL :
skip-innodb
default-storage-engine = MyISAM
sort_buffer_size = 4M
myisam_sort_buffer_size = 256M
key_buffer = 256M
max_allowed_packet = 32M
read_rnd_buffer_size = 2M
thread_stack = 2M
thread_cache_size = 16
query_cache_limit = 32M
query_cache_size = 128M
Rebooting MySQL : /etc/init.d/mysql restart
If you have any problems with optimization, use the perl script from http://mysqltuner.com/
All the details of the use and optimization are written on the website, as well as during the execution of the script.
We define our subnets in the database:
Open your browser and follow the link / netflow / networks
Describe all your local subnets by LAN, DMZ, WAN, VPN
Next, specify the subnets that belong to the VPN , for example, the subnet of the remote office or the subnet of remote clients.
We start our collector:
Before starting, check that you have installed the plugin php5-mysql or php5-mysqlnd
/ usr / local / bin / nfcapd -t 600 -w -p 9995 -l / netflow / nflogs -D -x '/ usr / bin / php5 /var/www/netflow/scripts/netflow.php% d /% f '
"/ netflow / nflogs" is the path to the logs;
"/ usr / bin / php5 /var/www/netflow/scripts/netflow.php% d /% f" is the start of a php script after the file with logs is created.
This script is the heart of traffic accounting, which collects statistics every 10 minutes, processes it and puts traffic data into the database, as well as cleans outdated data. The script is optimized for the time interval for collecting statistics every 10 minutes, so do not change the parameter " -t 600 ".
If everything is done correctly, then NetFlow packets will come to your collector. You can see the command: " tcpdump port 9995 ". If the packets come from your equipment to the port, then everything is fine, otherwise you have incorrectly configured your tsiska.
Total
This completes the configuration of the collector. Now you can observe in detail who and how uses the Internet in your office. This will help you 2 additional scripts that are in the folder " / netflow " and " / netflow / admin ". The first script you can scare your employees to watch their own traffic, and use the second script for administrative viewing of all statistics.
Installation and description of my scripts
You can download the application here netflow.tar.gz , then unpack and copy the folder / netflow to the root of your WEB directory, for example / var / www
There are several files in the archive:
\ netflow \ setup \ crontab - nfcap.sh script run every 5 minutes is registered in the crown;
\ netflow \ setup \ nfcap.sh is a script that checks the survivability of the nfcapd service and starts it if it is not started;
\ netflow \ scripts \ netflow.php - a script that collects traffic information and puts it into the MySQL database ;
\ netflow \ index.php - user script to view its statistics;
\ netflow \ admin \ index.php - administrative script to view all statistics in the office;
\ netflow \ networks \ index.php is a script with which you can manage subnets and maintain details on them.
All files should be protected from users, except \ netflow \ index.php , for example through .htaccess
Some lyrics or how my application works
Now I will tell about the work of my application. Who is not interested, feel free to skip this section, you have already received a free tool that keeps track of traffic in almost real time.
First, I apologize for my “French”, as the scripts that display the statistics are written in an inconvenient form, from the point of view of programming. I have my own excuses for this: I have not been programming for a long time, I have almost no experience in writing WEB applications, I really don’t know the structure of HTML and I don’t know the rules by which HTML pages are built using PHP .
Secondly, in spite of the above, I tried to optimize and write structuredly the code that collects and processes the statistics, and also puts it into the MySQL database .
For convenience of data display, CSS and jQuery scripts were used.
At the beginning of development I had to meet with several global problems:
- 1) What netflow traffic count?
- 2) How to calculate traffic and how to take it into account in MySQL ?
- 3) How to take into account statistics TOP-20 ?
- 4) How to get more detailed statistics?
I tried to answer the first question at the beginning of this article. In view of the long analysis of files using nfdump , I had to change the structure of my database several times, then complicate it, then simplify it.
The second question was also answered at the beginning of this article. The only thing that had to be done was to optimize data collection in such a way that the base would not swell to enormous size. Therefore, there is only one NetFlowData table in the database , which stores all the logs for the last 2 days . This table can easily add about 100 megabytes per day. Therefore, I use this table for DEBUG 'a. All other tables are optimized using data grouping.
Before answering the third question, I will say that only INTERNET traffic is collected in TOP-20 , and it does not include subnets like ANY-to-LAN , ANY-to-DMZ , ANY-to-VPN , LOCAL-to-WAN . I could not solve the problem for a long time considering TOP-20 , since the table in the database inflates to large sizes, about 100 thousand entries every 10 minutes . As a result, the size of the table easily adds 50 megabytes per day. Optimizing it turned out only one way, it is to collect the full statistics per day, and then group the data in such a way, where the sum of UPLOAD or DOWNLOAD is more than 1 megabyte. Thus, the number of entries in the table has fallen sharply to several thousand lines. Even if any traffic is not taken into account, the TOP-20 will still adequately display the statistics with minimal error.
It would seem that you can stop at this, but I wanted to do the hourly detailing in order to know the amount of traffic consumed by a particular user at certain hours. Here I had to complicate the code in the scripts that are responsible for displaying data.
And finally, here are some screenshots of my application: user.jpg , admin.jpg , top20.jpg , networks.jpg
Thank you all for your attention, enjoy your health!
Source: https://habr.com/ru/post/220431/
All Articles