Best Practices: Troubleshoot using the 'Top' command in Linux.
Now we are working on a new feature of our monitoring service in order to be able to monitor not only the external parameters of the server, but also internal ones, such as the system load, the status of hard drives, RAM and others. In the process of development, we came across a useful article that tells about the parameters of the system that can be obtained using the top system command, we present the translation of this article to your attention.
Load average may be a difficult indicator of server performance. In this article we will try to give some idea of what the values mean, which can be found in the output of the “top” command and in other linux commands. The article also explains the parameters specific to virtual hosting, which are usually not displayed in the standard output of the top command.
If you type top in the Linux system command line, you will get a sign with the following heading:
Let's analyze the meaning of each of the lines.
')
Shows the command and the current system time; “Uptime”, in our case it is 32 days, 18 hours and 24 minutes; finally, the number of users registered in the system is indicated; in this example, 6 users are registered in the system. They can be connected via SSH, locally, be inactive, etc.
This part shows the average load; it can be confusing, especially in a virtual machine / in the cloud.
The first digit shows the average load of the “last minute”, or “current” average load; the second figure shows “average load in 5 minutes”, the last figure - “average load in 15 minutes”.
The average load is a measure of the average number of processes waiting for their turn to perform an action in the processor. As in the supermarket, you have to stand in line, waiting for the cashier to give you all his attention. The reason why the average load grows is in the rest of the statistics and counters that are below this line, so if you focus strictly on the values of the average load, you can not see the whole picture completely.
This server, besides being an intermediate processing environment for scripts and hosting cloud command line tools, also provides distributed compiler C service to various machines on our network, because it has 8 processors, 32 GB of RAM and a ton of pseudo-disk space. Under normal load, its average value remains relatively low; When executing java-scripts, the load can grow by two or more times. However, when running the compiler service at full load (10 executable processes with a processor load of 95% or more), the average load value is 0.75 ... How does that happen? Try to figure it out
Tasks: shows the number of processes when you type, for example, “ps aux”.
• total The total number of tasks is useful to know in order to detect an apache server that has run out of control or a postgresql instance, but it usually remains fairly stable.
• running The number of running processes shows you how your processor is currently being used. Applications that do not have multi-threading, as a rule, can use 1 processor, so the usual situation is when 1 process uses 25% of the processor of a quad-core server with an average load of ~ 1.
• sleeping The number of waiting processes shows which processes are running, but are not active; these are usually background tasks, system software, printer drivers, etc.
• stopped The number of processes stopped should, as a rule, be 0, if you did not send a SIGSTOP or kill -STOP signal to the process for troubleshooting. If this number is different from 0, then in the case of working servers this may be cause for concern.
• zombie hung processes. This means that a multi-threaded application started a child process, and then it was destroyed or ended unexpectedly, leaving behind a hanging process, known as the zombie process. Apache can spawn a whole bunch of such processes if something out of the ordinary happens. Usually, their number should also be 0.
I will break this information into two parts, they contain statistics that are important for our use.
The first four values listed here are present on all linux servers, and they are familiar to most people.
• % us shows the use of a separate processor (user processes, such as apache, mysql, etc.) up to a maximum value of 100%. Thus, if in a quad-core processor 1 a process uses 100% CPU, this will give a% us value of 25%. A value of 12.5% for an 8-core processor means that one core is occupied.
• % sy means CPU usage by the system. Usually this value is not high, its high values may indicate a problem with the configs of the kernel, a problem on the part of the driver, or a number of other things.
• % ni means the percentage of CPUs used by user processes affected by the use of the nice or renice commands, i.e. essentially their priority has been changed from the default priority assigned by the scheduler to a higher or lower one. When a nice command is assigned to a process, a positive number means a lower priority (1 = 1 step below normal), and a negative number means a higher priority. 0 is the default value, which means that the scheduler makes a priority decision. You can determine which scheduler is used by your system, but this is a more complex topic for the following articles. In addition, any percentage value given in this article is not superimposed on the% us value, which shows only user processes with non-set priority.
• % id - the result obtained by subtracting the three previous values from 100.0%, and measuring the “idle” computing power.
The second set of values is associated with virtualization, and it is for them that we can accurately track the problems that may contribute to a high average load.
• % wa - iowait, percentage of time (cycles, seconds) during which the processor was idle, waiting for the completion of an I / O operation. When a process or program requests data, it first checks the processor's cache (it has 2 or 3 caches), then it checks the memory and, finally, reaches the disk. Having reached the disk, the process or program usually has to wait until the I / O stream transfers information to the main memory before being able to work on it again. The slower the drive, the higher the IO Wait% value for each process. This also happens with writing to disk, if the system buffer is full and needs to be cleaned with the kernel - this is usually observed on database servers with a high load. If the IO Wait value stably exceeds {100 / (number of CPU * number of processes)}%, this means that there may be a storage problem that needs to be dealt with. If you observe high average load, first of all, check this parameter. If it is high, then the bottleneck in the processes that accumulate on the disk, and not in anything else.
• % hi means interrupts at the iron level; on the board, the electrons move along the microcircuits in a predictable way. For example, when a network card receives a packet, before transmitting the information contained in the packet to the processor through the kernel, it will request an interruption in the motherboard's interrupt channel. The processor tells the kernel that the network card has information for it, and the kernel has the ability to decide what to do. The high time spent on processing interrupts at the iron level is quite rare on a virtual machine, but as hypervisors put more and more “hardware” at the virtual machines, this may change. Extremely high network bandwidth, the use of USB, computing on graphics processors - all this can lead to an increase in this parameter by an amount exceeding a few percent.
• % si - interrupt at the software level; linux kernel version 2.4 implements the ability to request an interruption by software (applications), rather than a hardware element or device (driver) requesting an interruption in the motherboard interrupt channel; the request is serviced by the kernel through its interrupt handler. This means that the application can request priority status, the kernel can acknowledge the receipt of the command, and the software will wait patiently until the interrupt is serviced. If we apply the tcpdump utility to a high-traffic Gigabit channel, the value may change by about 10% - as the tcpdump memory is full, the utility sends an interrupt to transfer data from the stack to disk, screen, or anywhere else.
• % st is the most important parameter of all in the list, in my opinion, this is IOSteal%. In a virtualized environment, multiple logical servers can run under one actual hypervisor. For each virtual machine (VM) we assign 4-8 "virtual" CPUs; although the hypervisors themselves may not have (number of VM * number of virtual CPUs per VM). The reason for this is that we do not overload the CPU using our virtual machines, so if we allow one or two VMs to occasionally use 8 processors, it will not adversely affect the entire pool. However, if the number of CPUs used by VM virtual processors is greater than the number of physical ones (or logical ones, in the case of hyper-threaded Xeon processors), then the iosteal value will increase.
iosteal% is a measure of the hypervisor load; the presence in any pool of virtual machines that demonstrate a consistently high value of the iosteal% parameter (more than 15%) may indicate the need to transfer some of the VMs to another part of the pool.
iowait% is a measure of disk performance. In the storage system supported by NetApp, we may not be able to solve the performance problem without moving the volume to a less used, or other NetApp disk. In the case of a local disk (SSD or SAS), this may mean that there are too many VMs in the hypervisor that use disk resources intensively, and it may be necessary to transfer some of these VMs to another part of the pool.
• The average load, in fact, says nothing.
• The % userland parameter (% us) is important for the average load because it says that calculations are being made. For example, mysql, it takes only one thread, so at full load it will use (1 / number of virtual CPUs assigned by the VM). postgresql is multi-threaded, and can use more processors if they are allocated - keep this in mind when creating virtual machines in the hypervisor to prevent:
• % st - iosteal% - the hypervisor load indicator. Creating a stack of 4 postgresql and 6 tomcat servers under one hypervisor can be reasonable from a business point of view, but you will have to compete all the time for processor time.
• % wa - iowait% - an indicator of the amount of time it takes to send your processes to incredibly slow disks, no matter which storage solution you use. Drives, even SSDs, are relatively slow. Adding RAM to increase the kernel buffer may slightly alleviate the problem. RAM is cheaper than a disk, considering how lightning-fast it works compared to it.
If you encounter high iowait or iosteal settings, you can accurately track which drive is the cause with the iostat command. It starts like this:

For more information, see the iostat manual. The breakdown, displayed every second, from which to which drives read / write, as well as all the iosteal or iowait values associated with access to these drives.
A team for using CPUs and processes on a Linux system. It does not show virtual statistics, but displays a process tree, as well as a breakdown of each processor in the system, its use; in addition, it shows the statistics of swapping and memory, allowing you to track down unpleasant memory leaks, coloring it all with pretty colors. In my opinion, this package should be mandatory for all VMs.
Small ad. As we said at the beginning, we are actively testing the monitoring of the internal parameters of the servers. If you want to participate in closed beta testing, please contact us at ht2support@host-tracker.com.
Load average may be a difficult indicator of server performance. In this article we will try to give some idea of what the values mean, which can be found in the output of the “top” command and in other linux commands. The article also explains the parameters specific to virtual hosting, which are usually not displayed in the standard output of the top command.
Output of the top command
If you type top in the Linux system command line, you will get a sign with the following heading:
Let's analyze the meaning of each of the lines.
')
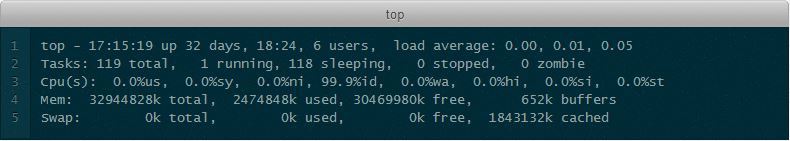
top – 17:15:19 up 32 days, 18:24, 6 usersShows the command and the current system time; “Uptime”, in our case it is 32 days, 18 hours and 24 minutes; finally, the number of users registered in the system is indicated; in this example, 6 users are registered in the system. They can be connected via SSH, locally, be inactive, etc.
load average: 0,00, 0,01, 0,05This part shows the average load; it can be confusing, especially in a virtual machine / in the cloud.
The first digit shows the average load of the “last minute”, or “current” average load; the second figure shows “average load in 5 minutes”, the last figure - “average load in 15 minutes”.
The average load is a measure of the average number of processes waiting for their turn to perform an action in the processor. As in the supermarket, you have to stand in line, waiting for the cashier to give you all his attention. The reason why the average load grows is in the rest of the statistics and counters that are below this line, so if you focus strictly on the values of the average load, you can not see the whole picture completely.
Here is an example taken from the distcc node:
This server, besides being an intermediate processing environment for scripts and hosting cloud command line tools, also provides distributed compiler C service to various machines on our network, because it has 8 processors, 32 GB of RAM and a ton of pseudo-disk space. Under normal load, its average value remains relatively low; When executing java-scripts, the load can grow by two or more times. However, when running the compiler service at full load (10 executable processes with a processor load of 95% or more), the average load value is 0.75 ... How does that happen? Try to figure it out
String tasks
Tasks: 119 total, 1 running, 118 sleeping, 0 stopped, 0 zombieTasks: shows the number of processes when you type, for example, “ps aux”.
• total The total number of tasks is useful to know in order to detect an apache server that has run out of control or a postgresql instance, but it usually remains fairly stable.
• running The number of running processes shows you how your processor is currently being used. Applications that do not have multi-threading, as a rule, can use 1 processor, so the usual situation is when 1 process uses 25% of the processor of a quad-core server with an average load of ~ 1.
• sleeping The number of waiting processes shows which processes are running, but are not active; these are usually background tasks, system software, printer drivers, etc.
• stopped The number of processes stopped should, as a rule, be 0, if you did not send a SIGSTOP or kill -STOP signal to the process for troubleshooting. If this number is different from 0, then in the case of working servers this may be cause for concern.
• zombie hung processes. This means that a multi-threaded application started a child process, and then it was destroyed or ended unexpectedly, leaving behind a hanging process, known as the zombie process. Apache can spawn a whole bunch of such processes if something out of the ordinary happens. Usually, their number should also be 0.
Cpu string
I will break this information into two parts, they contain statistics that are important for our use.
Cpu(s): 0.0%us, 0.0%sy, 0.0%ni, 99.9%id,The first four values listed here are present on all linux servers, and they are familiar to most people.
• % us shows the use of a separate processor (user processes, such as apache, mysql, etc.) up to a maximum value of 100%. Thus, if in a quad-core processor 1 a process uses 100% CPU, this will give a% us value of 25%. A value of 12.5% for an 8-core processor means that one core is occupied.
• % sy means CPU usage by the system. Usually this value is not high, its high values may indicate a problem with the configs of the kernel, a problem on the part of the driver, or a number of other things.
• % ni means the percentage of CPUs used by user processes affected by the use of the nice or renice commands, i.e. essentially their priority has been changed from the default priority assigned by the scheduler to a higher or lower one. When a nice command is assigned to a process, a positive number means a lower priority (1 = 1 step below normal), and a negative number means a higher priority. 0 is the default value, which means that the scheduler makes a priority decision. You can determine which scheduler is used by your system, but this is a more complex topic for the following articles. In addition, any percentage value given in this article is not superimposed on the% us value, which shows only user processes with non-set priority.
• % id - the result obtained by subtracting the three previous values from 100.0%, and measuring the “idle” computing power.
0.0%wa, 0.0%hi, 0.0%si, 0.0%stThe second set of values is associated with virtualization, and it is for them that we can accurately track the problems that may contribute to a high average load.
• % wa - iowait, percentage of time (cycles, seconds) during which the processor was idle, waiting for the completion of an I / O operation. When a process or program requests data, it first checks the processor's cache (it has 2 or 3 caches), then it checks the memory and, finally, reaches the disk. Having reached the disk, the process or program usually has to wait until the I / O stream transfers information to the main memory before being able to work on it again. The slower the drive, the higher the IO Wait% value for each process. This also happens with writing to disk, if the system buffer is full and needs to be cleaned with the kernel - this is usually observed on database servers with a high load. If the IO Wait value stably exceeds {100 / (number of CPU * number of processes)}%, this means that there may be a storage problem that needs to be dealt with. If you observe high average load, first of all, check this parameter. If it is high, then the bottleneck in the processes that accumulate on the disk, and not in anything else.
• % hi means interrupts at the iron level; on the board, the electrons move along the microcircuits in a predictable way. For example, when a network card receives a packet, before transmitting the information contained in the packet to the processor through the kernel, it will request an interruption in the motherboard's interrupt channel. The processor tells the kernel that the network card has information for it, and the kernel has the ability to decide what to do. The high time spent on processing interrupts at the iron level is quite rare on a virtual machine, but as hypervisors put more and more “hardware” at the virtual machines, this may change. Extremely high network bandwidth, the use of USB, computing on graphics processors - all this can lead to an increase in this parameter by an amount exceeding a few percent.
• % si - interrupt at the software level; linux kernel version 2.4 implements the ability to request an interruption by software (applications), rather than a hardware element or device (driver) requesting an interruption in the motherboard interrupt channel; the request is serviced by the kernel through its interrupt handler. This means that the application can request priority status, the kernel can acknowledge the receipt of the command, and the software will wait patiently until the interrupt is serviced. If we apply the tcpdump utility to a high-traffic Gigabit channel, the value may change by about 10% - as the tcpdump memory is full, the utility sends an interrupt to transfer data from the stack to disk, screen, or anywhere else.
• % st is the most important parameter of all in the list, in my opinion, this is IOSteal%. In a virtualized environment, multiple logical servers can run under one actual hypervisor. For each virtual machine (VM) we assign 4-8 "virtual" CPUs; although the hypervisors themselves may not have (number of VM * number of virtual CPUs per VM). The reason for this is that we do not overload the CPU using our virtual machines, so if we allow one or two VMs to occasionally use 8 processors, it will not adversely affect the entire pool. However, if the number of CPUs used by VM virtual processors is greater than the number of physical ones (or logical ones, in the case of hyper-threaded Xeon processors), then the iosteal value will increase.
iosteal% is a measure of the hypervisor load; the presence in any pool of virtual machines that demonstrate a consistently high value of the iosteal% parameter (more than 15%) may indicate the need to transfer some of the VMs to another part of the pool.
iowait% is a measure of disk performance. In the storage system supported by NetApp, we may not be able to solve the performance problem without moving the volume to a less used, or other NetApp disk. In the case of a local disk (SSD or SAS), this may mean that there are too many VMs in the hypervisor that use disk resources intensively, and it may be necessary to transfer some of these VMs to another part of the pool.
Let's sum up:
• The average load, in fact, says nothing.
• The % userland parameter (% us) is important for the average load because it says that calculations are being made. For example, mysql, it takes only one thread, so at full load it will use (1 / number of virtual CPUs assigned by the VM). postgresql is multi-threaded, and can use more processors if they are allocated - keep this in mind when creating virtual machines in the hypervisor to prevent:
• % st - iosteal% - the hypervisor load indicator. Creating a stack of 4 postgresql and 6 tomcat servers under one hypervisor can be reasonable from a business point of view, but you will have to compete all the time for processor time.
• % wa - iowait% - an indicator of the amount of time it takes to send your processes to incredibly slow disks, no matter which storage solution you use. Drives, even SSDs, are relatively slow. Adding RAM to increase the kernel buffer may slightly alleviate the problem. RAM is cheaper than a disk, considering how lightning-fast it works compared to it.
Additional commands
iostatIf you encounter high iowait or iosteal settings, you can accurately track which drive is the cause with the iostat command. It starts like this:
For more information, see the iostat manual. The breakdown, displayed every second, from which to which drives read / write, as well as all the iosteal or iowait values associated with access to these drives.
htopA team for using CPUs and processes on a Linux system. It does not show virtual statistics, but displays a process tree, as well as a breakdown of each processor in the system, its use; in addition, it shows the statistics of swapping and memory, allowing you to track down unpleasant memory leaks, coloring it all with pretty colors. In my opinion, this package should be mandatory for all VMs.
Small ad. As we said at the beginning, we are actively testing the monitoring of the internal parameters of the servers. If you want to participate in closed beta testing, please contact us at ht2support@host-tracker.com.
Source: https://habr.com/ru/post/220413/
All Articles