How are Yandex.Maps organized? Lecture by Vladimir Zaitsev in Yandex
Yandex.Maps is a high-load map portal that works with huge amounts of data. In his lecture, Vladimir Zaitsev tells high school students - students of the Small ShAD - about how to create and maintain such resources, and about the technologies that are used for this. It also explains with examples how to develop tools and conduct research based on the data obtained.
Let's try to figure out what Yandex.Maps is as if we didn't know anything about them, and hear about them for the first time. If you look at them in general, then this is a large site, on which several services are collected:
')
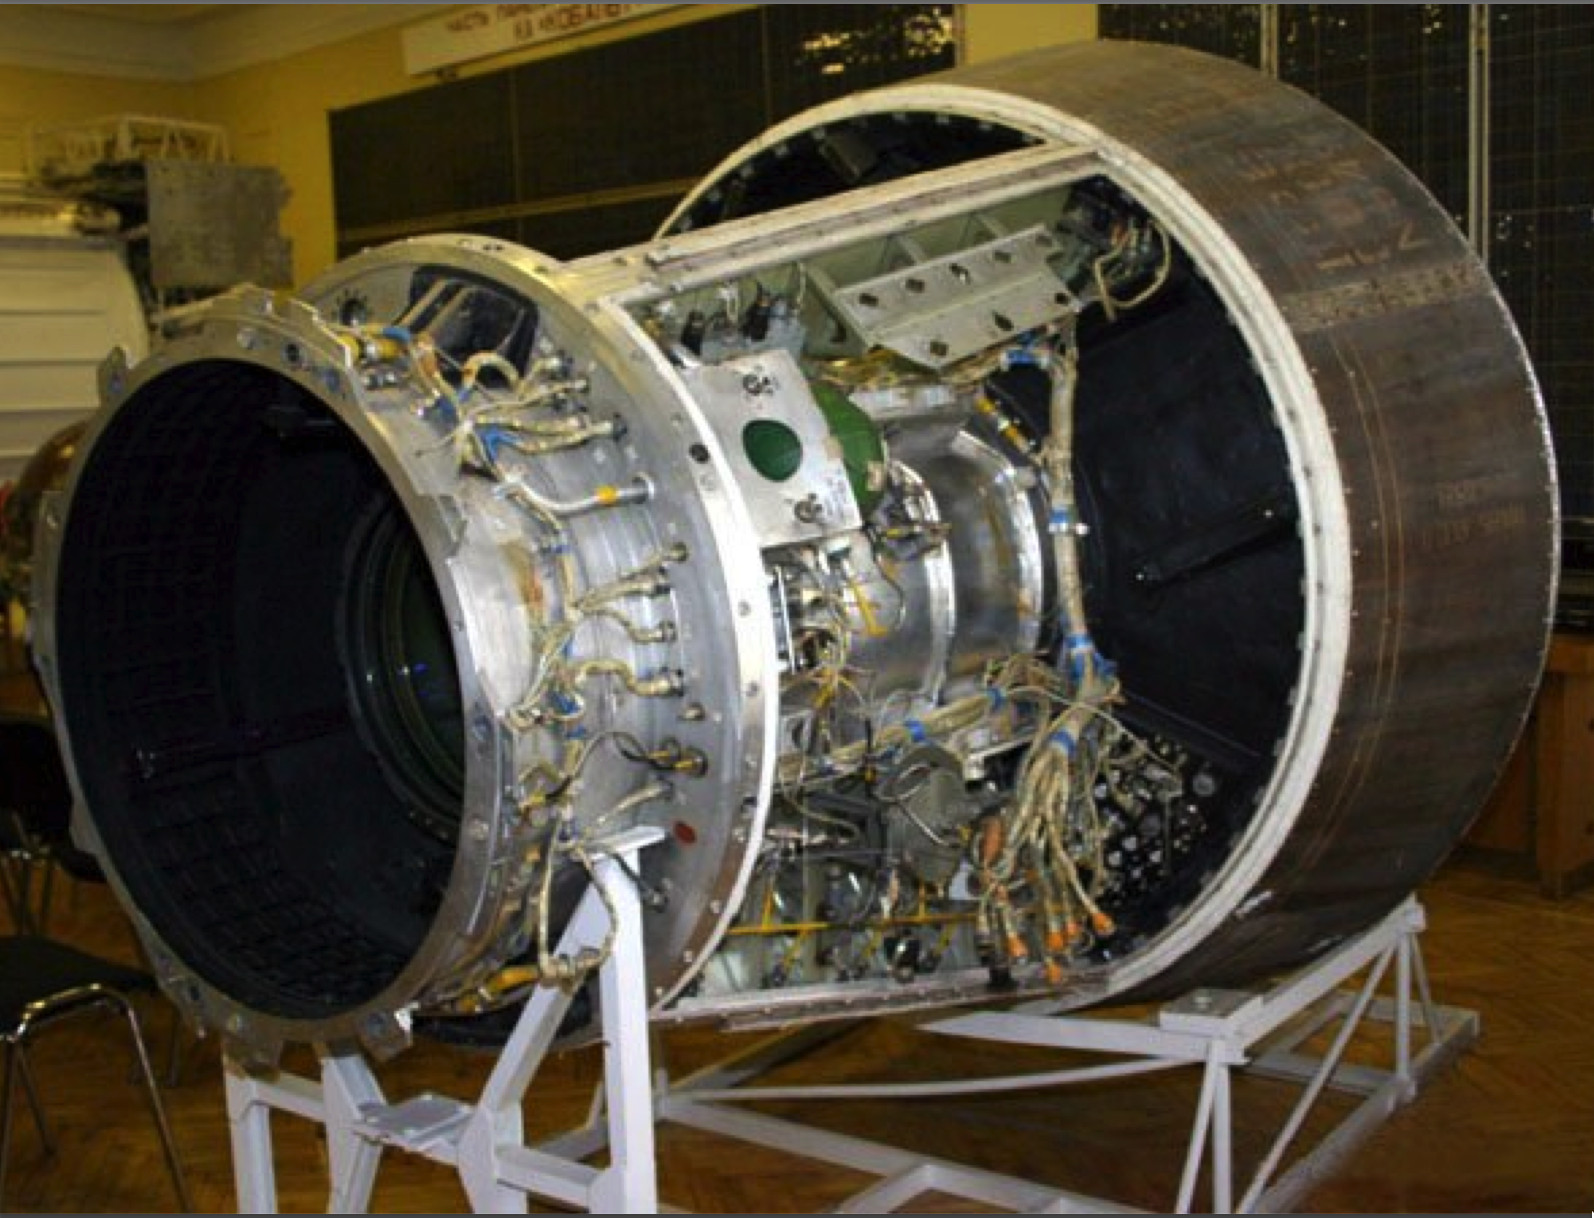
But if you use this method to compile larger maps, the process will be too long and laborious. Therefore, today more technological solutions are used for these purposes. For example, satellite photography. Satellites fly above the Earth at an altitude of 200-500 kilometers and take photographs with the help of such lenses:
The satellite rotates around the Earth, and our planet rotates around its axis, so if we project the satellite's trajectory onto its surface, we get a sinusoid. In this case, the trajectory of the satellite at each revolution will slightly shift, so that after a certain number of overflights, it will be possible to photograph the entire surface of the Earth.
But there are two problems. First of all, the overflights of some territories will definitely come at night. And night satellite images are of purely aesthetic value, for cartography they are meaningless. This must be taken into account, and only light parts should be removed, which may require more spans. The second problem is cloudiness. If a part of the city closes the clouds when shooting, then we will need to shoot this part again the next time the satellite passes over it. But if the next time the satellite flies over this city at another time, the shadows will be directed in a completely different direction. And if we combine the two pictures, we will have a feeling of dissonance. Therefore, such satellites fly in a solar-synchronous orbit, calculated in such a way that each satellite’s span over a certain terrain falls on the same local time.
So, we took pictures, glued pictures, got one big canvas in high resolution. But the shooting was made from a single point, so that some angles will be distorted. To compensate for the distortion you need to re-project the whole picture. Make it as if each photo was taken just above this point.
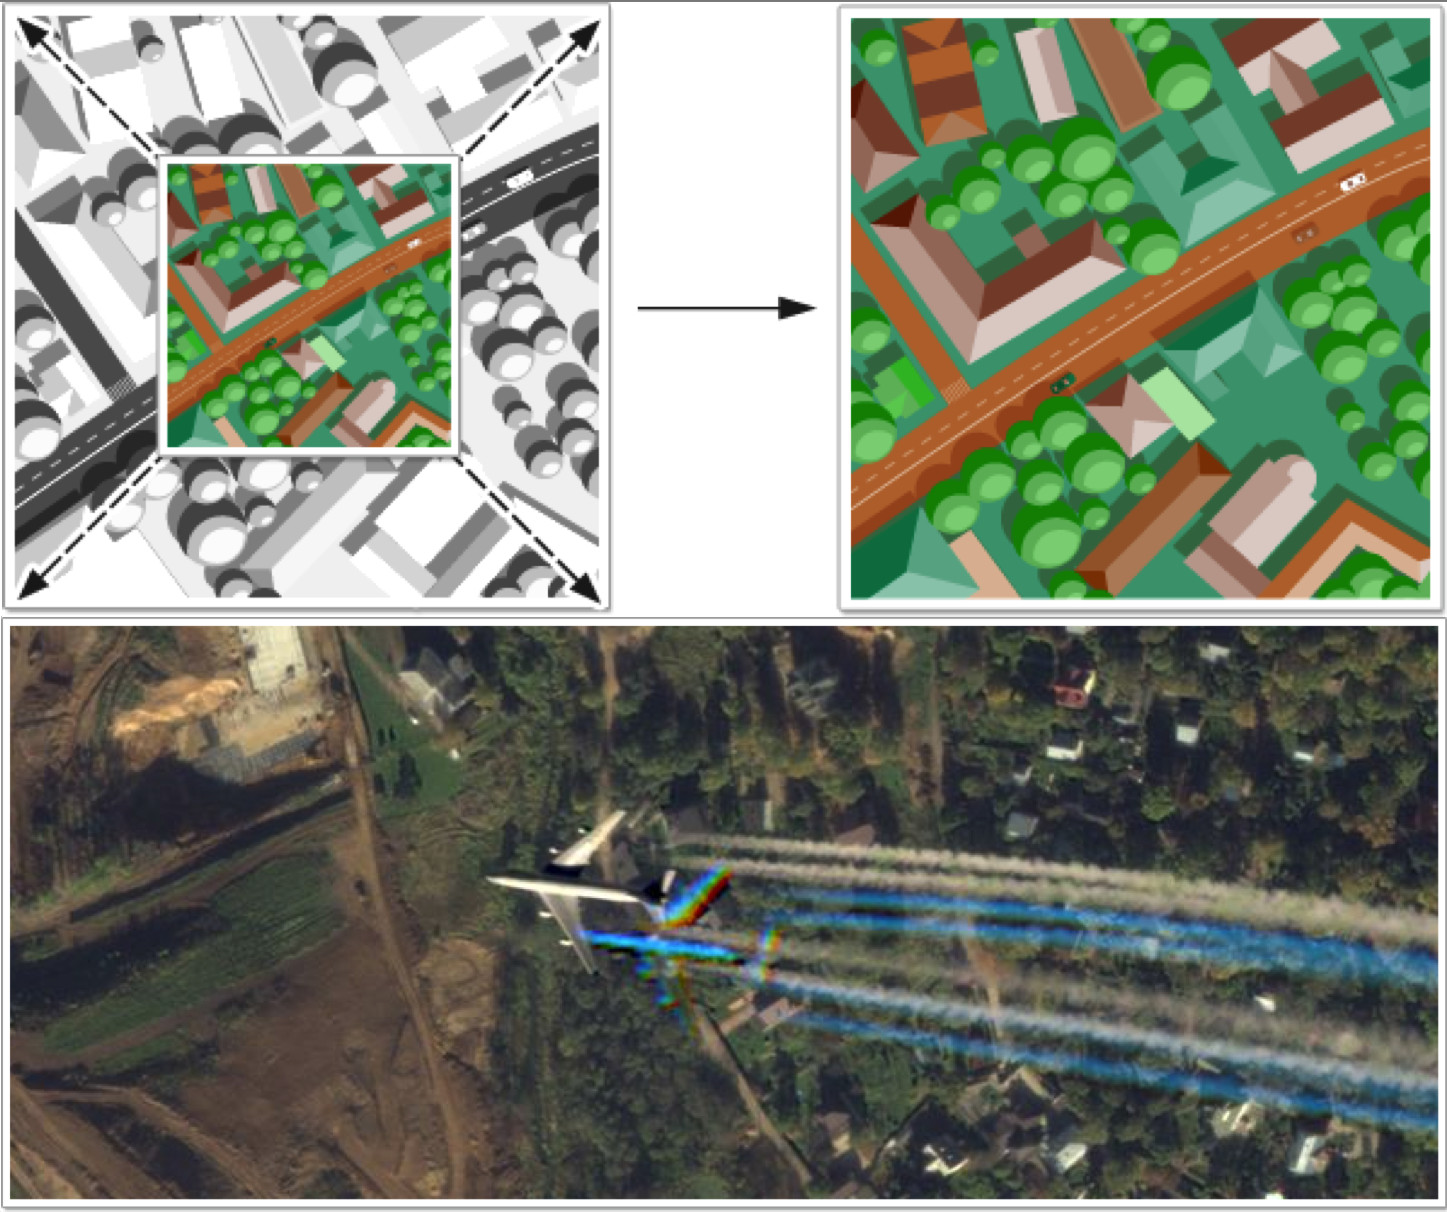
There is another problem with satellite imagery. We want to get color photographs, but when passing through the atmosphere, the light rays of a different spectrum are refracted in different ways. Therefore, a high-resolution color image from space cannot be made. It takes two shots. One is black and white, high resolution, and the second is of lower resolution, but color. Then the color image is stretched and superimposed as a black and white texture. This becomes noticeable when fast-moving objects, such as airplanes, fall into the frame.
So, we made a survey, color correction and other necessary manipulations, put all these terabytes of data into storage, made maps based on them. But why not give the users the satellite images themselves. After all, looking at them is also useful and interesting. On Yandex.Maps, this feature appeared in 2004. The Internet was slower than it is now, and transferring big data was not so easy. Therefore, the big pictures were divided into tiles that fit exactly into one user screen.
But back to the cards themselves. Suppose we were able to mark on the road, at home, sign addresses. As a result, we get this picture:
Now we need to paint this map. If we paint the neighborhoods, houses, roads and ponds in different colors, we get this:

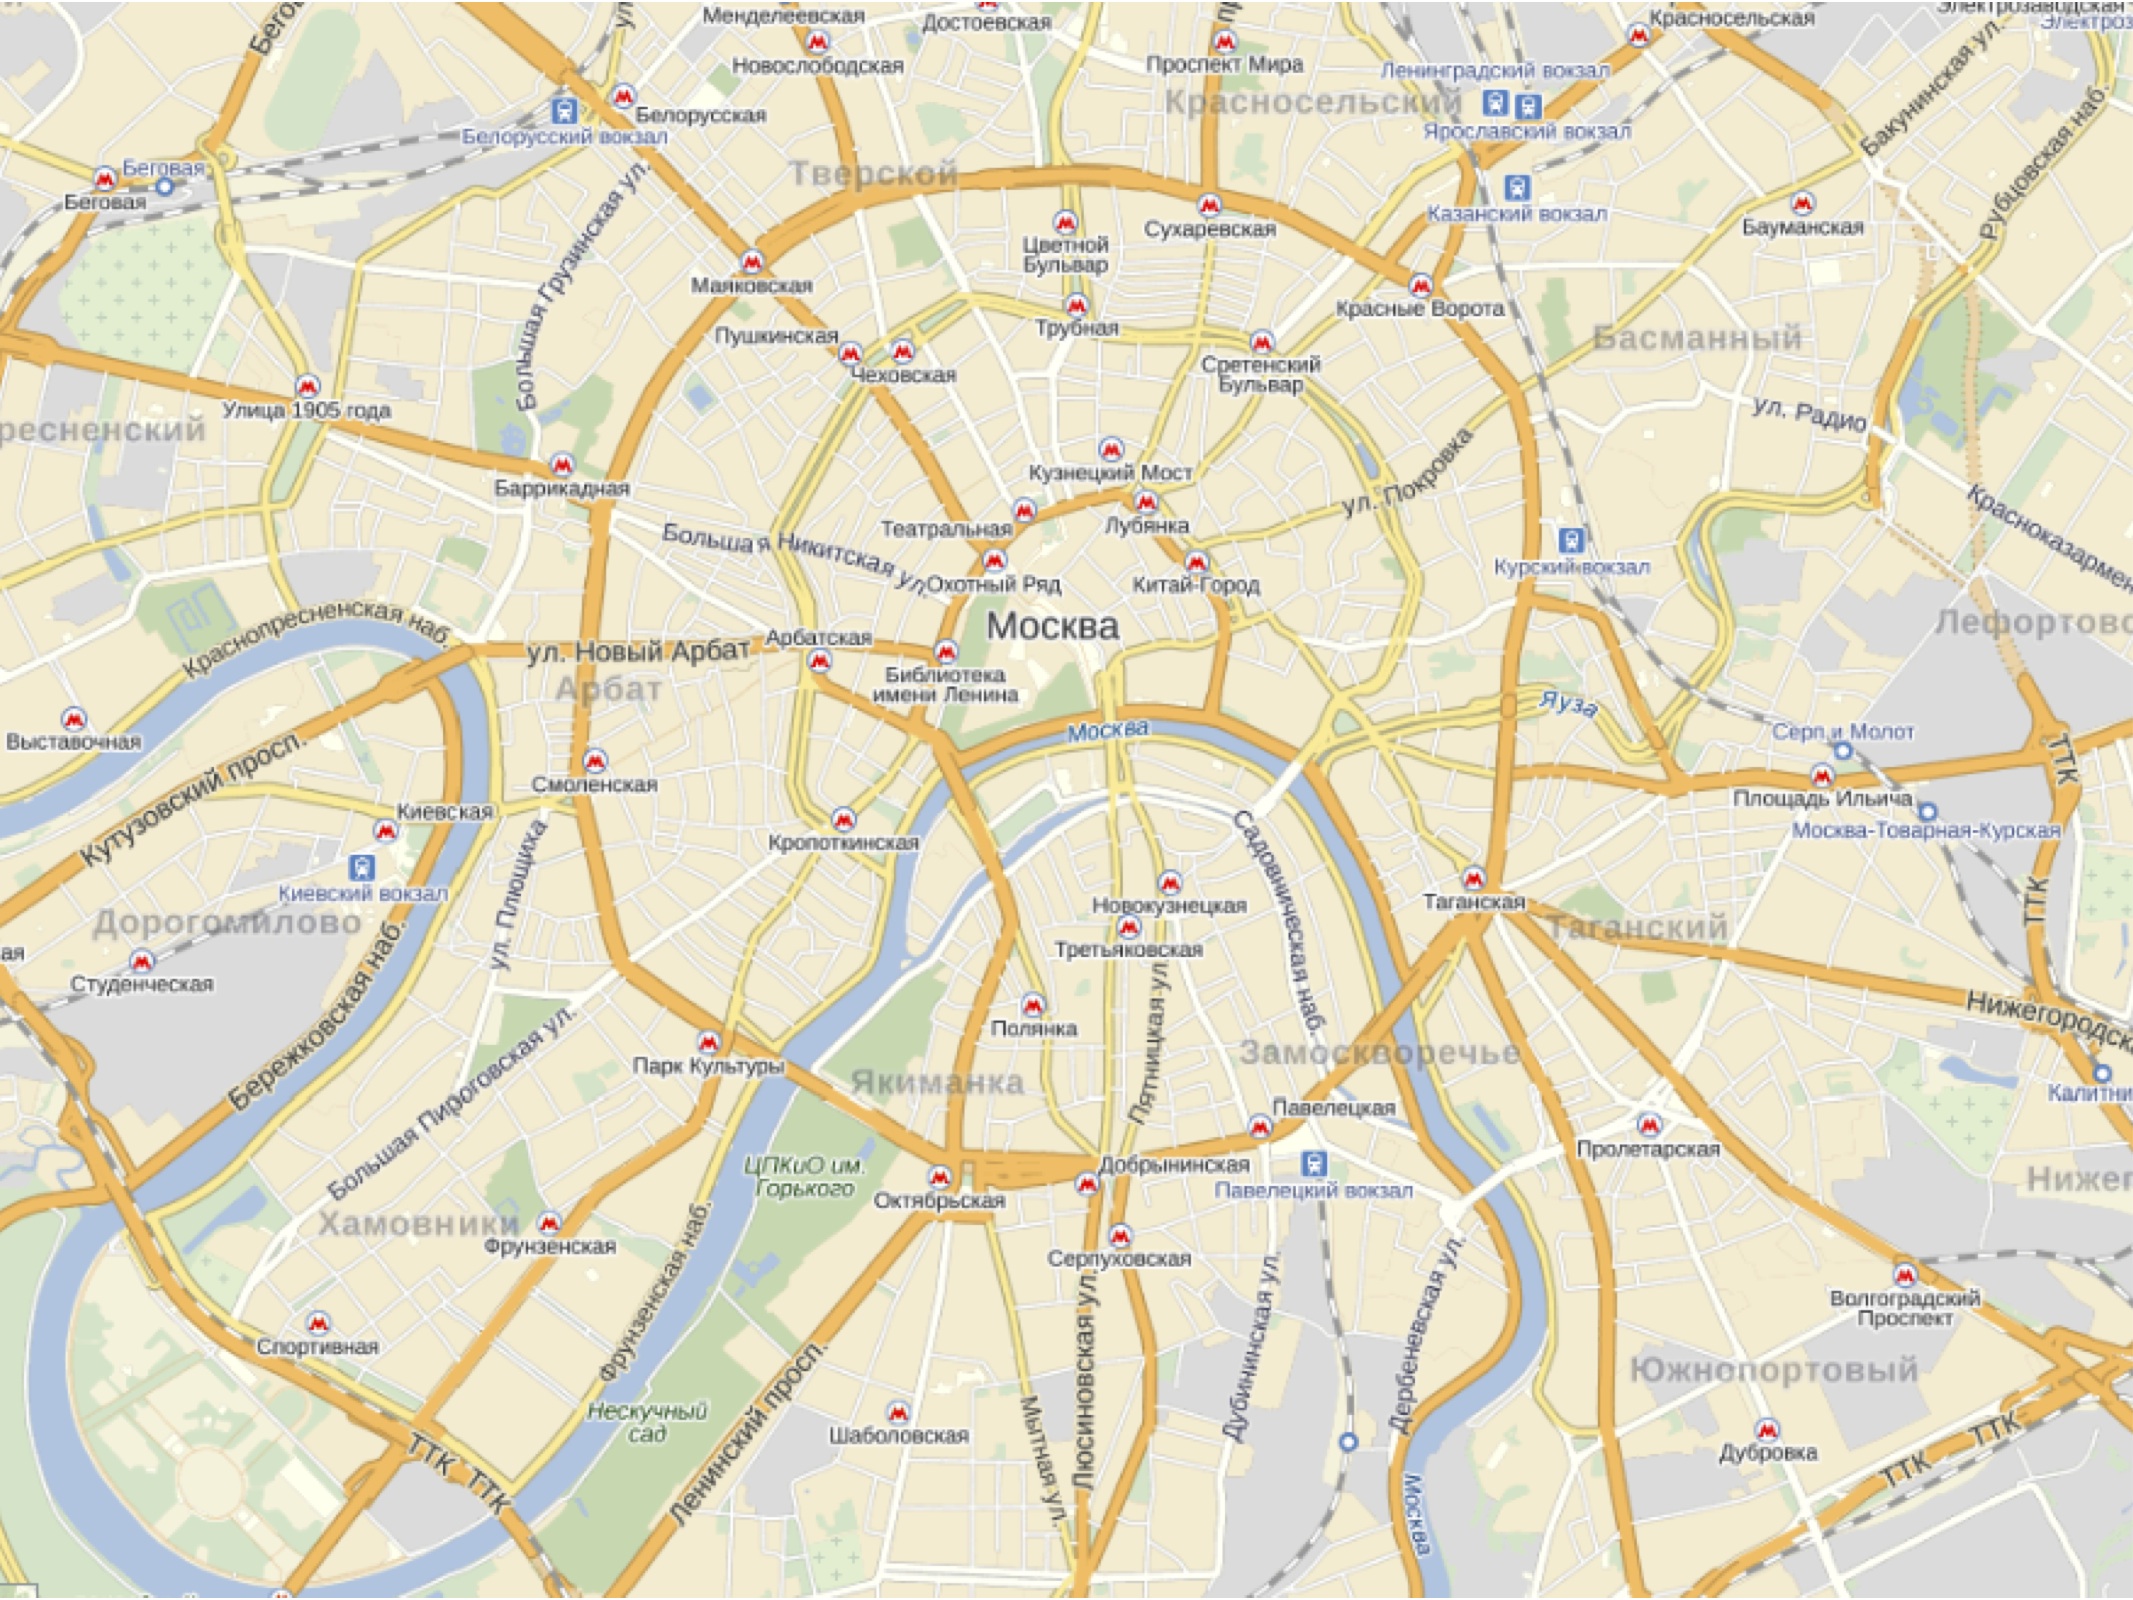
Not so bad, but we want to achieve a completely different result:
In fact, we face several tasks at once. First, select the most significant from the whole variety of objects, and add or remove less significant ones depending on the scale. In addition, there are many users with distorted visual perception: approximately ten percent of men suffer from such diseases. And this, too, must be taken into account. In the picture below you can see how people with color blindness see the map:

As you can see, the map remains quite readable, since the color palette is specially chosen so that the colors do not merge with the most common distortions of visual perception.
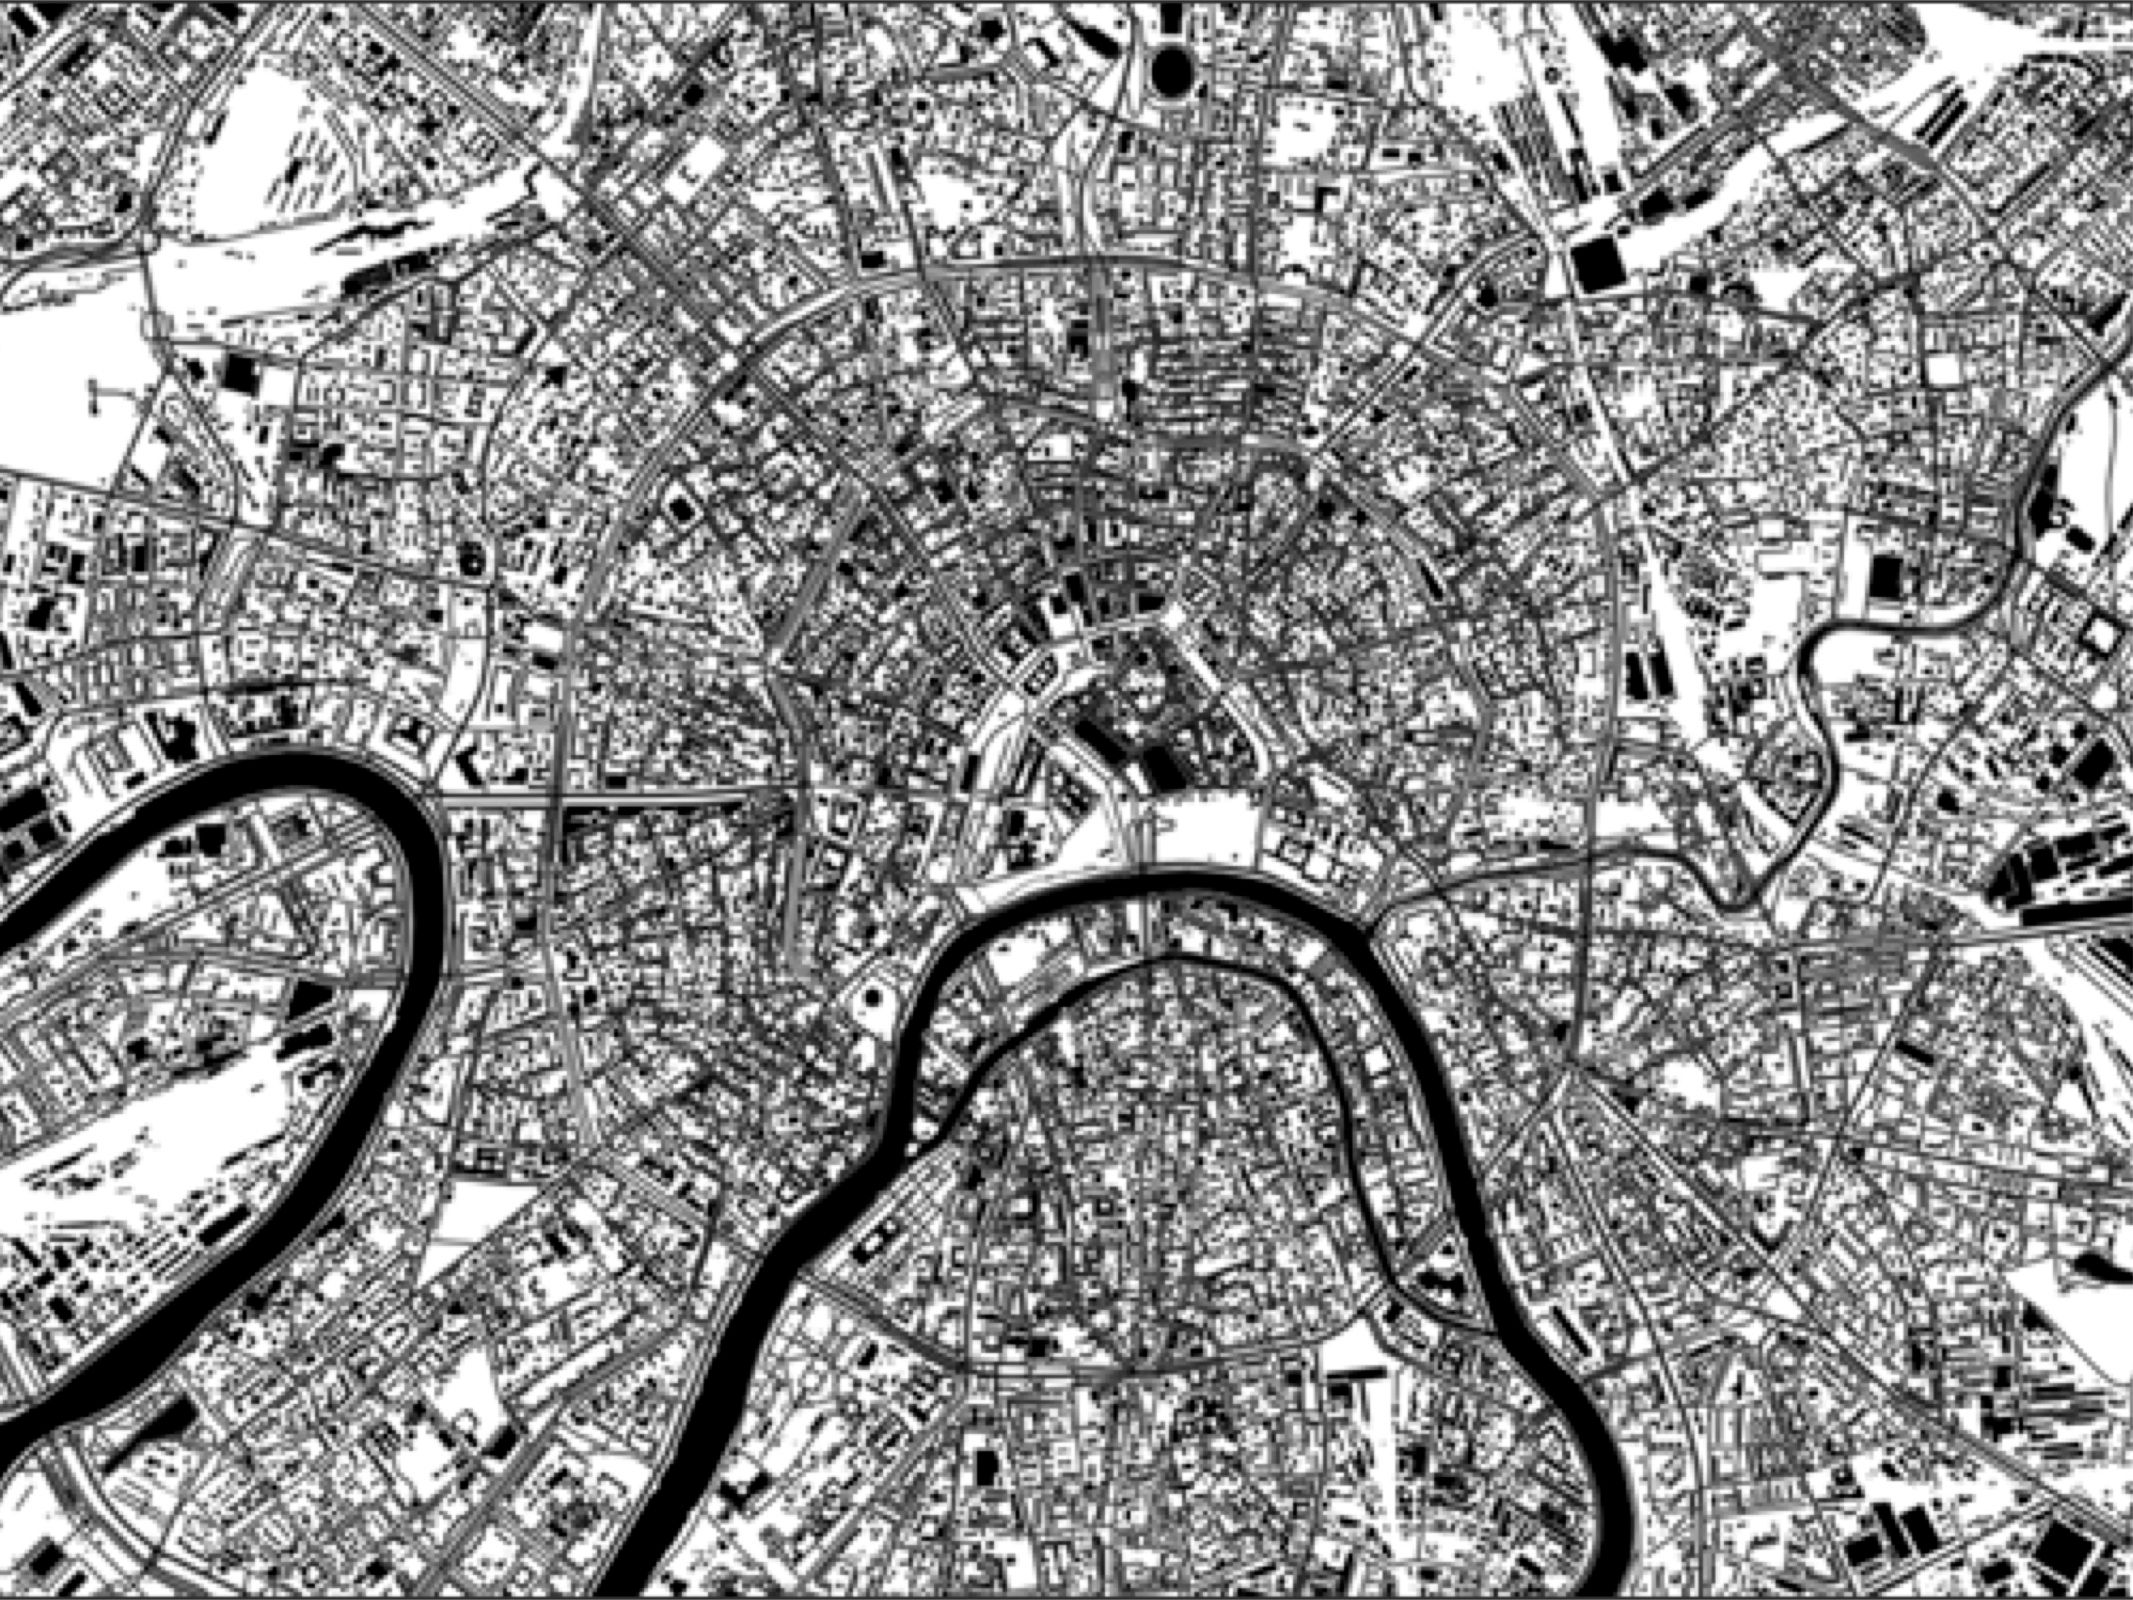
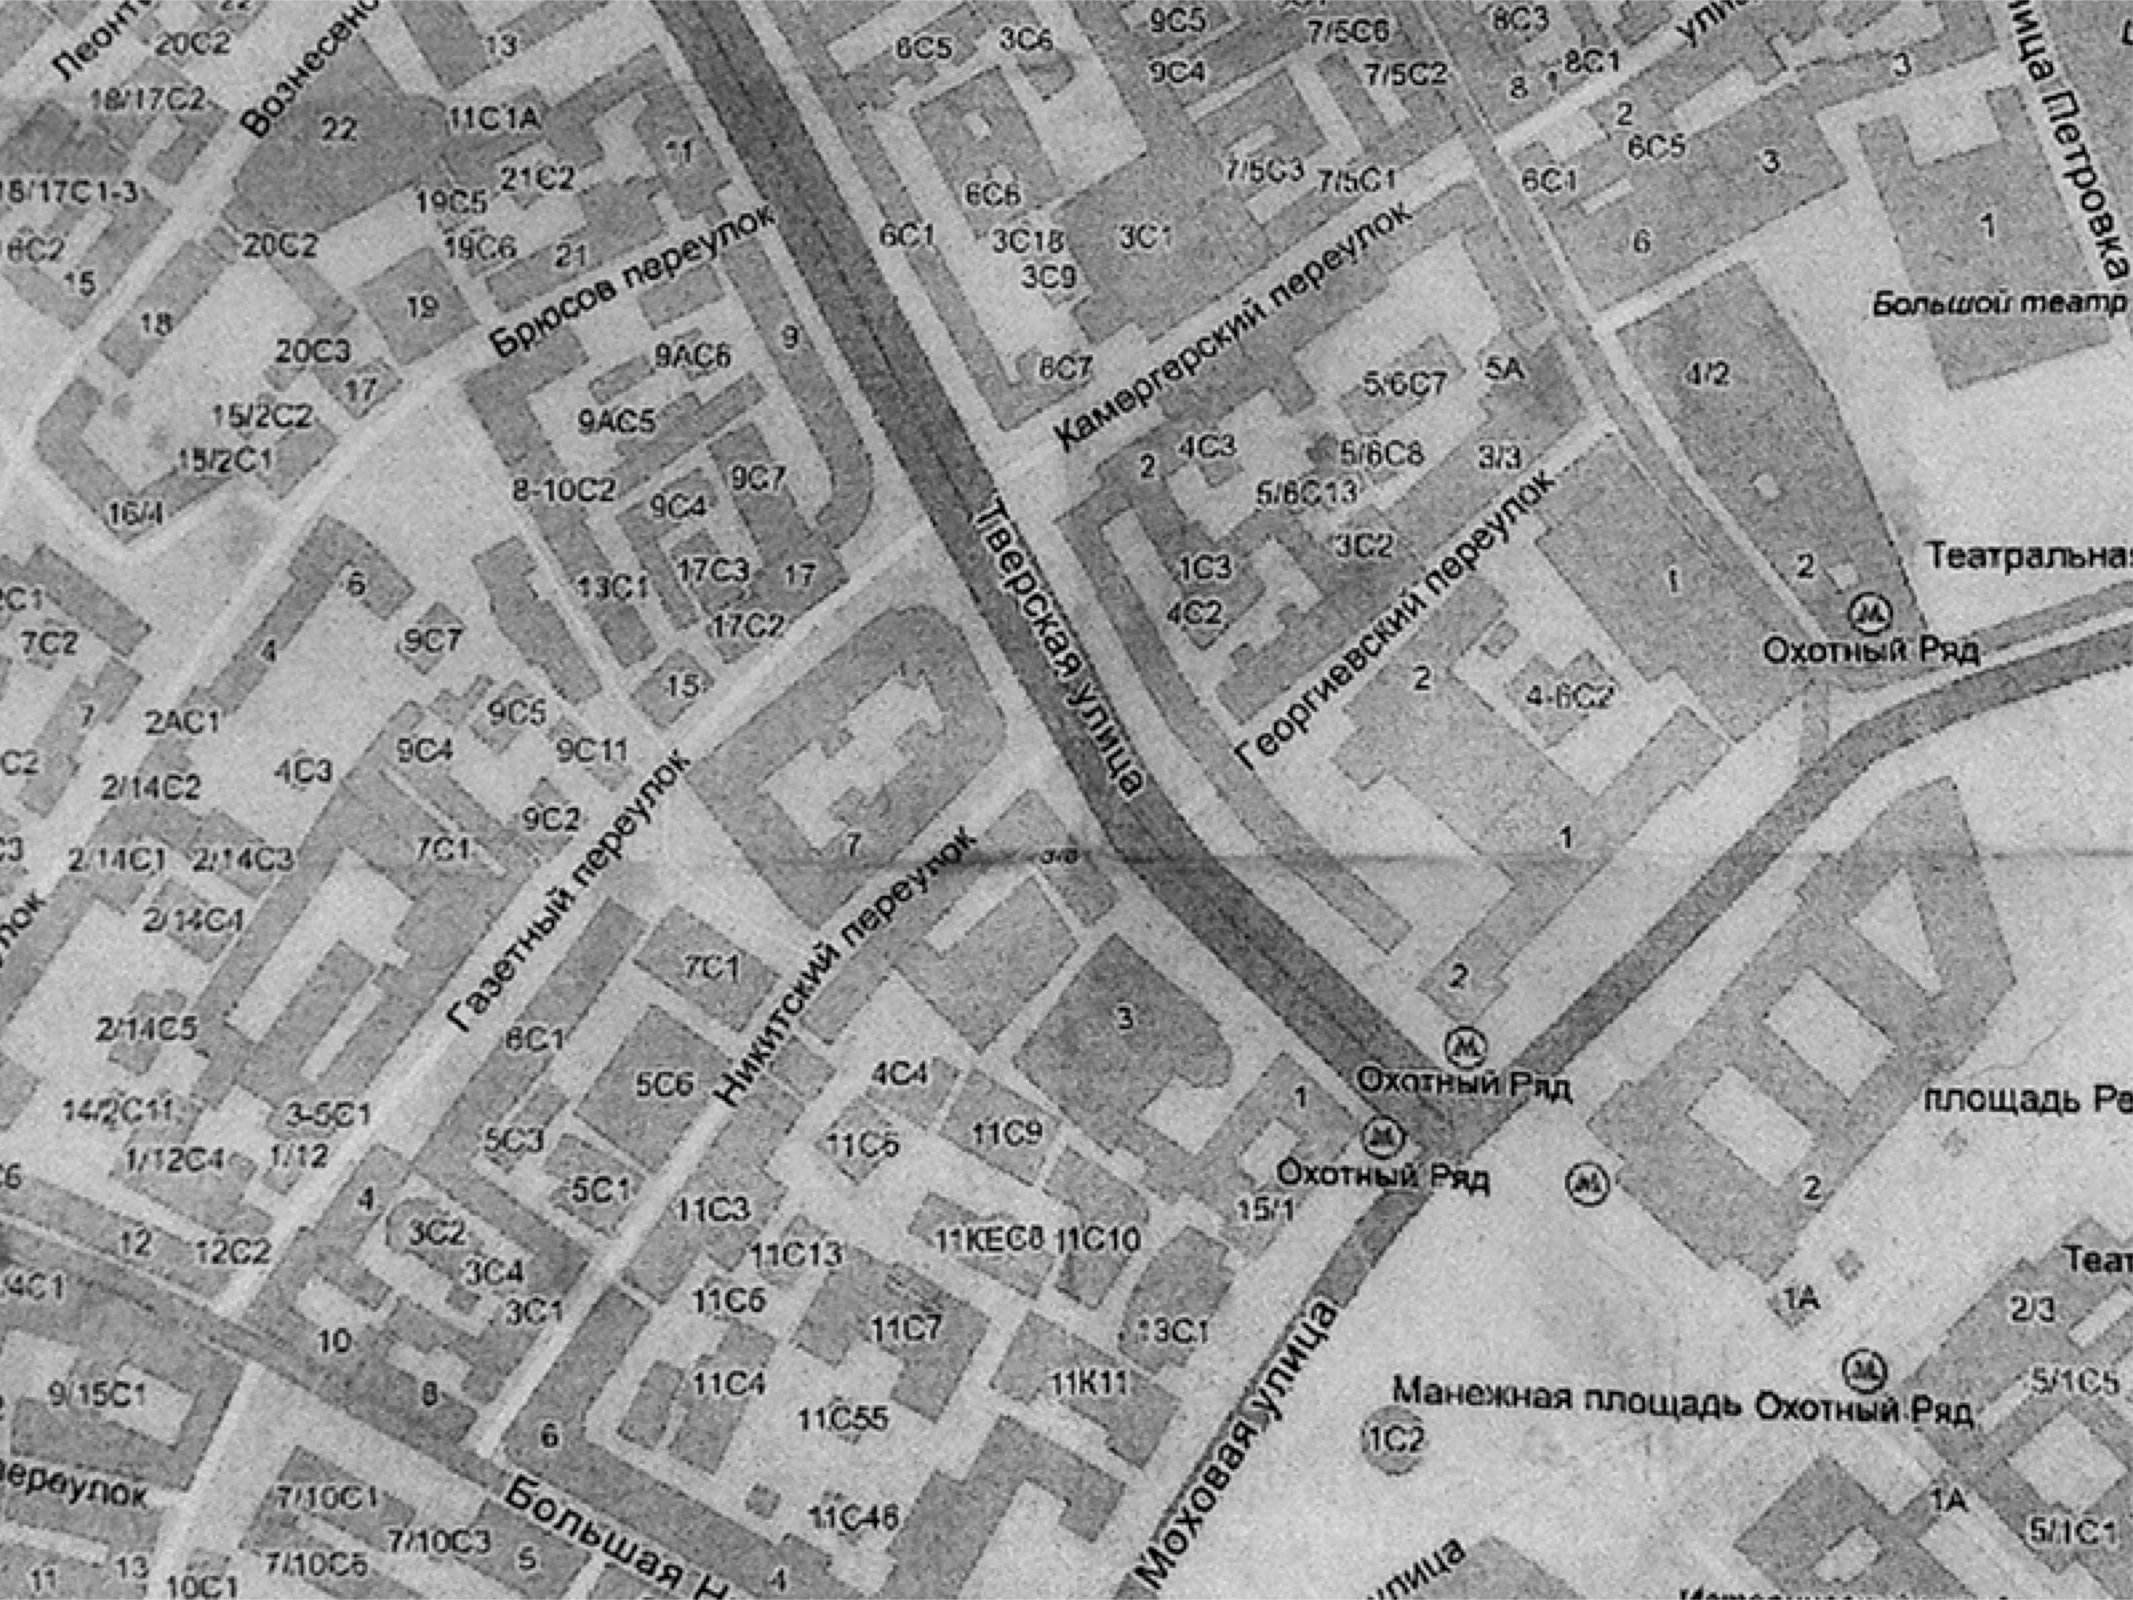
Another point to consider when choosing a color palette is that cards are often printed on black and white printers, and the monochrome card must also remain readable:
At that time, users already had access to satellite photos; all other necessary tools were also gradually created. And when the online rendering function was implemented, the idea of displaying information on the road condition on the map appeared.
After completing the lecture to the end, you will learn how at least the interesting components of Yandex.Maps are arranged: routing, Panoramas and API.
Let's try to figure out what Yandex.Maps is as if we didn't know anything about them, and hear about them for the first time. If you look at them in general, then this is a large site, on which several services are collected:
- Satellite images and map
- Folk card
- Search
- Traffic jams
- Router and Navigation
- Panoramas
- API
Satellite images and map
Of course, it all starts with a map. Imagine that we are telling your friend how to get to your house. Well, they drew a small map, on which he can pass from the train to your home. He went along with this dog and recorded a GPS track. If you then try to put this track on the map, nothing good will come of it, they simply will not be the same. How to make a map that would correspond to the real GPS-track? For example, we use a laser range finder from different points to measure distances to different points on the ground, and with the help of a compass we calculate the azimuths. With due accuracy of measurements, we already have some chance that after the overlay we will get a fairly accurate map that will coincide with the GPS track.')
But if you use this method to compile larger maps, the process will be too long and laborious. Therefore, today more technological solutions are used for these purposes. For example, satellite photography. Satellites fly above the Earth at an altitude of 200-500 kilometers and take photographs with the help of such lenses:
The satellite rotates around the Earth, and our planet rotates around its axis, so if we project the satellite's trajectory onto its surface, we get a sinusoid. In this case, the trajectory of the satellite at each revolution will slightly shift, so that after a certain number of overflights, it will be possible to photograph the entire surface of the Earth.
But there are two problems. First of all, the overflights of some territories will definitely come at night. And night satellite images are of purely aesthetic value, for cartography they are meaningless. This must be taken into account, and only light parts should be removed, which may require more spans. The second problem is cloudiness. If a part of the city closes the clouds when shooting, then we will need to shoot this part again the next time the satellite passes over it. But if the next time the satellite flies over this city at another time, the shadows will be directed in a completely different direction. And if we combine the two pictures, we will have a feeling of dissonance. Therefore, such satellites fly in a solar-synchronous orbit, calculated in such a way that each satellite’s span over a certain terrain falls on the same local time.
So, we took pictures, glued pictures, got one big canvas in high resolution. But the shooting was made from a single point, so that some angles will be distorted. To compensate for the distortion you need to re-project the whole picture. Make it as if each photo was taken just above this point.
There is another problem with satellite imagery. We want to get color photographs, but when passing through the atmosphere, the light rays of a different spectrum are refracted in different ways. Therefore, a high-resolution color image from space cannot be made. It takes two shots. One is black and white, high resolution, and the second is of lower resolution, but color. Then the color image is stretched and superimposed as a black and white texture. This becomes noticeable when fast-moving objects, such as airplanes, fall into the frame.
So, we made a survey, color correction and other necessary manipulations, put all these terabytes of data into storage, made maps based on them. But why not give the users the satellite images themselves. After all, looking at them is also useful and interesting. On Yandex.Maps, this feature appeared in 2004. The Internet was slower than it is now, and transferring big data was not so easy. Therefore, the big pictures were divided into tiles that fit exactly into one user screen.
But back to the cards themselves. Suppose we were able to mark on the road, at home, sign addresses. As a result, we get this picture:
Now we need to paint this map. If we paint the neighborhoods, houses, roads and ponds in different colors, we get this:
Not so bad, but we want to achieve a completely different result:
In fact, we face several tasks at once. First, select the most significant from the whole variety of objects, and add or remove less significant ones depending on the scale. In addition, there are many users with distorted visual perception: approximately ten percent of men suffer from such diseases. And this, too, must be taken into account. In the picture below you can see how people with color blindness see the map:
As you can see, the map remains quite readable, since the color palette is specially chosen so that the colors do not merge with the most common distortions of visual perception.
Another point to consider when choosing a color palette is that cards are often printed on black and white printers, and the monochrome card must also remain readable:
Folk card
Russia is a huge country. Compiling a detailed map of its entire territory requires enormous resources. Therefore, it was decided to provide users with the opportunity to independently mark out the territories where the detailed maps are insufficient. To do this, it was necessary to implement the following functions:- access to satellite images;
- tool for drawing and captions;
- simultaneous editing;
- instant display;
- storage reliability.
At that time, users already had access to satellite photos; all other necessary tools were also gradually created. And when the online rendering function was implemented, the idea of displaying information on the road condition on the map appeared.
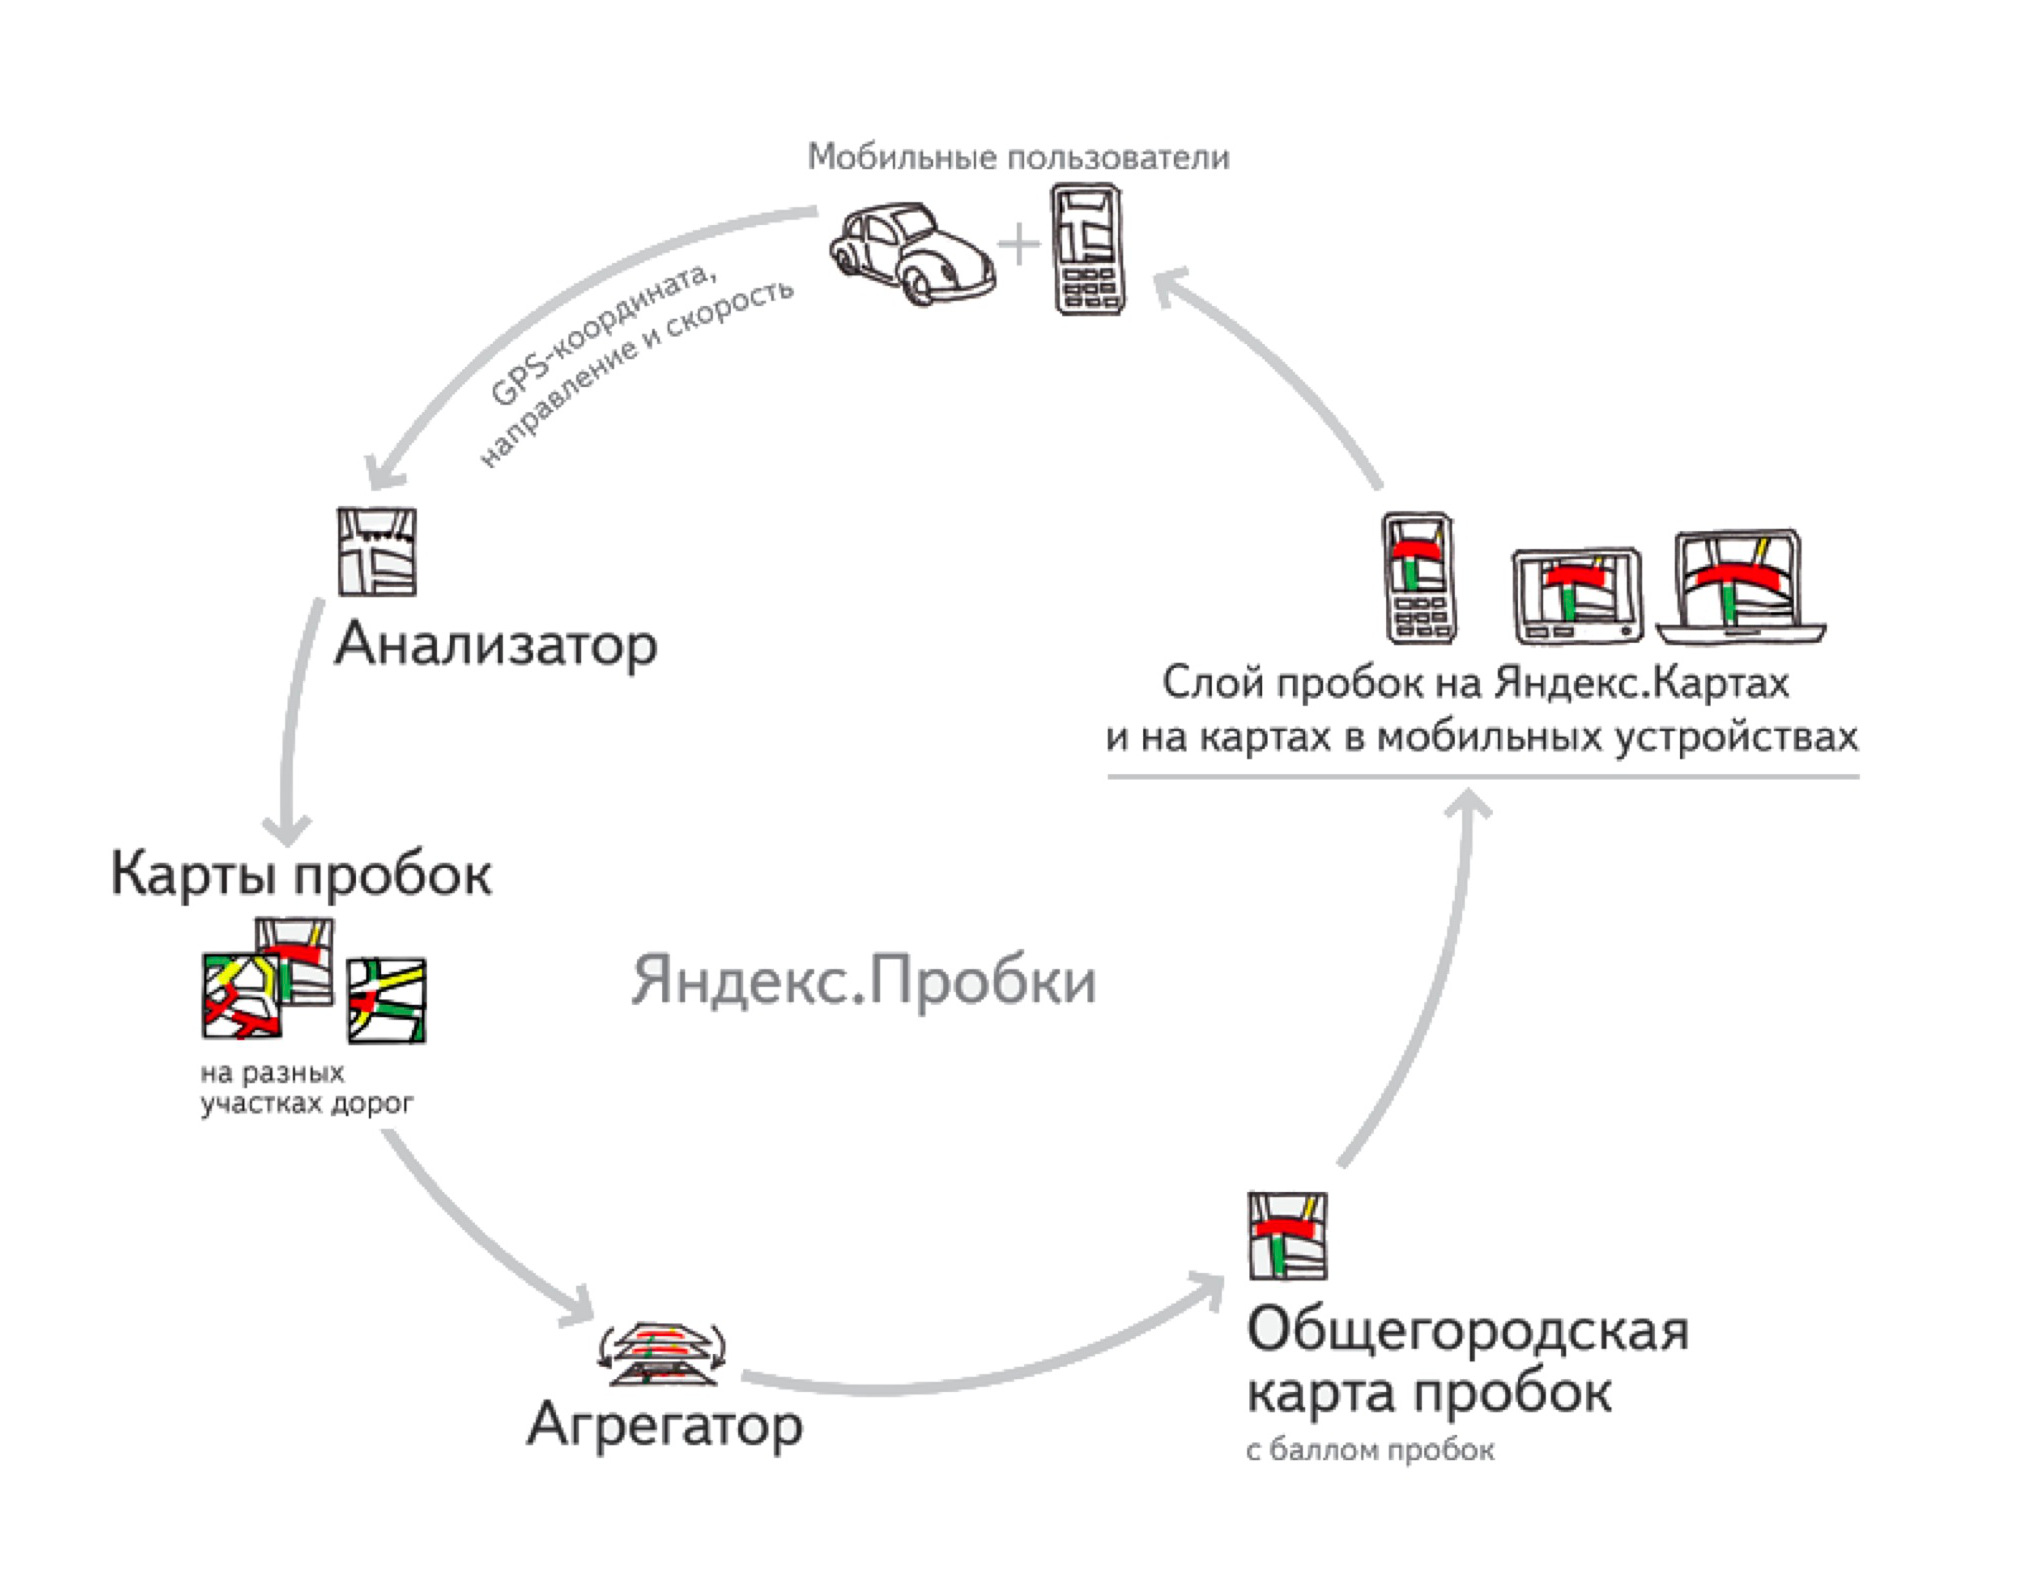
Traffic jams
In detail about how Yandex.Probki work has already been told in his lecture Leonid Mednikov, well, you can make a general idea from this picture:After completing the lecture to the end, you will learn how at least the interesting components of Yandex.Maps are arranged: routing, Panoramas and API.
Source: https://habr.com/ru/post/219951/
All Articles