Part one, and the second part still nobody reads
What is it actually about
Once on one late December evening the collection of material for the habr-article about the SAT was completed. The material turned out to be too much and I had a choice: to divide the article into two parts or to gather all the material together in one article. The choice was made in favor of division into parts ( first and second ). To my surprise, the second part received much less attention than the first - in fact, it was read by half as many people.
Time passed, and I began to notice that this was happening not only with my articles, but also with many other articles in several parts. Then I had a question, is it true in general that the second part receives less attention (views, pluses, and favorites entries)?

(made on the basis of the habr article How to lie with the help of statistics )
Article structure
')
As a result, I got the following idea: to collect a couple of articles - the first and second parts and see if there is a significant difference in the basic parameters between the articles. And also evaluate how these parameters change for articles in several (more than two) parts.
Data
As in the previous article, all data, code and scripts for visualization are available for download in github . You can repeat all the experiments, as well as collect and verify all the original data - using the code and examples from the previous article . First of all, it is necessary to ensure the transparency and repeatability of experiments, as well as to give some starting point for those who want to conduct their own research of the habr-data.
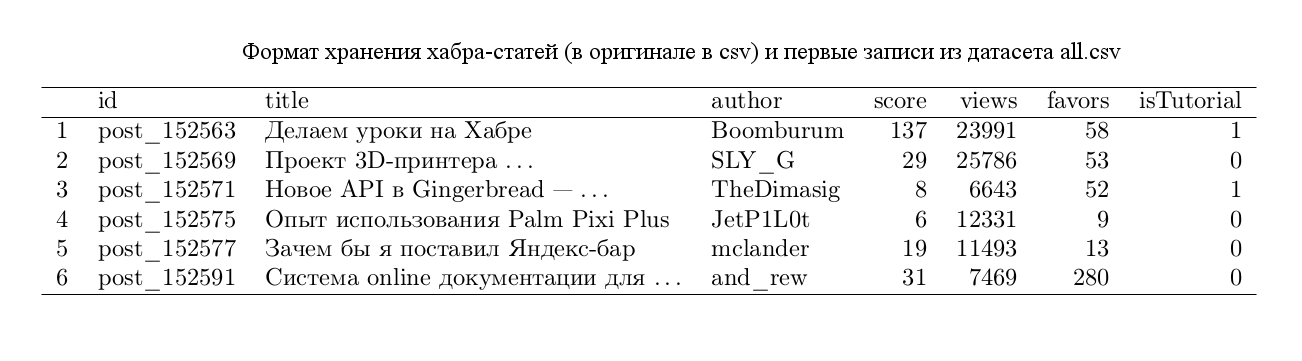
Collecting data about articles in several parts is not the easiest task, but we can collect a sufficient number of articles using a couple of simple ideas. Let's consider dataset all.csv with habr-articles from last article
A great experience of reading Habr told me that information that has several parts should be looked for in the title (title in the table). If we go through all the headers for the presence of a keyword part , then we can put together a good set of candidates. A simple filter.py script for pre-filtering articles produced an impressive but not huge list of articles of candidates grouped by authors. After analyzing the candidates, two datasets, series1.csv and series2.csv , were formed, containing the first and second parts, respectively:
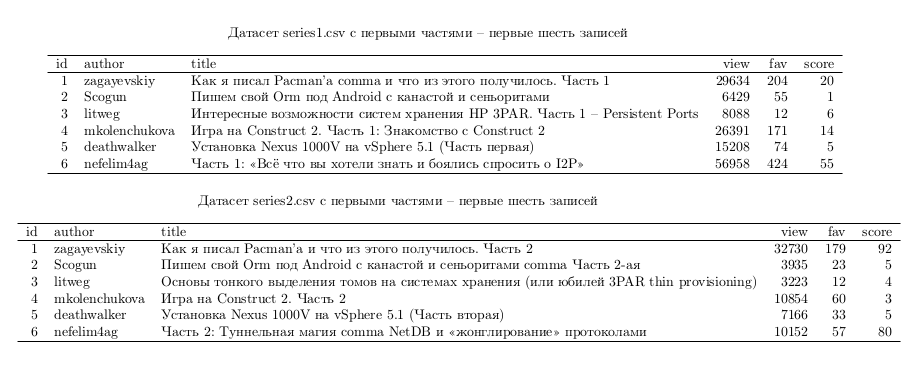
Each dataset contains 180 entries.
Compare parts
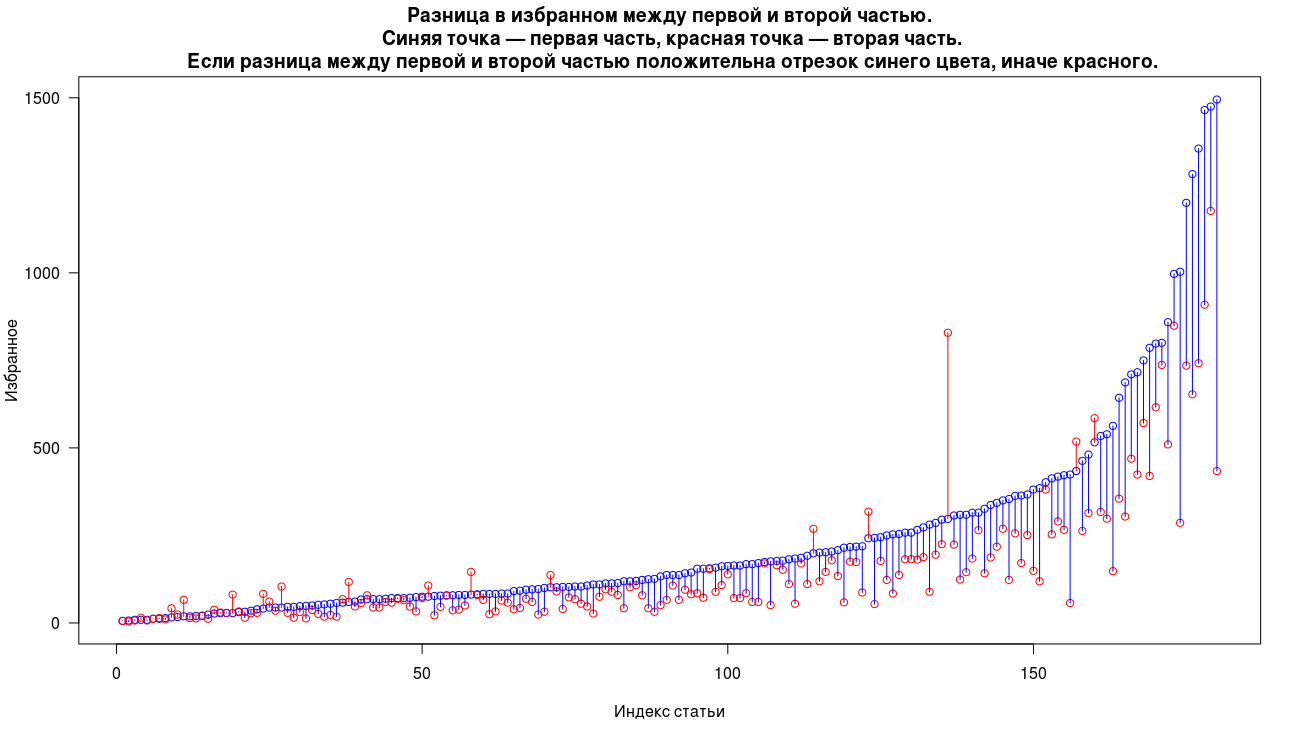
Consider the difference between the first and second parts of the following indicators: views, rating and entries in your favorites. On each of the graphs below, a blue dot means the first part of the article, and a red dot means the second part. Two parts of the same article are displayed on the same x-coordinate. If the difference in the measurement of views, rating or favorites is positive between the first and second parts is positive, then the segment between them is blue, and if negative, then red. Visually, the more blue lines we see, the more often the first part is better, according to the measured parameters. Articles on the graphs are sorted by increasing the parameter of the first article.
In the first graph, we see a clear predominance of the first parts over the second in views, only in 10% of cases the second part is better than the first. But the majority of these cases show an insignificant difference in the views, among all the records only in two cases we see a significant predominance of the second part over the first. The median of the number of views is about 20k for the first parts and 10k for the second.

In general, we see a similar picture from the entries in the favorites, only in 14% of cases the second part is gaining more entries in the favorites, there is only one significant case of dominance. Median entries in the favorites 137 for the first parts and 82 for the second.
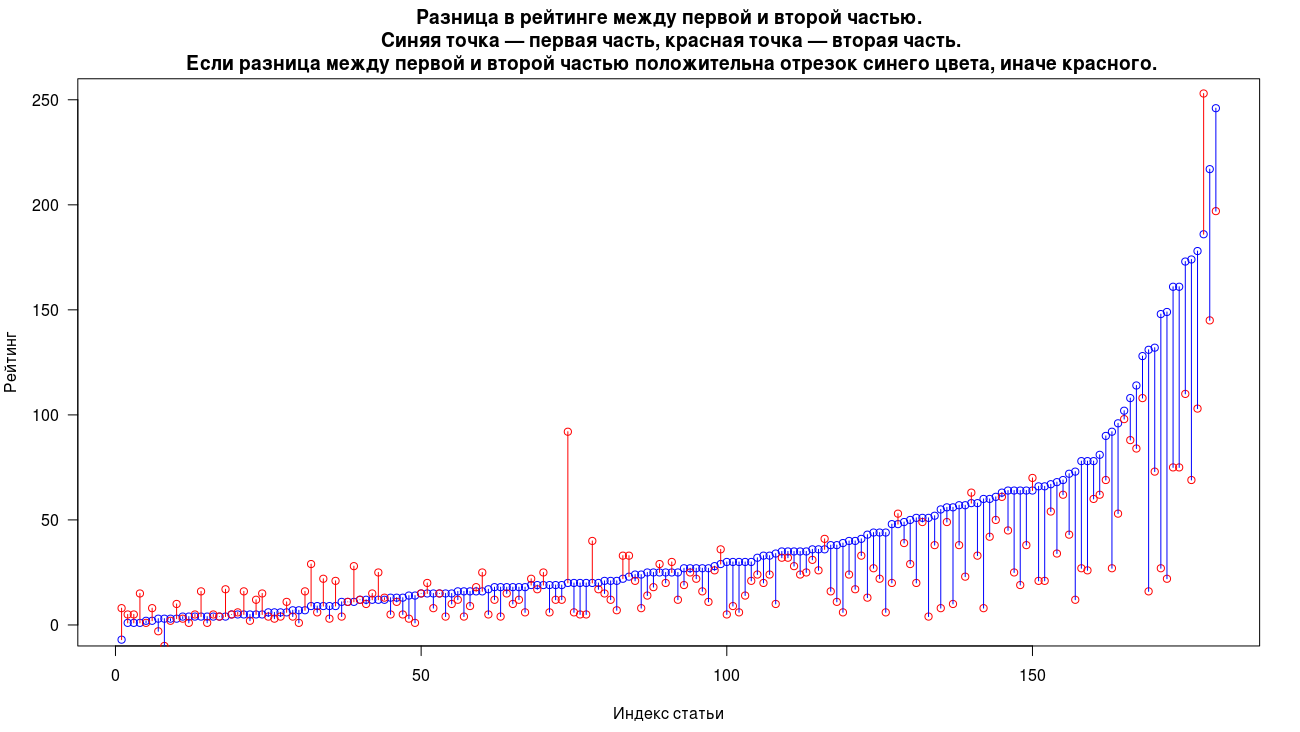
In the case of a rating, the second parts dominate the first ones more often in 22% of the cases. Essential prevalence, as in the case with views, occurs only in two cases. Median rating for the first parts 25 and 17 for the second.
(graphs obtained using the difference.R script)
If anyone is interested, then a substantial predominance of the second part over the first occurs in these articles:
As I wrote Pacman'a, and what came of it. Part 1
As I wrote Pacman'a, and what came of it. Part 2
and the biggest difference in performance in the article:
Part 1. Unboxing VisuMax - femto laser for vision correction
Part 2. How many megabits / s can be passed through the optic nerve and what is the resolution of the retina? Some theory
Series of articles
It is even more interesting to consider long chains of articles. From the total number of candidates, a series of articles were selected from 5 or more parts - they can be found in the series_long.csv dataset .
The data has the following format:
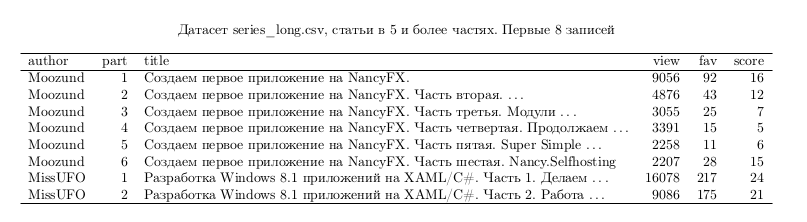
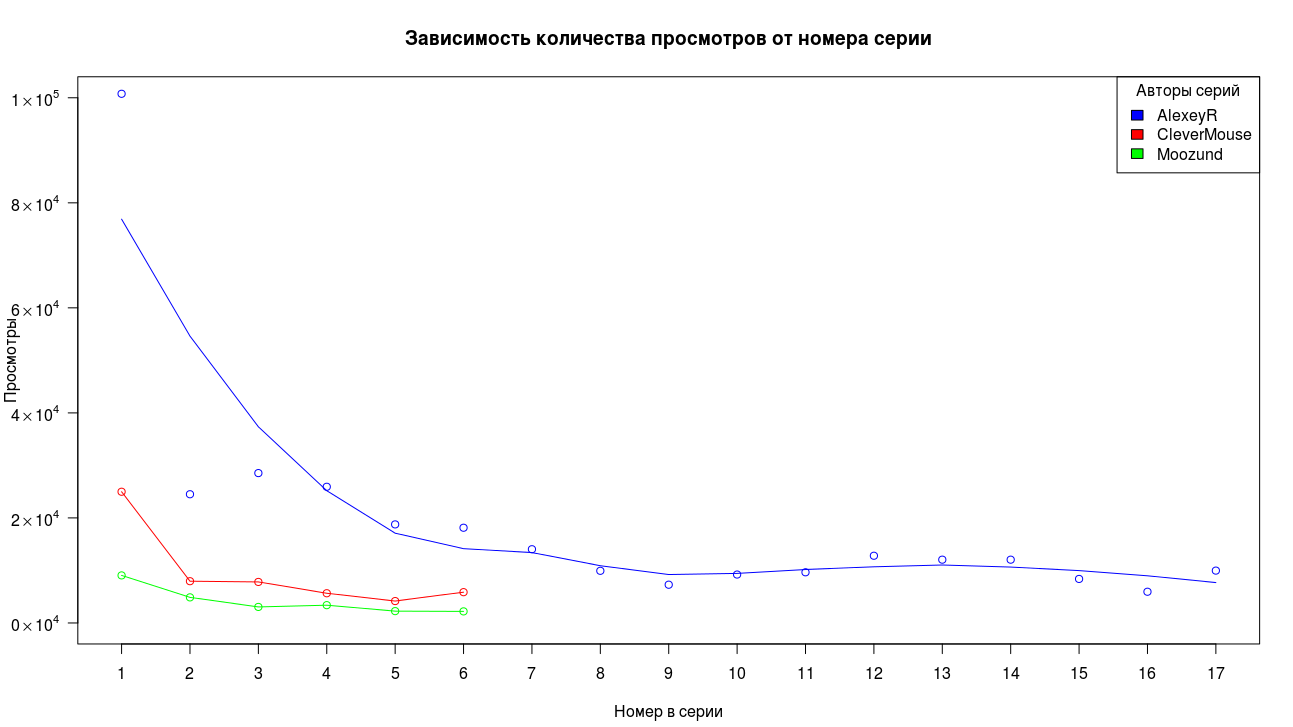
The data collected represent a very limited sample, so it is difficult to draw unambiguous conclusions, but we can at least appreciate the general nature of the changes. Let us cite as an example and motivation the three longest chains of articles for the collected period.
First of all, we see that the first part scored significantly more views than the other parts. For the second and third parts, the fall has a factor of the order of two, then the fall slows down and the scans stabilize.
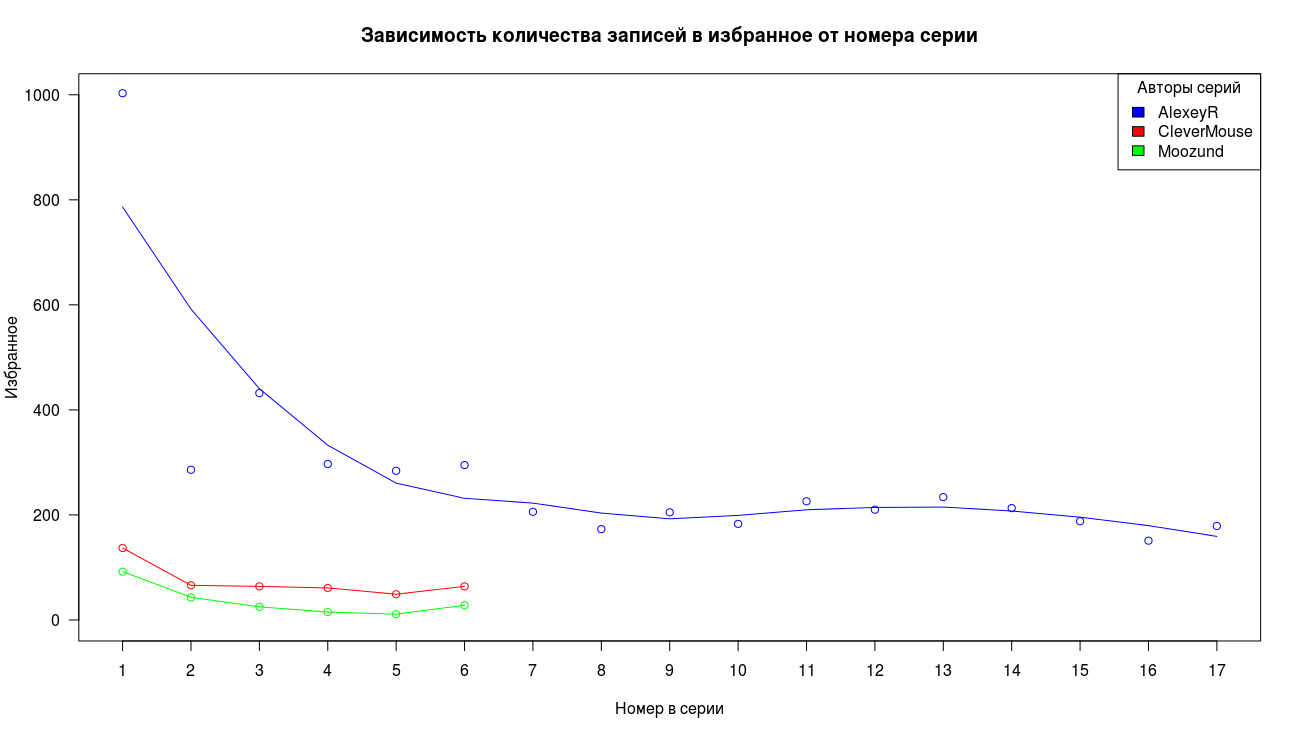
We see a generally similar picture from the entries in the favorites, the high value of the first point, a sharp drop and stabilization of the tail.
The situation with the rating differs from the two graphs discussed above, but in general, the overall look of the picture remains, except for the low initial result of the blue series.
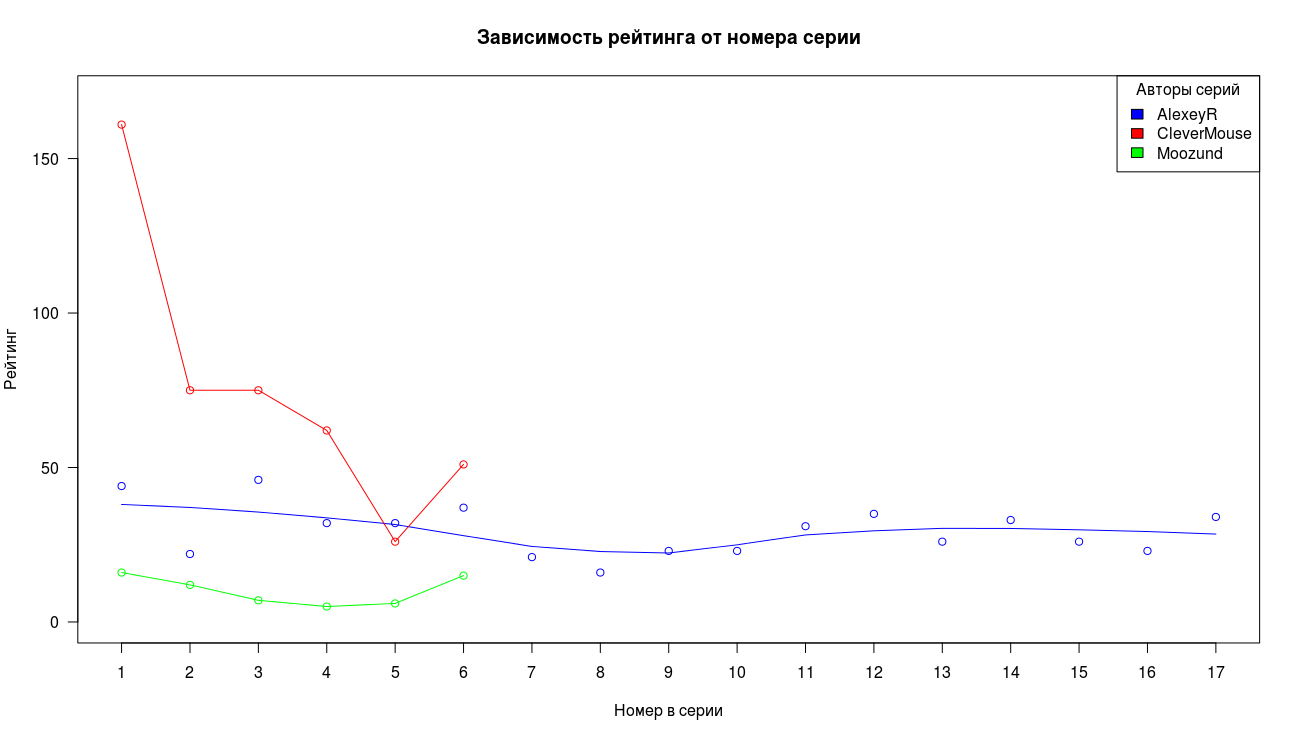
(obtained using the long_plot.R script)
Is the result so unexpected? Not really. This is roughly what was expected at the very beginning - as was written in the previous article, this is the classical Zipf distribution (it is written here in an interesting and less dry language). It occurs quite often and it is not surprising to see it when counting the number of views of various series, for example, notes of lectures:

(data taken from the youtube-channel of the Stanford Programming Methodology course)
We see a similar picture, when at a high value of the parameter at the first point, there is a sharp drop and tail “stabilization”. It should be noted the similarity of dependencies of views between articles on Habré and views of materials on other resources in several parts.
Conclusion
This empirical observation leads us to a number of interesting questions: is it possible that the fall of “interest” in the following parts lies in the very structure of the division into parts? For example, viewing an article n requires viewing the n-1 article, which significantly increases the reading time and reduces the audience. Does any specificity of articles on Habré play a role or does this happen with all similar articles on other resources?
Certainly, one should not follow exclusively similar empirical observations to decide whether an article should be divided into several parts or not, but this observation allows setting some standard of expectation (in basic parameters) for the following parts, based on current indicators.
Further reading
If the topic of data analysis seemed interesting, then useful material for studying
- Udacity
- Caltech - Learning from Data
- Coursera - Data Science Track
- If you live in St. Petersburg, you can take courses at DMLabs
- If you live in Moscow, then you probably already heard about the SHAD
Source: https://habr.com/ru/post/219679/
All Articles