Debugging a Java application when it doesn't wait at all - welcome to the InTrace approach
Have you ever had to explore step by step the execution of some Java code that you did not bother to provide with logging tools or other monitoring mechanisms?
Let us complicate the task by not recompiling the code under study, and generally restarting the existing process (the case when the incomprehensible behavior was and even during the restart floated). The Java machine, of course, is running with the most common options (without parameters for the debug attachment or any other frills).
And so I want to understand what is happening.
This is what we are going to do.
For illustrative example, let's take a simple code, some semblance of the implementation of the good old well-known fairy tale "Turnip". The purpose of the demonstration below the above code does not show the beauty of the organization of classes or methods, and especially naming (here, rather, disgrace), but simply make a series of calls for the call.
')
Compile
And run
Now you need to somehow "wedge" into an already running process and adapt the code to your needs. The Java agent created by Martin Robertson (for which he has many, many sincere thanks), called InTrace mchr3k.imtqy.com/org.intrace , is perfectly suited for this , allowing it to be injected into the executable code on the fly, providing it with elements of tracing.
The InTrace agent is placed in an already running Java process in a couple of simple ways (optional):
1) software method
Slipping the process with a java agent intrace-agent.jar from github.com/mchr3k/org.intrace/tree/master/binaries/jars/latest_development
2) taking VisualVM (by downloading, if there is no visualvm.java.net from here) and patching it (Tools-> Plugins) InTrace with the plugin org-intrace-visualvm.nbm taken from
github.com/mchr3k/org.intrace/tree/master/binaries/jars/latest_development
The trouble is that in org-intrace-visualvm.nbm are not the latest files, so find out where VisualVM stores the plugins and replace the corresponding jars with the most recent ones from github.com/mchr3k/org.intrace/tree/master/binaries/jars/ latest_development
In my case (Linux OS), it was necessary to replace
intrace-agent.jar on intrace-agent.jar and intrace-client-gui-linux.jar on intrace-ui.jar (see the screenshot below, the plugin suggests ways)
Now it remains to run VisualVM, call the context menu for skazka.Repka and select “InTrace Application ...”, after which we will see
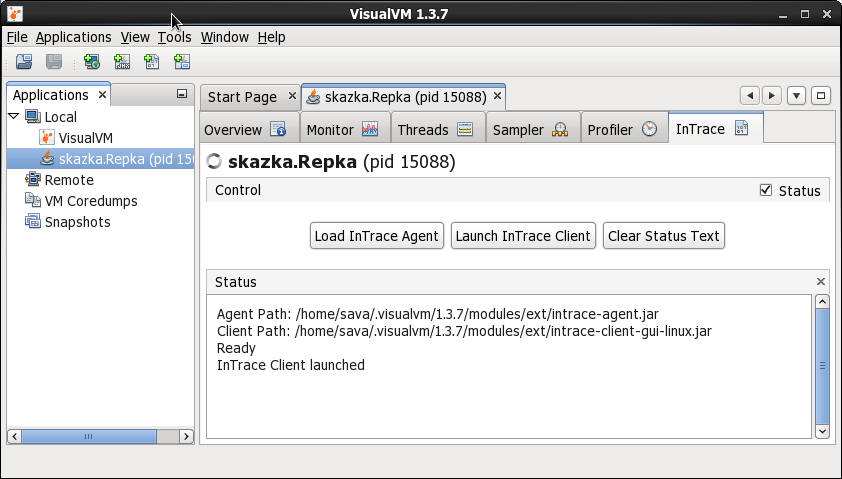
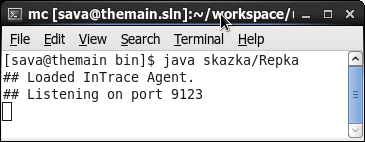
press the “Load InTrace Agent” button and the console will report on the implementation of InTrace with a text like
The implementation stage is successfully completed: the InTrace agent has successfully settled in the Java machine, ready to transform the byte code, supplying it with trace commands, and report the results.
We proceed to the stage of observing the result, for which we launch the agent management tool and analysis of the results (separate application).
Again there are two simple options.
1) we implemented the agent in the first "program way" then we start
taken here
github.com/mchr3k/org.intrace/tree/master/binaries/jars/latest_development
2) in the case of using VisualVM, click on the “Launch InTrace Client” button, and, in principle, absolutely the same file will start as in the first example (since we patched a new intrace-ui.jar)
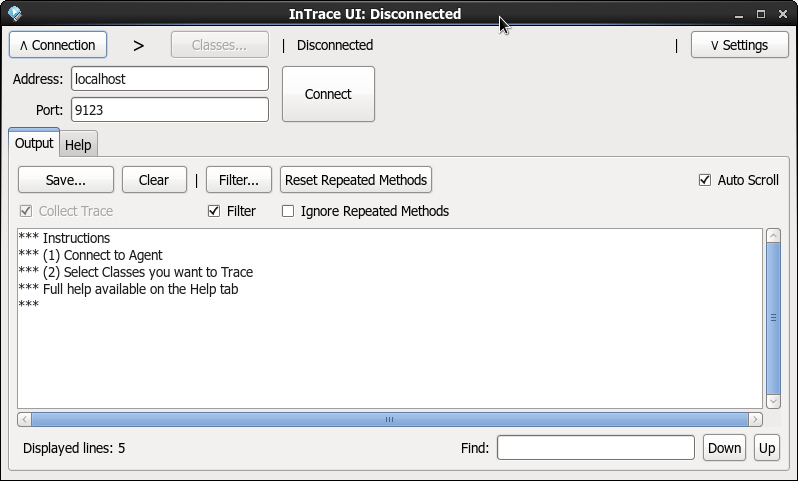
We drive in the address, set up the parameters of the trace (I turned on the Entry / Exit + Branch + Args), click the “Classes ...” button and specify there skazka (this will add tracing to the classes from the skazka package).
Press "Enter" in the console with the launched "Turnip" (do not forget that this is exactly what she is waiting for to continue) and in the end we will get on the client a chain of program execution in the form of output:
Each line of output is described in the following format.
Where:
current time - speaks for itself
thread identifier - unique identifier of the stream, different streams - different numbers (1, 2, 3, 4, ...)
package - namespace
method - the name of the method in which the execution takes place
additional information - depends on the situation
Supported Trace Types:
- input / output method
or
- branching
- arguments (display of objects goes through toString ())
-return values
- exceptions
In general - everything you need to successfully understand the progress of the program.
Practice analyzing the output in the above example (something may be intuitively not at all clear, but you quickly get used to it).
An illustrative example of what the code turns into (how traces are arranged) can be found on the author’s page mchr3k.imtqy.com/org.intrace/howintraceworks.html
I also advise you to immediately pay attention to the very useful button "Filter ...", which helps to get rid of unnecessary garbage.
The existing integration with Eclipse allows you to run a Java application with an agent already deployed in InTrace, configure tracing parameters and analyze the result of the work. For more details see here mchr3k.imtqy.com/org.intrace/eclipse.html
TOTAL
Benefits:
1) Monitoring the progress of the program on the fly:
- method calls, passed arguments, branches, generated exceptions, ...
- without recompilation and even without restarting a running program
2) Available code (OpenSource)
3) Easy to set up and use.
4) Cross-platform solution (Windows, Linux)
5) Integration with popular development tools is possible (Eclipse, VisualVM)
Disadvantages:
1) Change byte code on the fly:
- performance speed suffers (performance)
- introduction of the agent “mutates” the existing process and it will never be the same as before (you will not enter the river twice)
- Modifications of the code bytes are “as is” and, naturally, “at your own peril and risk”
2) There is no mass support - only one developer, but is compensated by the small size of the project and the availability of source codes. I am glad that the last update in the repository was a couple of weeks from the publication of this post.
3) The product is well tested on Java 1.6, but not tested on Java 1.7 (and there are problems with it, see the bug github.com/mchr3k/org.intrace/issues/28 ). As far as I understand, the author uses only 1.6, wrote “for himself” and not at all for commerce, so who needs a newer one, do not be lazy to take it and screw it up
In conclusion: InTrace is an agent that definitely deserves to be met at a minimum, and perhaps it will become an indispensable tool for you, revealing the debugging of Java applications from a different angle, and, undoubtedly, will help someone more than once.
Taking into account the comments and additions, I strive to unleash the power of InTrace (as well as a number of other interesting agents) in the JAVA hub and will be very grateful for the help.
Thank you for your attention and be sure to share with those who may be interested!
Let us complicate the task by not recompiling the code under study, and generally restarting the existing process (the case when the incomprehensible behavior was and even during the restart floated). The Java machine, of course, is running with the most common options (without parameters for the debug attachment or any other frills).
And so I want to understand what is happening.
This is what we are going to do.
For illustrative example, let's take a simple code, some semblance of the implementation of the good old well-known fairy tale "Turnip". The purpose of the demonstration below the above code does not show the beauty of the organization of classes or methods, and especially naming (here, rather, disgrace), but simply make a series of calls for the call.
1: package skazka; 2: 3: import java.io.BufferedReader; 4: import java.io.InputStreamReader; 5: 6: public class Repka { 7: public static void main(String[] args) throws Exception { 8: new BufferedReader(new InputStreamReader(System.in)).readLine(); 9: 10: try { 11: new Dedka().tyanem("", 200); 12: } catch (Exception ex) { 13: processError(ex); 14: } 15: 16: } 17: 18: public static boolean processError(Exception ex) { 19: // ... 20: return true; 21: } 22: } 23: 24: class Dedka { 25: void tyanem(String target, int weight) { 26: new Babka().tyanem(target, weight - 15); 27: } 28: } 29: 30: class Babka { 31: void tyanem(String target, int weight) { 32: new Vorona().tyanem(target, weight - 10); 33: } 34: } 35: 36: class Vorona { 37: void tyanem(String target, int weight) { 38: if (!target.equals("")) { 39: throw new RuntimeException(" "); 40: } 41: 42: // ... 43: } 44: } ')
Compile
javac skazka/Repka.java And run
java skazka.Repka Now you need to somehow "wedge" into an already running process and adapt the code to your needs. The Java agent created by Martin Robertson (for which he has many, many sincere thanks), called InTrace mchr3k.imtqy.com/org.intrace , is perfectly suited for this , allowing it to be injected into the executable code on the fly, providing it with elements of tracing.
The InTrace agent is placed in an already running Java process in a couple of simple ways (optional):
1) software method
public static void loadAgent(String pid, String agentFilePath) throws Exception { VirtualMachine vm = VirtualMachine.attach(pid); vm.loadAgent(agentFilePath, ""); vm.detach(); } Slipping the process with a java agent intrace-agent.jar from github.com/mchr3k/org.intrace/tree/master/binaries/jars/latest_development
2) taking VisualVM (by downloading, if there is no visualvm.java.net from here) and patching it (Tools-> Plugins) InTrace with the plugin org-intrace-visualvm.nbm taken from
github.com/mchr3k/org.intrace/tree/master/binaries/jars/latest_development
The trouble is that in org-intrace-visualvm.nbm are not the latest files, so find out where VisualVM stores the plugins and replace the corresponding jars with the most recent ones from github.com/mchr3k/org.intrace/tree/master/binaries/jars/ latest_development
In my case (Linux OS), it was necessary to replace
intrace-agent.jar on intrace-agent.jar and intrace-client-gui-linux.jar on intrace-ui.jar (see the screenshot below, the plugin suggests ways)
Now it remains to run VisualVM, call the context menu for skazka.Repka and select “InTrace Application ...”, after which we will see
press the “Load InTrace Agent” button and the console will report on the implementation of InTrace with a text like
The implementation stage is successfully completed: the InTrace agent has successfully settled in the Java machine, ready to transform the byte code, supplying it with trace commands, and report the results.
We proceed to the stage of observing the result, for which we launch the agent management tool and analysis of the results (separate application).
Again there are two simple options.
1) we implemented the agent in the first "program way" then we start
java -jar intrace-ui.jar taken here
github.com/mchr3k/org.intrace/tree/master/binaries/jars/latest_development
2) in the case of using VisualVM, click on the “Launch InTrace Client” button, and, in principle, absolutely the same file will start as in the first example (since we patched a new intrace-ui.jar)
We drive in the address, set up the parameters of the trace (I turned on the Entry / Exit + Branch + Args), click the “Classes ...” button and specify there skazka (this will add tracing to the classes from the skazka package).
Press "Enter" in the console with the launched "Turnip" (do not forget that this is exactly what she is waiting for to continue) and in the end we will get on the client a chain of program execution in the form of output:
[21:52:39.861]:[1]:skazka.Dedka:<init>: {:24 [21:52:39.862]:[1]:skazka.Dedka:<init>: }:24 [21:52:39.862]:[1]:skazka.Dedka:tyanem: {:26 [21:52:39.865]:[1]:skazka.Dedka:tyanem: Arg (target): [21:52:39.866]:[1]:skazka.Dedka:tyanem: Arg (weight): 200 [21:52:39.868]:[1]:skazka.Babka:<init>: {:30 [21:52:39.869]:[1]:skazka.Babka:<init>: }:30 [21:52:39.871]:[1]:skazka.Babka:tyanem: {:32 [21:52:39.871]:[1]:skazka.Babka:tyanem: Arg (target): [21:52:39.871]:[1]:skazka.Babka:tyanem: Arg (weight): 185 [21:52:39.878]:[1]:skazka.Vorona:<init>: {:36 [21:52:39.878]:[1]:skazka.Vorona:<init>: }:36 [21:52:39.878]:[1]:skazka.Vorona:tyanem: {:38 [21:52:39.879]:[1]:skazka.Vorona:tyanem: Arg (target): [21:52:39.879]:[1]:skazka.Vorona:tyanem: Arg (weight): 175 [21:52:39.879]:[1]:skazka.Vorona:tyanem: /:39 [21:52:39.885]:[1]:skazka.Vorona:tyanem: Throw:39: java.lang.RuntimeException: at skazka.Vorona.tyanem(Repka.java:39) at skazka.Babka.tyanem(Repka.java:32) at skazka.Dedka.tyanem(Repka.java:26) at skazka.Repka.main(Repka.java:11) [21:52:39.885]:[1]:skazka.Vorona:tyanem: }:39 [21:52:39.886]:[1]:skazka.Repka:main: /:13 [21:52:39.890]:[1]:skazka.Repka:processError: {:20 [21:52:39.890]:[1]:skazka.Repka:processError: Arg (ex): java.lang.RuntimeException: [21:52:39.891]:[1]:skazka.Repka:processError: Return: 1 [21:52:39.891]:[1]:skazka.Repka:processError: }:20 [21:52:39.891]:[1]:skazka.Repka:main: }:16 Each line of output is described in the following format.
[ ]:[ ]::: Where:
current time - speaks for itself
thread identifier - unique identifier of the stream, different streams - different numbers (1, 2, 3, 4, ...)
package - namespace
method - the name of the method in which the execution takes place
additional information - depends on the situation
Supported Trace Types:
- input / output method
[21:52:39.861]:[1]:skazka.Dedka:<init>: {:24 [21:52:39.862]:[1]:skazka.Dedka:<init>: }:24 or
[21:52:39.890]:[1]:skazka.Repka:processError: {:20 - branching
[21:52:39.879]:[1]:skazka.Vorona:tyanem: /:39 - arguments (display of objects goes through toString ())
[21:52:39.865]:[1]:skazka.Dedka:tyanem: Arg (target): [21:52:39.866]:[1]:skazka.Dedka:tyanem: Arg (weight): 200 -return values
[21:38:31.444]:[1]:skazka.Repka:processError: Return: 1 - exceptions
[21:52:39.885]:[1]:skazka.Vorona:tyanem: Throw:39: java.lang.RuntimeException: at skazka.Vorona.tyanem(Repka.java:39) at skazka.Babka.tyanem(Repka.java:32) at skazka.Dedka.tyanem(Repka.java:26) at skazka.Repka.main(Repka.java:11) In general - everything you need to successfully understand the progress of the program.
Practice analyzing the output in the above example (something may be intuitively not at all clear, but you quickly get used to it).
An illustrative example of what the code turns into (how traces are arranged) can be found on the author’s page mchr3k.imtqy.com/org.intrace/howintraceworks.html
I also advise you to immediately pay attention to the very useful button "Filter ...", which helps to get rid of unnecessary garbage.
The existing integration with Eclipse allows you to run a Java application with an agent already deployed in InTrace, configure tracing parameters and analyze the result of the work. For more details see here mchr3k.imtqy.com/org.intrace/eclipse.html
TOTAL
Benefits:
1) Monitoring the progress of the program on the fly:
- method calls, passed arguments, branches, generated exceptions, ...
- without recompilation and even without restarting a running program
2) Available code (OpenSource)
3) Easy to set up and use.
4) Cross-platform solution (Windows, Linux)
5) Integration with popular development tools is possible (Eclipse, VisualVM)
Disadvantages:
1) Change byte code on the fly:
- performance speed suffers (performance)
- introduction of the agent “mutates” the existing process and it will never be the same as before (you will not enter the river twice)
- Modifications of the code bytes are “as is” and, naturally, “at your own peril and risk”
2) There is no mass support - only one developer, but is compensated by the small size of the project and the availability of source codes. I am glad that the last update in the repository was a couple of weeks from the publication of this post.
3) The product is well tested on Java 1.6, but not tested on Java 1.7 (and there are problems with it, see the bug github.com/mchr3k/org.intrace/issues/28 ). As far as I understand, the author uses only 1.6, wrote “for himself” and not at all for commerce, so who needs a newer one, do not be lazy to take it and screw it up
In conclusion: InTrace is an agent that definitely deserves to be met at a minimum, and perhaps it will become an indispensable tool for you, revealing the debugging of Java applications from a different angle, and, undoubtedly, will help someone more than once.
Taking into account the comments and additions, I strive to unleash the power of InTrace (as well as a number of other interesting agents) in the JAVA hub and will be very grateful for the help.
Thank you for your attention and be sure to share with those who may be interested!
Source: https://habr.com/ru/post/219661/
All Articles