Kale - open source tool for the detection and correlation of anomalies
To monitor the IT infrastructure, we use a variety of tools, including:
One can discuss the advantages / disadvantages of various monitoring systems for a long time, but I want to dwell only on one issue - the identification of anomalies . When the number of metrics in your monitoring system is measured in hundreds, it is easy to track the abnormal behavior of one or more of them. But when the number of metrics is measured in tens or hundreds of thousands, the issue of automatic detection of anomalies becomes relevant. No administrator or group of administrators is able to manually track the behavior of a complex system consisting of hundreds of devices.
Etsy engineers at one time encountered this problem and developed their own tool for the detection and correlation of anomalies. It is called Kale and consists of two parts:
Consider each of the parts in more detail.
Skyline is a real-time anomaly detection system. It is designed to passively monitor hundreds of thousands of metrics, without the need to set thresholds for each of them. This means that you do not need to manually set trigger thresholds in your monitoring system - the system automatically analyzes the data entering it and, based on several algorithms embedded in it, decides on the "anomaly" of this data.

')
Skyline consists of several components.
Horizon is the component that is responsible for collecting data. It accepts data in two formats: pickle (TCP) and MessagePack (UDP).
Thus, you can configure the following chain: the monitoring system sends data in the format "name_metrics of the timestamp value" in Graphite. On the graphite side, carbon-relay runs, which sends data in pickle format to Horizon. Then, after receiving the data, Horizon processes it, encodes it with the MessagePack, and sends it to Redis. Or you can tweak the monitoring system so that it sends the data to Horizon directly, pre-coding them into the MessagePack format. In addition, most languages of modern programming languages have modules for working with MessagePack .
Also, Horizon regularly cuts and cleans old metrics. If this is not done, then all free memory will soon be exhausted.
In the settings you can also specify a list of metrics that will be ignored.
Redis is a separate component, but without it Skyline will not work. It stores all metrics and coded time series in it.
This solution has its advantages and disadvantages. On the one hand, Redis has high performance due to the fact that all data is stored in RAM. Data is stored in the form of “key - value”, where the key is the name of the metric, and the value is the coded time series corresponding to it. Redis, on the other hand, does not do well with very long lines. The longer the line, the lower the performance. As shown, to store data for more than a day / two does not make sense. In most systems, data has hourly, daily, weekly, and monthly intervals. But if you store data for several weeks or months, Redis performance will be extremely low. To solve this issue, you can use alternative methods for storing time series, for example, using the redis-timeseries library or something similar.
Analyzer - this component is responsible for data analysis. It gets a general list of metrics from Redis, and runs several processes, each of which assigns its own metrics. Each of the processes analyzes data using several algorithms. One by one, the algorithms analyze the metrics and report the result - whether the metric is abnormal or not. If most of them report that the metric currently has an anomaly, then it is considered anomalous. If only one or several algorithms “voted”, then the anomaly does not count. In the settings you can specify the threshold - the number of algorithms that must work before the metric is classified as abnormal. The default is 6.
The following algorithms are currently implemented:
Most of them are based on control charts and on the three sigma rule . You can learn about the principle of operation of some algorithms from reports whose videos are posted at the end of this article. I also want to advise you to get acquainted with the materials of the blog of Anton Lebedevich - mabrek.imtqy.com . He also contributes to the development of Skyline.
Algorithms can be customized, change, delete or add new ones. All of them are collected in a single file, algorithms.py . In their calculations, they use the SciPy and NumPy libraries. About the latter there is a good article on Habré.
In addition to abnormal, as a result of data analysis, the following statuses can also be assigned:
All abnormal metrics fall into the file, on the basis of the data from which the image is formed in the web application.
Analyzer can also send notifications. Currently, mail, HipChat and PagerDuty are available as targets.
A small web application written in Python using the Flask framework is used to display anomalous metrics. It is extremely simple: in the upper part two charts are displayed - for the past hour and the day. Below the graphs is a list of all abnormal metrics. When you hover the cursor over one of the metrics, the picture on the graphs changes. When you click the Oculus window opens, which will be discussed further.
Oculus is used to search for the correlation of anomalies and works in conjunction with the Skyline. When Skyline finds an anomaly and displays it in its web interface, we can click on the name of the anomalous metric and Oculus will show us all the metrics that correlate with the original one.
In short, the search algorithm can be described as follows. Initially, the initial series of values, for example, a series of the form [960, 350, 350, 432, 390, 76, 105, 715, 715] , is normalized: a maximum is searched for - it will correspond to 25, and a minimum - it will correspond to 0; thus, the data is proportionally distributed in the limit of integers from 0 to 25. As a result, we obtain a series of the form [25, 8, 8, 10, 9, 0, 1, 18, 18] . Then the normalized series is encoded using 5 words: sdec (sharply down), dec (down), s (exactly), inc (up), sinc (sharply up). The result is a series of the form [sdec, flat, inc, dec, sdec, inc, sinc, flat] .
Then, using ElasticSearch, it searches for all metrics that are similar in form to the original. Data in ElasticSearch is stored as:
First, a fingerprint search is performed. The result is a sample, the number of metrics in which is an order of magnitude smaller than the total number. Further, the fast dynamic time transformation (FastDTW) algorithm is used for analysis, which uses the values of values . There is a good article about the FastDTW algorithm.
As a result, we get the data of all the metrics found that correlate with the original.
To import data from Redis, scripts written in Ruby are used. They take all metrics with the “mini” prefix, decode them, normalize and export them to ElasticSearch. While updating and indexing, the ElasticSearch search speed decreases. Therefore, in order not to wait for results for a long time, two ElasticSearch servers are used in separate clusters, between which Oculus regularly switches.
For searching and displaying graphs, a web application is used which uses the Sinatra framework. The search can be carried out either by the name of the metric or simply by drawing a curve in a special field:
As a result, we will see a page that displays:
Data can be filtered, and also grouped into a collection , give them a description and store in memory. Collections are used in the following cases. Suppose we have identified some anomaly and received a list of graphs confirming this phenomenon. It will be convenient to save these graphs and give them a detailed description. Now, when a similar problem happens in the future, Oculus will find us this collection and the description written earlier will help us to understand the causes and ways of eliminating the identified problem.
The figure below is a diagram of the Kale:
I will not describe the installation and configuration process, as it is not very complicated and is listed in the Skyline and Oculus documentation.
We are currently running the system in test mode - all components run on the same virtual machine. But even with a rather weak configuration (Intel Xeon E5440, 8 Gb RAM), the system easily analyzes more than ten thousand metrics in real time. The main difficulty in operation is setting the parameters for detecting anomalies. Errors of the second kind (false negatives) have not yet occurred, but with errors of the first kind (false positives) we regularly meet and try to customize the algorithms to fit our needs. The main problem is the seasonality of the data. There is a Holt-Winters method that takes seasonality into account, but it has several disadvantages:
So the question of developing algorithms for detecting anomalies, especially with regard to seasonal data, remains open.
github.com/etsy/skyline
github.com/etsy/skyline/wiki
https://groups.google.com/forum/#!forum/skyline-dev
github.com/etsy/oculus
mabrek.imtqy.com
The video features a performance by Abe Stanway, the developer of Kale .
Report by Jon Cowie and Abe Stanway at the Velocity conference in which they talk about their offspring -
The second part of the speech.
Report by Anton Lebedevich “Statistics in practice for the search for anomalies in load testing and production”
- Zabbix - there are a lot of articles written about him here in Habré. We really like its low-level detection capabilities, but its data visualization capabilities leave a lot to be desired.
- Graphite is a system that stores data and has a convenient interface for displaying it. Now we import metrics from Zabbix into it and store the history.
- Shinken is a monitoring system that is based on Nagios and written in Python. Now we look to her. We like the fact that it is very easy to import data from the Netdot network documentation system (I wrote about it earlier), and also it easily integrates with Graphite.
One can discuss the advantages / disadvantages of various monitoring systems for a long time, but I want to dwell only on one issue - the identification of anomalies . When the number of metrics in your monitoring system is measured in hundreds, it is easy to track the abnormal behavior of one or more of them. But when the number of metrics is measured in tens or hundreds of thousands, the issue of automatic detection of anomalies becomes relevant. No administrator or group of administrators is able to manually track the behavior of a complex system consisting of hundreds of devices.
Etsy engineers at one time encountered this problem and developed their own tool for the detection and correlation of anomalies. It is called Kale and consists of two parts:
Consider each of the parts in more detail.
Skyline
Skyline is a real-time anomaly detection system. It is designed to passively monitor hundreds of thousands of metrics, without the need to set thresholds for each of them. This means that you do not need to manually set trigger thresholds in your monitoring system - the system automatically analyzes the data entering it and, based on several algorithms embedded in it, decides on the "anomaly" of this data.
')
Skyline consists of several components.
Horizon
Horizon is the component that is responsible for collecting data. It accepts data in two formats: pickle (TCP) and MessagePack (UDP).
Thus, you can configure the following chain: the monitoring system sends data in the format "name_metrics of the timestamp value" in Graphite. On the graphite side, carbon-relay runs, which sends data in pickle format to Horizon. Then, after receiving the data, Horizon processes it, encodes it with the MessagePack, and sends it to Redis. Or you can tweak the monitoring system so that it sends the data to Horizon directly, pre-coding them into the MessagePack format. In addition, most languages of modern programming languages have modules for working with MessagePack .
Also, Horizon regularly cuts and cleans old metrics. If this is not done, then all free memory will soon be exhausted.
In the settings you can also specify a list of metrics that will be ignored.
Redis
Redis is a separate component, but without it Skyline will not work. It stores all metrics and coded time series in it.
This solution has its advantages and disadvantages. On the one hand, Redis has high performance due to the fact that all data is stored in RAM. Data is stored in the form of “key - value”, where the key is the name of the metric, and the value is the coded time series corresponding to it. Redis, on the other hand, does not do well with very long lines. The longer the line, the lower the performance. As shown, to store data for more than a day / two does not make sense. In most systems, data has hourly, daily, weekly, and monthly intervals. But if you store data for several weeks or months, Redis performance will be extremely low. To solve this issue, you can use alternative methods for storing time series, for example, using the redis-timeseries library or something similar.
Analyzer
Analyzer - this component is responsible for data analysis. It gets a general list of metrics from Redis, and runs several processes, each of which assigns its own metrics. Each of the processes analyzes data using several algorithms. One by one, the algorithms analyze the metrics and report the result - whether the metric is abnormal or not. If most of them report that the metric currently has an anomaly, then it is considered anomalous. If only one or several algorithms “voted”, then the anomaly does not count. In the settings you can specify the threshold - the number of algorithms that must work before the metric is classified as abnormal. The default is 6.
The following algorithms are currently implemented:
- mean deviation (mean absolute deviation);
- Grubbs' test;
- average for the first hour (first hour average);
- standard deviation from average;
- standard deviation from moving average (standard deviation from moving average);
- least squares method;
- histogram bins;
- Kolmogorov acceptance criterion (K – S test).
Most of them are based on control charts and on the three sigma rule . You can learn about the principle of operation of some algorithms from reports whose videos are posted at the end of this article. I also want to advise you to get acquainted with the materials of the blog of Anton Lebedevich - mabrek.imtqy.com . He also contributes to the development of Skyline.
Algorithms can be customized, change, delete or add new ones. All of them are collected in a single file, algorithms.py . In their calculations, they use the SciPy and NumPy libraries. About the latter there is a good article on Habré.
In addition to abnormal, as a result of data analysis, the following statuses can also be assigned:
- TooShort : the time series is too short to draw any conclusions;
- Incomplete : the length of the time series in seconds is less than the full period specified in the settings (as a rule, 86400 s);
- Stale : the time series has not been updated for a long time (the time in seconds is set in the settings);
- Boring : the values of the time series have not changed for some time (set in the settings);
All abnormal metrics fall into the file, on the basis of the data from which the image is formed in the web application.
Analyzer can also send notifications. Currently, mail, HipChat and PagerDuty are available as targets.
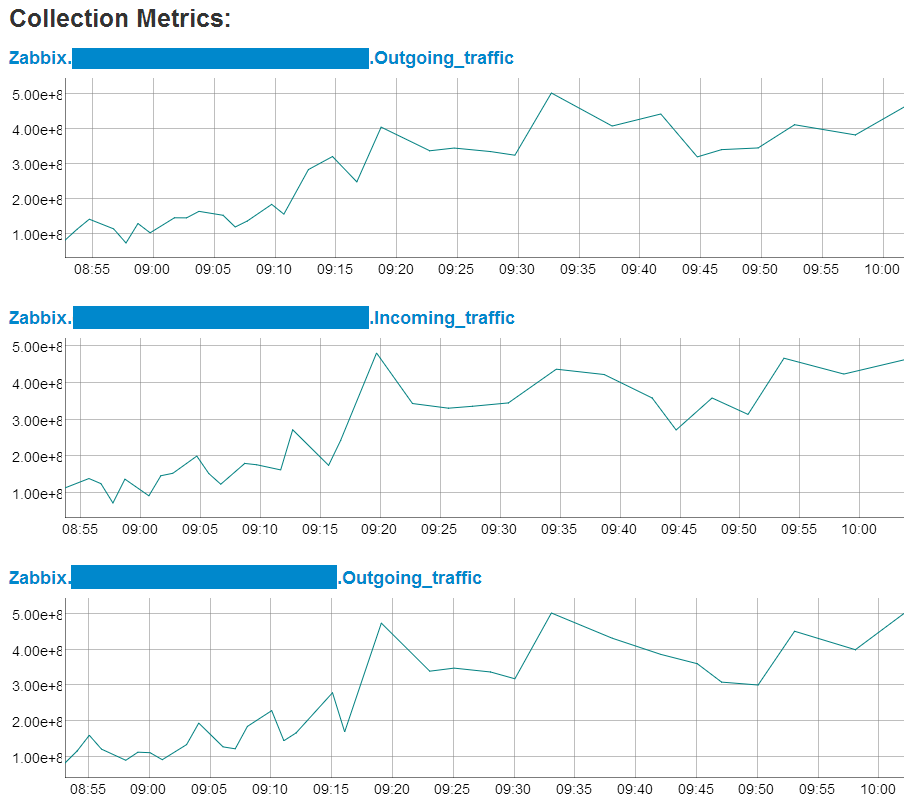
Flask webapp
A small web application written in Python using the Flask framework is used to display anomalous metrics. It is extremely simple: in the upper part two charts are displayed - for the past hour and the day. Below the graphs is a list of all abnormal metrics. When you hover the cursor over one of the metrics, the picture on the graphs changes. When you click the Oculus window opens, which will be discussed further.
Oculus
Oculus is used to search for the correlation of anomalies and works in conjunction with the Skyline. When Skyline finds an anomaly and displays it in its web interface, we can click on the name of the anomalous metric and Oculus will show us all the metrics that correlate with the original one.
In short, the search algorithm can be described as follows. Initially, the initial series of values, for example, a series of the form [960, 350, 350, 432, 390, 76, 105, 715, 715] , is normalized: a maximum is searched for - it will correspond to 25, and a minimum - it will correspond to 0; thus, the data is proportionally distributed in the limit of integers from 0 to 25. As a result, we obtain a series of the form [25, 8, 8, 10, 9, 0, 1, 18, 18] . Then the normalized series is encoded using 5 words: sdec (sharply down), dec (down), s (exactly), inc (up), sinc (sharply up). The result is a series of the form [sdec, flat, inc, dec, sdec, inc, sinc, flat] .
Then, using ElasticSearch, it searches for all metrics that are similar in form to the original. Data in ElasticSearch is stored as:
{ fingerprint: dec sinc dec sdec dec sdec sinc values: 13.18 12.72 14.8 14.43 12.95 12.13 6.87 9.67 id: mini.Shinken_server.shinken.CPU_Stats.cpu_all_sys } First, a fingerprint search is performed. The result is a sample, the number of metrics in which is an order of magnitude smaller than the total number. Further, the fast dynamic time transformation (FastDTW) algorithm is used for analysis, which uses the values of values . There is a good article about the FastDTW algorithm.
As a result, we get the data of all the metrics found that correlate with the original.
To import data from Redis, scripts written in Ruby are used. They take all metrics with the “mini” prefix, decode them, normalize and export them to ElasticSearch. While updating and indexing, the ElasticSearch search speed decreases. Therefore, in order not to wait for results for a long time, two ElasticSearch servers are used in separate clusters, between which Oculus regularly switches.
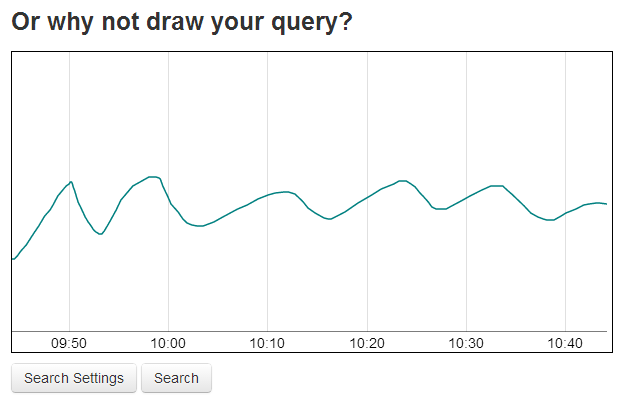
For searching and displaying graphs, a web application is used which uses the Sinatra framework. The search can be carried out either by the name of the metric or simply by drawing a curve in a special field:
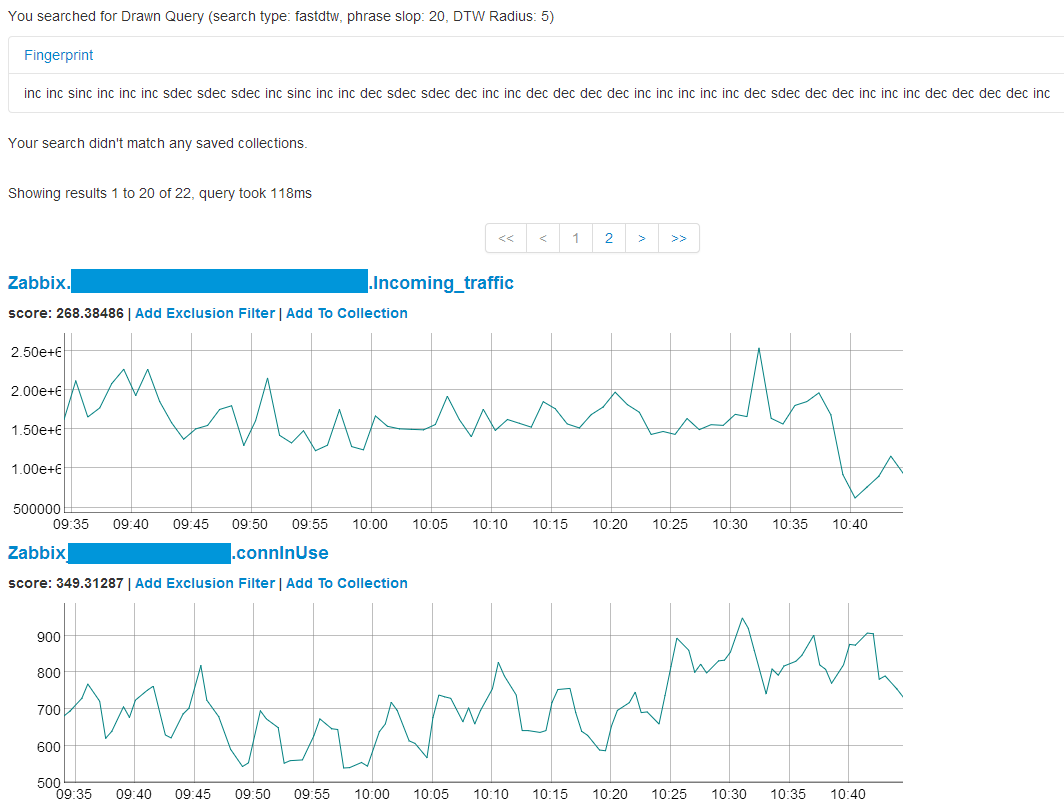
As a result, we will see a page that displays:
- information about search parameters;
- encoded representation of the original graphics;
- the list of collections (about them below), in case the data correlates with the previously saved data;
- list of graphs found, sorted in ascending order of correlation (the smaller the estimate, the more data correlate).
Data can be filtered, and also grouped into a collection , give them a description and store in memory. Collections are used in the following cases. Suppose we have identified some anomaly and received a list of graphs confirming this phenomenon. It will be convenient to save these graphs and give them a detailed description. Now, when a similar problem happens in the future, Oculus will find us this collection and the description written earlier will help us to understand the causes and ways of eliminating the identified problem.
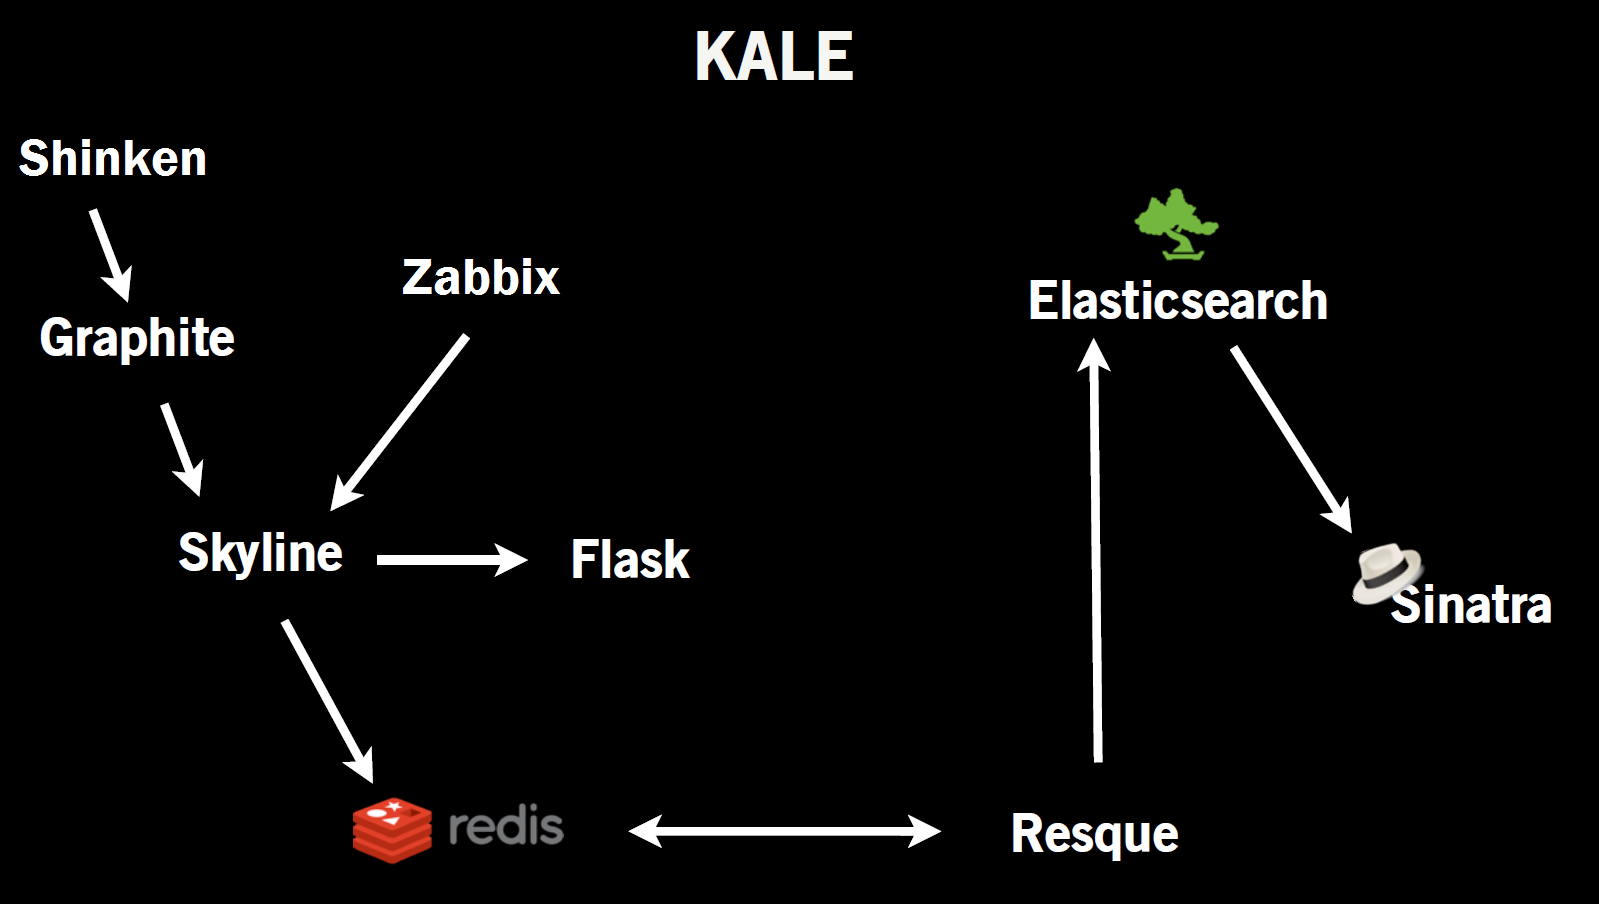
The figure below is a diagram of the Kale:
I will not describe the installation and configuration process, as it is not very complicated and is listed in the Skyline and Oculus documentation.
We are currently running the system in test mode - all components run on the same virtual machine. But even with a rather weak configuration (Intel Xeon E5440, 8 Gb RAM), the system easily analyzes more than ten thousand metrics in real time. The main difficulty in operation is setting the parameters for detecting anomalies. Errors of the second kind (false negatives) have not yet occurred, but with errors of the first kind (false positives) we regularly meet and try to customize the algorithms to fit our needs. The main problem is the seasonality of the data. There is a Holt-Winters method that takes seasonality into account, but it has several disadvantages:
- only one season is taken into account (in real data there may be more than one season - an hour, a day, a week, a year);
- more data is needed for several seasons (therefore, this method is not applicable on Skyline - the size of the lines in the Redis database will be too large);
- in case of anomaly, it will be taken into account in future seasons with a gradual fading;
So the question of developing algorithms for detecting anomalies, especially with regard to seasonal data, remains open.
Links
github.com/etsy/skyline
github.com/etsy/skyline/wiki
https://groups.google.com/forum/#!forum/skyline-dev
github.com/etsy/oculus
mabrek.imtqy.com
Video
The video features a performance by Abe Stanway, the developer of Kale .
Report by Jon Cowie and Abe Stanway at the Velocity conference in which they talk about their offspring -
The second part of the speech.
Report by Anton Lebedevich “Statistics in practice for the search for anomalies in load testing and production”
Source: https://habr.com/ru/post/219377/
All Articles