Expanding MS Excel 2010 with R
Good afternoon, dear readers.
Today I want to show how you can connect the capabilities of the R language and MS Excel 2010 office suite. Below, I will tell you how you can extend the functionality of the embedded VBA language using the R functions, and the RExcel add-in will help me with this. Instructions for installing it can be easily found on the network or off. site.
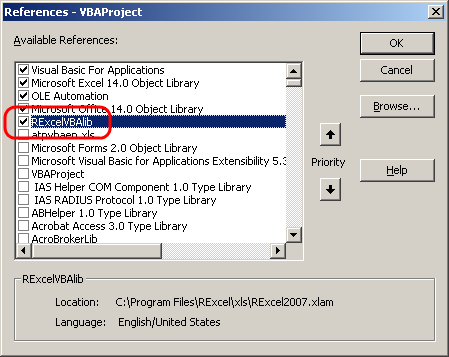
In order for us to use the R functions from VBA, you need to open in Excel the "Visual Basic Editor" ( Alt + F11 ). After that, you need to add the RExcelVBAlib module to the project, you can do this by going to Tools-> References and ticking the necessary item.
This module contains the class rinterface , by means of which the interaction of the components of our bundle takes place.
For the demonstration, I took the initial data on dollar quotes from the site “Finam” for the period of December 16, 2011 to March 20, 2014. For example, based on their means R we construct a schedule for changing the monthly opening price ( 'OPEN' ).
')
First, let's write the code on R, which will perform the task and save it to a file, for example
We will understand what this code does.
First, we load the
Then we create a function that does the following:
So, we wrote the code for R. Now let's see how to call it from VBA .
There are several ways to do this that will be shown below.
This method is the easiest to understand and the longest in the number of lines of code. The procedure code for it is as follows:
As you can see in this procedure, 3 functions from rinterface are used :
The
The last in the
After the functions described above, the operation of the call_r_func () procedure should not raise questions. In short, this procedure simply executed the above R script line by line.
The advantage of this method is that all the code is concentrated in the VBA macro , which can be convenient for small tasks.
The disadvantage is inconvenient debugging of code on R.
The procedure for this method is as follows:
This code has 3 new features:
The first
The
From the description above, it becomes clear that our procedure call_r_impotr_func_without_print () first executes the external file agg_price.R . It then calls the agg_price_func function for a set of data from the specified range. And at the end displays the graph on a given sheet.
The advantage of this method is the ease of debugging code on R , since It can be written in any editor or IDE.
From the minuses it should be noted that at the output instead of one file we get 2: xls and r.
Procedure code:
This procedure has only one small difference from the previous one, namely instead of
The difference of this function is that it can return a result ( return (...) is not ignored), and not just execute some code. Although those familiar with the definition of procedures and functions, this difference is clear.
In addition, in
The pros and cons of this approach are the same as the previous one.
After completing these VBA procedures, our test sheet looks like this:

In the article I tried to show the most useful options for the execution of R code from VBA . In addition, the advantages and disadvantages of all these methods were described in a concise manner. I must also say that RExcel can work without VBA.
It should be noted that not all the functions of the interface rinterface are shown , but this material will make it possible to master the functions that are not described with minimal time.
The file with the procedures can be taken from me on GitHub .
Today I want to show how you can connect the capabilities of the R language and MS Excel 2010 office suite. Below, I will tell you how you can extend the functionality of the embedded VBA language using the R functions, and the RExcel add-in will help me with this. Instructions for installing it can be easily found on the network or off. site.
Task setting and preliminary settings
In order for us to use the R functions from VBA, you need to open in Excel the "Visual Basic Editor" ( Alt + F11 ). After that, you need to add the RExcelVBAlib module to the project, you can do this by going to Tools-> References and ticking the necessary item.
This module contains the class rinterface , by means of which the interaction of the components of our bundle takes place.
For the demonstration, I took the initial data on dollar quotes from the site “Finam” for the period of December 16, 2011 to March 20, 2014. For example, based on their means R we construct a schedule for changing the monthly opening price ( 'OPEN' ).
')
RExcel rinterface basics
First, let's write the code on R, which will perform the task and save it to a file, for example
agg_price.R (we will need it later). library(zoo) agg_price_func <- function(x) { y <- zoo(x$OPEN, as.Date(as.character(x$DATE),"%Y%m%d")) new_y <- aggregate(y, as.yearmon, mean) plot(new_y) return (new_y) } We will understand what this code does.
First, we load the
zoo library, which we need to work with time series.Then we create a function that does the following:
- Transforms our data set into a time series . The indexes of which will be the values of the 'Date' column converted to a date. The values of the levels of this row will be equal to the column ' OPEN '.
- With the next line, we aggregate our data by month using the aggregate function. This step is needed because the initial data we have contains daily data, and we need to go to the months.
- displaying a graph of monthly values
- We return an array with monthly values, on the basis of which the graph was built.
So, we wrote the code for R. Now let's see how to call it from VBA .
There are several ways to do this that will be shown below.
Method 1. Line by line execution of function commands.
This method is the easiest to understand and the longest in the number of lines of code. The procedure code for it is as follows:
Sub call_r_func() RInterface.PutDataframe "open_price", Range("USD!A1:C535") RInterface.RRun "library(zoo)" RInterface.RRun "price <- zoo(open_price$OPEN, as.Date(as.character(open_price$DATE),""%Y%m%d""))" RInterface.RRun "agg_price <- aggregate(price, as.yearmon, mean)" RInterface.RRun "plot(agg_price)" RInterface.InsertCurrentRPlot Range("OPEN_PRICE!A1"), widthrescale:=0.5, heightrescale:=0.5, closergraph:=True End Sub As you can see in this procedure, 3 functions from rinterface are used :
PutDataframeRRunInsertCurrentRPlot
The
PutDataframe function is used to load data into an R language variable of the dataframe type. As the first parameter, it is passed the name of the future variable that the interface will use. The second parameter is the range of values that the variable will contain.RRun is used to execute the interpreter's command R. As a parameter, it is passed a string that will be executed by it.The last in the
InsertCurrentRPlot list performs the output of R graphics on a given MS Excel sheet. As the first parameter the cell is transferred to it in which the graph will be displayed. The parameters widthrescale and heightrescale are used to scale the output graphics (in our case 50%). A closergraph indicates that the plot plotted using the plot() function needs to be closed.After the functions described above, the operation of the call_r_func () procedure should not raise questions. In short, this procedure simply executed the above R script line by line.
The advantage of this method is that all the code is concentrated in the VBA macro , which can be convenient for small tasks.
The disadvantage is inconvenient debugging of code on R.
Method 2. Using the external function to display the graph.
The procedure for this method is as follows:
Sub call_r_impotr_func_without_print() RInterface.RunRFile "D:/agg_price.R" RInterface.RunRCall "agg_price_func", AsSimpleDF(Range("USD!A1:C535")) RInterface.InsertCurrentRPlot Range("OPEN_PRICE!H1"), widthrescale:=0.5, heightrescale:=0.5, closergraph:=True End Sub This code has 3 new features:
RunRFileAsSimpleDFRunRCall
The first
RunRFile in this list allows RunRFile to run the code in the .r fileAsSimpleDF converts the range selected in the parameter to the type of data set ( dataframe ).The
RunRCall function makes a procedure call and the result does not return it ( return (...) is ignored). The first parameter is the name of the procedure, or its code on R. All subsequent parameters transfer the parameters defined in the procedure (in our case it is one).From the description above, it becomes clear that our procedure call_r_impotr_func_without_print () first executes the external file agg_price.R . It then calls the agg_price_func function for a set of data from the specified range. And at the end displays the graph on a given sheet.
The advantage of this method is the ease of debugging code on R , since It can be written in any editor or IDE.
From the minuses it should be noted that at the output instead of one file we get 2: xls and r.
Method 3. Using the external function with data output and schedule.
Procedure code:
Sub call_r_impotr_func_with_print() RInterface.RunRFile "D:/agg_price.R" RInterface.GetRApply "agg_price_func", Range("OPEN_PRICE!A19"), AsSimpleDF(Range("USD!A1:C535")) RInterface.InsertCurrentRPlot Range("OPEN_PRICE!D19"), closergraph:=True End Sub This procedure has only one small difference from the previous one, namely instead of
RunRCall is called GetRApply .The difference of this function is that it can return a result ( return (...) is not ignored), and not just execute some code. Although those familiar with the definition of procedures and functions, this difference is clear.
In addition, in
GetRApply after the parameter with the name of the function, it is also necessary to specify the range of cells to which the values resulting from the function will be displayed.The pros and cons of this approach are the same as the previous one.
Conclusion
After completing these VBA procedures, our test sheet looks like this:
In the article I tried to show the most useful options for the execution of R code from VBA . In addition, the advantages and disadvantages of all these methods were described in a concise manner. I must also say that RExcel can work without VBA.
It should be noted that not all the functions of the interface rinterface are shown , but this material will make it possible to master the functions that are not described with minimal time.
The file with the procedures can be taken from me on GitHub .
Source: https://habr.com/ru/post/219229/
All Articles