PRFRL - how the analytics interface is arranged
In this post I would like to tell more about the concept of the analytics panel. Actually, it is she who gives developers unique opportunities to find problem-specific places in the code.
All our experience with highload projects says that 80% of the time is consumed by 2-3 weak points in the system, eliminating which can lead to a significant increase in the speed of work. Therefore, the whole process consists in comparing the speed of work of various pieces of code and selecting the slowest ones.
')
In order to understand the execution time of a piece of code, we use timers - this is an entity that knows what the code is called, knows in what environment it runs and how long it takes. For example: [mysite.ru, dellete_user_from_db, 0.03s] Having accumulated such timers for a sufficiently long time, we can begin to analyze this data.
To identify bottlenecks, in fact, we just need to take a list of timers and sort it by any parameter that interests us, for example, by the maximum execution time. This approach became the basis of the control panel interface. Let's look at the interface closer.
The first screen is just a raw stream of timers, where you can see if the code works at all :) On the screen you can see all 5 timer parameters
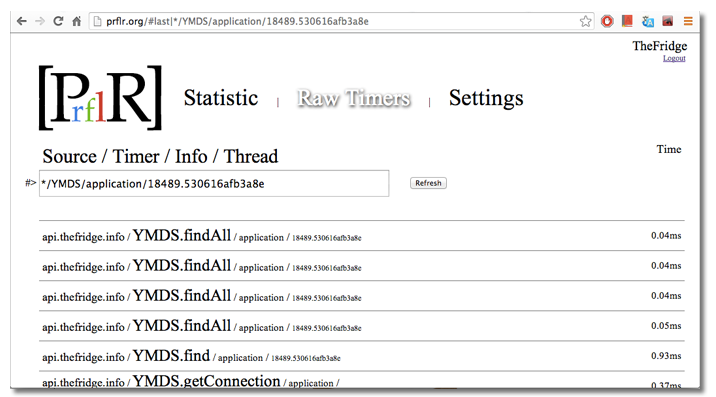
Looking at this screen, it is clear that the last in the system were 4 requests to MongoDB. 3 - for 0.04ms and one for 0.05ms
At the top of the list of timers is the search string. I think its syntax and assignment is not necessary to explain, everything is trivial. Each value works as a search for a substring in the corresponding timer parameter.
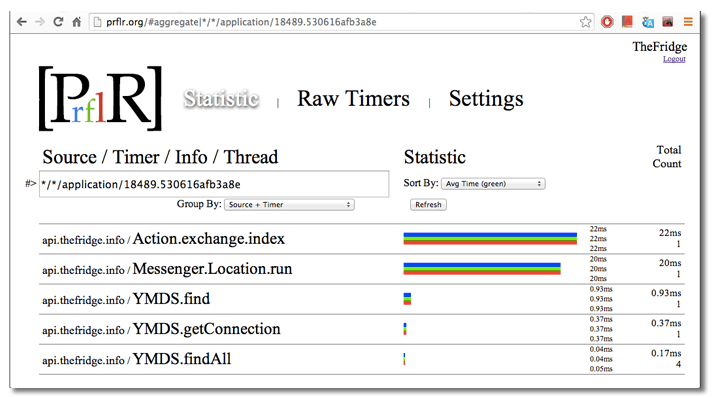
Finally we got to the most important section of statistical processing. It shows the same timers, search string. For each timer, accumulated statistics are displayed.
The following values are available:
Under the search bar there is a grouping timer selector. You can group by source, timer name, or by + another together. This greatly helps in the analysis.
By embedding the SDK in the application and making sure that the timers began to arrive in the PRFLR, you can start looking at the statistics slices and sort by various parameters.
For example, by entering the value "* / mongo / * / *" in the search bar - we get all the timers related to working with mongoDB. Switching the group selector, we can answer 3 questions at once:
The last grouping option sometimes gives too much data, so it’s more convenient to filter the data for a specific server by specifying the server name in the search string.
Usually there are several typical statistics slices: compare the servers with each other, look at the work of a separate module inside, look at how the module works on different servers, select everything and see what is tupit and eat resources.
PRFLR began to be done long ago, but it was most seriously used to analyze the geographical distribution of a distributed server backend of a single mobile application. Servers were in 5 different data centers on 3 continents. And each server was unique by hardware. From 8 nuclear xenon with 32GB of RAM, to virtualka with 500MB of memory. In just a few days, we found and fixed almost all the jambs in performance. A regular analysis of the work after each release does not allow new problems to appear.
From experience we can assure you that if you don’t even understand the software architecture very deeply, but it will take you about 30 minutes to perform a thorough analysis in terms of performance, even if the system consists of dozens of modules and runs on 10-20 servers.
Repeated analysis of the field of releases will take about 5 minutes. But this is exactly what is needed - to give the necessary analytics and for the shortest possible period of time.
PRFLR is an analytics system aimed at the early detection of performance- sensitive applications. Realtime and directly on Production servers.
Primarily PRFLR is focused on high-load server applications running on large clusters, however, it is applicable for small projects, desktop and mobile applications. Of course, if you really care about their performance.
Concept
All our experience with highload projects says that 80% of the time is consumed by 2-3 weak points in the system, eliminating which can lead to a significant increase in the speed of work. Therefore, the whole process consists in comparing the speed of work of various pieces of code and selecting the slowest ones.
')
In order to understand the execution time of a piece of code, we use timers - this is an entity that knows what the code is called, knows in what environment it runs and how long it takes. For example: [mysite.ru, dellete_user_from_db, 0.03s] Having accumulated such timers for a sufficiently long time, we can begin to analyze this data.
To identify bottlenecks, in fact, we just need to take a list of timers and sort it by any parameter that interests us, for example, by the maximum execution time. This approach became the basis of the control panel interface. Let's look at the interface closer.
RAW Timers
The first screen is just a raw stream of timers, where you can see if the code works at all :) On the screen you can see all 5 timer parameters
- Source - the source of the timer. Maybe site, ip, application name
- Timer - the name of the timer. You know the name of a piece of code. Usually set so that it matches the function / class. Method
- Info- additional information about the timer, for example, the result of the function, the API version, the author of the last commit :)
- Thread - the thread in which the timer was running helps a lot when analyzing single blunts in the code.
- Time is milliseconds indicating the one-time execution of the timer.
Looking at this screen, it is clear that the last in the system were 4 requests to MongoDB. 3 - for 0.04ms and one for 0.05ms
At the top of the list of timers is the search string. I think its syntax and assignment is not necessary to explain, everything is trivial. Each value works as a search for a substring in the corresponding timer parameter.
Statistic
Finally we got to the most important section of statistical processing. It shows the same timers, search string. For each timer, accumulated statistics are displayed.
The following values are available:
- min, avr, max - the minimum, average and maximum time of the timer
- count - the total number of timers
- total - the total execution time of all timers of this type
Under the search bar there is a grouping timer selector. You can group by source, timer name, or by + another together. This greatly helps in the analysis.
And how to use it?
By embedding the SDK in the application and making sure that the timers began to arrive in the PRFLR, you can start looking at the statistics slices and sort by various parameters.
For example, by entering the value "* / mongo / * / *" in the search bar - we get all the timers related to working with mongoDB. Switching the group selector, we can answer 3 questions at once:
- source - on which server does mongoDB work most slowly
- timer - which query is the most problematic in the system as a whole
- source + timer - look at which server exactly which request is working badly
The last grouping option sometimes gives too much data, so it’s more convenient to filter the data for a specific server by specifying the server name in the search string.
Usually there are several typical statistics slices: compare the servers with each other, look at the work of a separate module inside, look at how the module works on different servers, select everything and see what is tupit and eat resources.
And how do you use it yourself?
PRFLR began to be done long ago, but it was most seriously used to analyze the geographical distribution of a distributed server backend of a single mobile application. Servers were in 5 different data centers on 3 continents. And each server was unique by hardware. From 8 nuclear xenon with 32GB of RAM, to virtualka with 500MB of memory. In just a few days, we found and fixed almost all the jambs in performance. A regular analysis of the work after each release does not allow new problems to appear.
From experience we can assure you that if you don’t even understand the software architecture very deeply, but it will take you about 30 minutes to perform a thorough analysis in terms of performance, even if the system consists of dozens of modules and runs on 10-20 servers.
Repeated analysis of the field of releases will take about 5 minutes. But this is exactly what is needed - to give the necessary analytics and for the shortest possible period of time.
Source: https://habr.com/ru/post/219031/
All Articles