Analysis of the application protected by the virtual machine
In this article, we will consider building application protection using various software "tricks" such as: resetting the zero entry point, encrypting the file body and the decryptor covered with polymorph garbage, hiding the execution logic of the application algorithm in the virtual machine body.
Unfortunately, the article will be hard enough for an ordinary application programmer who is not interested in software protection, but there's nothing to be done about it.
For more or less adequate perception of the article will require minimal knowledge of the assembler (there will be a lot of it) as well as skills in working with a debugger.
')
But those who hope that some simple steps to implement this type of protection will be given here will have to be disappointed. The article will consider the already implemented functionality, but ... in terms of its hacking and the full reverse of the algorithm.
The main goals that I set for myself are to give a general idea of how such software protection works, but the most important thing is how a person who will remove your protection will approach this, because there is an old rule - you cannot implement a competent protection kernel algorithm imagining the methods of its analysis and hacking.
As a recipient, on the advice of one sufficiently competent comrade, I chose a slightly old (but not lost in actuality, due to the quality of performance) keygenme from the notorious Ms-Rem.
Here is the original link where it appeared: http://exelab.ru/f/index.php?action=vthread&forum=1&topic=4732
And then he got here: http://www.crackmes.de/users/ms_rem/keygenme_by_ms_rem/
Where this keygenme was set to 8 out of 10 (* VERY VERY * hard).
Although, to be honest, this is a slightly overestimation - I would put in the area of 5-6 points.
Perhaps we will begin.
For good, for the full debugging of this keygenme, the most convenient platform will be Windows XP 32 bits, it is generally the most optimal environment, therefore I am constantly deployed on my workstation as a virtual machine.
Under Windows 7 - 32 bits (on which debugging was actually done in the process of writing this article) will be a little difficult, but they can be solved (this will be mentioned in the fourth chapter of the article).
Serious difficulties will begin on 64-bit OC due to the fact that the tool used as the main tool (OllyDebug) when debugging this Keygenme will produce errors even at the stage of the loader operation. OllyDebug version 2 will not spit out these errors, but there is one more difficulty, for it there are no necessary plug-ins yet (or maybe I’ve been looking badly).
The keygenme itself must be downloaded from this link: http://exelab.ru/f/files/3635_03.05.2006_CRACKLAB.rU.tgz (registration will be required).
To complete the work with the text of the article, if you decide to go through all the steps described in it, you will need a small set of tools.
I will not describe here in detail about them, all that needs to be done is described in the file “used_tools.txt” located in the root of the archive with examples for the article: http://rouse.drkb.ru/blog/vm_analize.zip
It is also necessary to remember the correct pair of login and serial numbers provided by the very first link, namely “Ms-Rem” and “C38FB7A0CF38F73B1159”. These data will greatly help in the process of parsing keygenme.
Once everything is set, you can begin.
For a start it is worth deciding what we are dealing with.
Start PEiD and open keygenme.exe in it.
Press the rightmost bottom button and select the “Hardcore Scan” type in the menu.

The trouble starts right away, firstly the entry point of the Entrypoint is set to zero, which cannot be in a normal executable file, secondly, the scan showed that UPolyX v0.5 * is present.
The second is just not scary - there would be something like “EXECryptor” or “Themida” - some kind of commercial protectors, then yes, and then just some suitable signature seemed to be found.
We press the second lower right button and in the appeared dialog there are three buttons on the right.

He says that the file is packed and the entropy is already 7.56.
Well, let's say, although it still says nothing. Big entropy happens not only at the packed, but also at the ciphered files.
Close the dialog and click on the button to the right of "Subsystem:"

In addition to the entry point, the code and data bases are killed, the standard load base is 4000000.
Well, okay - in our hands we have a file that was slightly adjusted with pens.
Let's try to feel it all in the debugger.
Open OllyDebug, go to the "Options" menu, select "Debugging options" and on the "Events" tab set the checkbox "Make first pause at: -> System breakpoint".
Thus, we will force the debugger to stop when receiving the first debug message before transferring control to the body of the application being debugged.
This is done because of the entry point dropped to zero.
Open the keygenme.exe itself and immediately interrupt somewhere inside the ntdll.dll

What is the entry point (for the application) is the offset from its load base (hInstance), to which the loader transfers control immediately after the process is initialized.
The load base always contains a PE header, where the very first is the _IMAGE_DOS_HEADER structure.
Since the entry point at keygenme is zero, which means control will be transferred directly to its hInstance.
Knowing this, let's see what we have there.
Press "Ctrl + G" and drive in the address of the database "400000", it should work out something like this:

Quite a decent code instead of a standard header, but the title should be in place, otherwise the application would not start, so changes were made directly to _IMAGE_DOS_HEADER.
We look what exactly has changed:
The e_magic field cannot be touched and it must always contain the initials of Mark Zbikowski 'MZ' (0x4D, 0x5A).
Actually it is not touched, and both of these symbols are interpreted as instructions:
The value of the second e_cblp field is changed to 0x45, 0x52, which, as a result, cancels the changes made by the first two instructions, restoring the correct stack state.
The remaining 4 fields are used to implement the MOV + JMP commands.
Here in this picture it is shown more clearly.

The whole point of such manipulations with _IMAGE_DOS_HEADER and a dropped entry point is the transfer of control somewhere inside the application body at 4053B6.
Those. in principle, we can open keygenme.exe right now and specify 53B6 as an entry point in the corresponding field (ignoring edits in the file header), but is this the correct entry point?
We go to the address of the transition "Ctrl + G" 4056B6 and there we see this:

Generally solid garbage. Whatever the line, the garbage instruction.
For example, all conditional branch operators (JG / JPE / JCXZ / JE) are garbage, because it does not matter whether the condition is fulfilled or not, the transition will always be carried out to the next line (note the addresses of the jumps).
Instructions LEA, MOV, XCNG work with the same register without making any changes to its state - garbage.
The instructions for working with the mattress processor (FCLEX / FFREE) reset the exceptions (which are not present, since the work with the mattress processor has not yet been carried out) frees the registers (which are not actually occupied) - garbage.
Scroll through the code to the end to see where this mess of garbage ends.
Just scroll down until we get to the code consisting of all zeros:

Yeah, but it looks like the address we need is 401000, to which the jump is going, which theoretically could be the original entry point.
Let's see what is there:

And there we have the code, which obviously should not be in the Win32 application, which is clearly indicated by the instructions IN and OUT, which will generate an exception when they are executed.
So it turns out that the code at the original entry point (OEP - Original Entry Point) is encrypted and the code in procedure 53B6 must decrypt it before performing the final jump.
But!!!
But in the 53B6 procedure, as shown earlier, garbage.
In fact, there should be more than trash. Apparently we are dealing with the so-called garbage polymorphic, and in its most simple implementation.
The task of the polymorphic engine is to convert the original code by replacing the original instructions with their analogues (or groups of analogues). In order to make the analysis of the resulting code difficult, garbage blocks of instructions are usually added.
Here, the blocks are not observed, just garbage instructions are generated, plus in the end even if there was a replacement of instructions with analogs, then I noticed this only in one case. It is quite possible that just a garbage generator was used here, which plentifully crammed it between useful instructions, who knows ...
However, a task appeared - it is necessary among all this garbage from the address 4053B6 to 406839 (5251 bytes - however) to find useful instructions that carry out the application's script.
This can be done in two ways.
The first is to view the entire code with the eyes and try to find such instructions. I even tried it for the sake of interest and spent about 7 minutes, as a result I even found two such instructions, which are not rubbish. However, as it turned out later, I missed one between them, and even after the second one I found, I somehow got sick of looking further - too tedious.
Therefore, let's go the second way, and write a small script that will help remove all the garbage and leave only the payload.
The script itself is located in the archive that goes with the article along the following path: ". \ Scripts \ fill_trash_by_nop.txt".
To run it, the OllyScript plugin must be installed.
The script runs like this: you need to restart the keygenme in the debugger and wait for the first BP to be triggered inside NTDLL, then select “ODbgScript-> Run Script ...” in the “Plugins” menu, select the script file in the dialog (the path is above) and run him.
As soon as the script starts its work, you can go to make yourself some tea, you will have five minutes of free time.
The logic of the script is simple:
Since the garbage instructions do not change the register values (except for EIP), the garbage instruction is detected by checking the state of the registers before and after its execution, if the registers have changed - the instruction performs something useful, otherwise the instruction is considered garbage and the NOP is placed instead.
When the script completes its work and displays a message, you can view the results of its work (do not stop the debugger itself - it is still needed).

All the garbage will be replaced by NOP and we will only have the following instructions (we need to go from 4053B6 to 406839 and write everything that is not NOP into a notebook):
The first two lines will be some garbage (zero-delayed sleep is called).
Well, more precisely, how - this is not exactly garbage, this line causes the bootloader to load kernel32.dll into the process address space, paired with the already loaded ntdll.dll, when the process starts; This library is declared in the keygenme import table (just as one single function sleep).
Next comes the decryptor code itself:
and direct transition to OEP on which the debugger is currently stopped.
Roughly speaking, if you look at the decryptor's instructions, the keygenme body is decrypted by this simple algorithm:
Now, in order not to wait for the file decryption each time, you need to dump the result (the OllyDump plugin must be installed).
To do this, you need to switch to OEP (“Ctrl + G” 401000) and place a breakpoint there, and then continue with the program.
As soon as the debugger stops at the installed BP, go to the “Plugins” menu, there we select “OllyDump-> Dump debugged process”, this dialog will open:

Focusing on the “Virtual Offset” column, set the code base to 1000, and the database to 7000, remove the “Rebuil import” checkbox and press the “Dump” button.
In the dialog that appears, specify the new name "keygen_unpacked.exe".
Actually everything - so we took off the first envelope.
A little trick:
In general, it was possible to dump more easily, without considering the source code of the decryptor and other things, but since I decided to look at everything thoroughly, therefore I also had to stop at it.
The second unpacking option is as follows.
1. Run the debugger and wait for the first BP to fire inside NTDLL.
2. Go to the tab of the memory card "Alt + M" and at the address 401000 put MBP on the record:

3. We start the program for execution as soon as we have interrupted for a write operation (this will be the STOS DWORD instruction), go back to the memory card and remove the MBP, then go to the OEP (401000) and set the usual breakpoint there.
4. Well, as soon as we stop on it - you need to perform the steps already described on the dump of the process.
By the way, if you want, you can check the resulting file under PEiD, the entropy magically became 6.95 - but all just decrypted the data block.
Now we will work with the already unpacked file.
Since the entry point in it is set correctly, in order not to make extra gestures, you need to configure Olly to make the first stop not in NTDLL, but directly at the entry point.
Open OllyDebug, go to the "Options" menu, select "Debugging options" and on the "Events" tab set the checkbox "Make first pause at: -> Entry point of main module".
Open the keygenme_unpacked.exe and see what the previously encrypted code has become:

We immediately see the first “trouble”, the first CALL call goes inside itself (the address 401004 is called, while the next instruction starts only with 4010005).
I have already talked about such jumps earlier in this article: “We study the debugger, part two”
The essence of such a trick is to confuse the disassembler and make it display the wrong code that will be executed in reality. There is nothing wrong with such a “trick”, just press F7 performing this CALL and immediately see the correct code:

You can once again dump the process + remove the POP EBX instruction to turn off such a “focus”, but since it will not interfere - let's leave it as it is and start analyzing.
First comes a block of five instructions that reads some data from the PEB (Process Environment Block), whose address is always located in FS: [$ 30].
If you open the PEB structure and see what the offsets shown in the code mean, you’ll get something like this:
Thus, these five instructions look for hInstance "kernel32.dll", which will be located at this address, though under Vista and above, this address will be located hInstance "kernelbase.dll" and this will be associated with one nasty error.
The LEA ESI instruction, places in ESI a pointer to a small array of Ansi strings located at 004012DE. These are three strings separated by zeros: "LoadLibraryA", "ExitProcess", and "VirtualAlloc".
By the way, I completely forgot to mention this earlier, if you look at the keygenme.exe import table, you will see that it imports one single function kernel32.sleep, the rest are missing. This means that the addresses of the others necessary for the work, the application should find by itself.
The following instruction, LEA EDI, places in EDI a pointer to a buffer that will contain the addresses of the functions found (this will be a virtual import table for kernel32), after which the procedure is called at 401198.
In fact, both LEA EDI / ESI calls are garbage, because These registers will be reset when you call the procedure at 401198, but they will be used in it exactly as I described above (EDI, more precisely EBP + 305, will eventually contain the addresses of functions).
In short, the task of procedure 401198 is to prepare an ESI register in which a pointer to the name of the function sought is placed, as well as an EDI register in which a pointer is placed to the library's export table, the hInstance of which we received by reading the data from PEB,
then call the function at 4011E2, which will search by name.

And here we are waiting for the second trouble, much more serious than the trick with CALL at the very beginning.
The very first one will be searched for "LoadLibraryA", which "kernelbase.dll" does not export.
This means that under Windows Vista and above, this keygenme will not work and will fall at the start.
You can check, the exception will rise here:
To get around this is quite simple, just after starting the keygenme, put the BP on the instruction:
those. immediately after receiving the library loading address, and changing the value in the EAX register to the hInstance of the library “kernel32.dll” (the correct address can be found in the memory card of the Alt + M process).
After such manipulations, the keygenme will start as normal.
In order not to do this every time the application starts, it will be enough to run the script from the folder ". \ Scripts \ run_at_vista.txt", which will automatically replace the EAX value with the correct one each time and start the program without errors.
Now it's time to see how the login and serial numbers are read into the application memory and what modifications are made on them.
Usually, reading data from EDIT occurs through the function "GetWindowsText" or "GetDlgItemText", but since in the end, the second function still calls the first one, then we will set the breakpoint on “GetWindowsText”.
To do this, after the keygenme was launched (and the user32.dll library was also loaded) and its dialog box appeared, go to the debugger and look for all available functions in all modules:

In the dialog that appears, look for the name of the exported function “GetWindowsTextA”, and in the menu select the item “Follow in Disassembler”:

After that, we put the BP, go to the dialogue with the keygenme and enter the “Ms-Rem” login and the serial number “C38FB7A0CF38F73B1159” into the corresponding fields.

Click the "Check" button and ... stop at the breakpoint inside user32 just at the beginning of the "GetWindowsTextA" function.
Now you need to return to the place of her call.
Click:
1. Ctrl + Shift + F9 - jumping to the end of the function “GetWindowsTextA”
2. F8 - go up to the function “GetDlgItemText”
3. Ctrl + Shift + F9 - jumping to the end of the function “GetDlgItemText”
4. F8 - go up to the place of the call

The blue frame contains the “GetDlgItemText” call just made, with the following parameters:
hDlg = ESI
nIDDlgItem = 65
lpString = EAX
nMaxCount = $ 10
We read the login value to the buffer pointed to by the EAX register, 16 bytes in size, and in the red frame the call to read the serial number to the buffer pointed to by EDI (EBP + 414E) 32 bytes would be highlighted.
The most interesting begins immediately after reading the serial number.
It is followed by an interesting cycle of 10 iterations, while the ESI register points to the buffer with the serial number just read, and EDI to the buffer where the result is placed:
Those. Over the serial number in the function 40117B, some transformations are performed, the result of which is placed in EDI.
This function is as follows:

This is something like converting two characters from a string HEX representation to a byte.
If roughly this is an analogue of Result: = StrToInt ('$' + Value);
Take for example the original known serial number: "C38FB7A0CF38F73B1159"
After 10 iterations, it will be converted to an array with the following contents:
But since the function does not check for boundaries beyond which HEX values should not be in string format, that is, a very large range of acceptable values, which after such a reduction will give the same number.
For example, that "C3" that "s1" as a result of this conversion will be equal to 195 (or $ C3). Therefore, this will also be quite a valid serial number: " s1 8FB7A0CF38F73B1159".
Thus, we conclude: the entered login is read as is, and the serial number after reading is converted to a byte representation, and, since There are only 10 iterations, the length of the serial number should not exceed 20 HEX characters (the rest will not be taken into account).
In principle, this is all the information that we need, now it's time to look at the keygenme source code from a slightly different angle.
Launch IDA Pro and open keygenme_unpacked.exe in it, right after opening we go to the tab “Functions”.
Only 8 pieces:
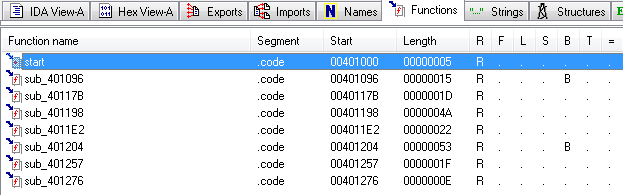
And almost all of us are known:
401,000 is OEP, not interested
401096 - and this seems to be the original entry point, which was before any encryption and creation of virtual IATs hung there, but, by the way, we no longer need it.

40117B is HexToInt, saw ...
401198 - filling virtual IAT, saw ...
4011E2 - search function address by name, saw ...
sub_401204 - something interesting (judging by the graph), perhaps we will begin with it, by the way, it calls the two remaining functions sub_401257 and sub_401276.
And the calls to the reading functions from EDITs at 004010F5 and 00401107, as well as the cycle at 00401111, were not recognized by IDA as procedures due to garbage instructions going before them (and not so important).
So, look at the function graph sub_401204:

Have you ever seen what a VM graph looks like in IDA?
If not, then look - this is the body of the virtual machine, and it is quite simple.
What is a virtual machine?
Roughly ... a normal processor performs a set of instructions known to it (machine code that can be disassembled).
A virtual machine is essentially also a processor, only it executes its own set of instructions that are generated and placed somewhere in the available memory in the form of a so-called P-Code.
It is not at all necessary that these instructions will coincide with those that the real processor can execute (more precisely, on the contrary - in most cases they will not be the same).
In the process of protection, commercial protectors disassemble the protected code blocks, generate their own virtual machine for each of them with a unique logic set and instruction set, translate the disassembled code into a picode that a particular virtual machine can execute and save the result as a buffer somewhere in the body applications. Each VM, when receiving control during the execution of a program, sequentially reads the instructions of the picode intended only for it, and executes them.
Thus, the attacker hides the logic of the protected algorithm, which he could disassemble under the debugger.After such modifications, it will be necessary to first analyze each VM, and only after its complete analysis, the algorithm will be pulled out of the picode performed by it, transforming it back into a machine code understandable to the ordinary processor. The job is still ...
In the picture above, we see just one of the implementations of VM, which can execute only 8 instructions known to it.
Let's take a closer look:

Everything starts with the initialization of the EBX register, which indicates the beginning of the buffer with the picode for the virtual machine, as well as the EAX register, which is the cursor (index of the instruction being executed).
VM operation begins with the procedure loc_40120D.
Its task is to first obtain the opcode of the instruction being executed, by calling the function sub_401276, the code of which is given in the hint.
Judging by this code, it can be understood that the picode itself is also encrypted and immediately after reading each byte, its decrypt occurs approximately like this:
After receiving the opcode, it is checked, if it is zero, then control is transferred here:

Where a unit is simply added to some variable (let's call it arg_4 as it is),
and as a result, further control is transferred to the finalizing block, which starts the execution of the next opcode, incrementing the EAX register.

And in it we can find out the total size of the picode, it is equal to $ 3DA2 (15778 bytes).
So, let's sort all the instructions in order:
0. (loc_4012CA): increases the value of the variable "arg_4"
1. (loc_4012C5): decreases the value of the variable "arg_4"
2. (loc_4012BE): increases the value pointed to by "arg_4"
3. ( loc_4012B7): decreases the value pointed to by arg_4
4. (loc_4012A8): puts the value pointed to by arg_4 in memory pointed to by arg_8, then increases the value of the variable arg_8
5 (loc_401299) :. puts the value pointed to by "arg_" in memory pointed to by "arg_4", and then increases the value of the variable "arg_"
6. (loc_401284): checks the value pointed to by “arg_4”, and if it is zero, runs the procedure “sub_401257” passing the value 1 to the EDX
7. (0040123E): checks the value pointed to by “arg_4” and if it is not zero, runs the “sub_401257” procedure, passing the value -1 to the EDX
. In the “sub_401257” procedure, the following occurs, EDX is the direction of the picode scanning, in the case of a positive value, opcode number 7 is searched, corresponding to opcode number 6 with regard to nesting (t. that is, if they go 066770, then when calling from the first opcode 6, the EAX cursor is set to zero, and when called from the second opcode 6, EAX will point to the second seven).
And if EDX = -1, then the scan goes in the opposite direction, taking into account the nesting.
That's actually the whole VM.
Nothing like?
Yeah - that's Brainfuck itself, as it is.
http://ru.wikipedia.org/wiki/Brainfuck
Those.it turns out that inside the keygenme is an encrypted P-Code, which must be executed on the Brainfuck interpreter, which actually acts as a virtual machine (well, why not?)
By the way, if you pay attention to the description of BF in Wikipedia and the implementation of handlers in this variant of the interpreter, you will see that the fourth and fifth opcodes (read and write) are interchanged.
Well, if so, all that is left for us is to pull out the picode itself from the keygenme body and the keygenme is no longer needed, then we ourselves.
In order to determine the location of the buffer with the picode, put the BP at the beginning of the VM and look at the address with which EBX is initialized.
We launch OllyDebug and put BP on address 401208 in it.

After BP triggers, we look at the EBX value, this is the address 401380.
Go to it in the dump window and look at the HEX values, the first 8 bytes are equal to "CE44 4E53101708DD".
Now open the keygenme_unpacked.exe in any HEX editor and look for these 8 bytes.
VM size, as we found earlier 15778 bytes.
Copy 15778 bytes starting from those found in the “vm.mem” file.
Great, now we have the P-Code of the virtual machine, which we have a long and hard work to do, and we no longer need the keygenme along with OllyDebug and IDA Pro, they have done their job.
PS: already copied file "vm.mem" is available in the archive with examples for the article and is located in the folder ". \ Data \ vm.mem".
By the way.
In the process of reading the article, I was pointed out at such a moment: in a real combat application, the number of functions will be several orders of magnitude larger, and how, in this case, determine the body of the virtual machine?
In this situation, it will be sufficient to set the BP to read external data (login and serial number), from which it will be easy enough to track the transition to one of the virtual machine handlers, or perform the same actions with the output buffer (after all, VM must do something and have interaction with the external environment).
But all this, of course, depends on the specific implementation of the VM and this approach is not always applicable.
To begin with, we decode the resulting “vm.mem” into a normal representation like this:
You get the file "vm.brainfuck" containing the BF code in the form in which it is usually recorded, and here it is already taken into account that the instructions "." and "," mixed up in places.
In principle, this file can already be fed to any BF interpreter, and if you slip the correct buffer with a login and serial number, it will even be executed.
By the way about the buffer with the login and serial number - I completely forgot to mention it. It enters the virtual machine as a block of 20 bytes, where the first 10 bytes are filled with login characters (if the login is less than 10 bytes, the remaining bytes are zero), and immediately after them there are 10 bytes of the serial number converted from the string HEX representation to byte.
Those.for the “Ms-Rem” and “C38FB7A0CF38F73B1159” known to us, the buffer will be like this:
('M', 's', '-', 'R', 'e', 'm', 0, 0, 0, 0, $ C3, $ 8F, $ B7, $ A0, $ CF, $ 38, $ F7, $ 3B, $ 11, $ 59)
This could be seen when starting the virtual machine under the debugger by looking at the data located at the address pointed to by the variable " arg_C.
The BF interpreter requires a buffer of 300,000 bytes (according to the conditions described in the wiki), but in fact this version of the code uses only 221 bytes out of 300,000. We
actually write the code.
It remains only to run it all:
Run and look at the result:

Well, it seems everything is done correctly and works as it should.
(The source code of the interpreter in the archive with examples '. \ Tools \ bf_execute \')
Thus - the second envelope is removed.
But now what do we do with all this?
It is impossible to analyze the picode head-on - there are no tools, the only thing that can be peeped are the numbers of the cells in which the login and password are entered and from which the result is derived.
We put BP on reading and writing procedures and see what
happens with us ... Nothing good, while the login and serial numbers are read, each byte is always read in cell number six of the working buffer.
The same happens with data output from the VM, the next character is also taken from cell number six.
The only thing that can somehow clarify the picture for us is a dump of the working buffer at the moment of data output, look at it:

Here at least it is clear that in the VM working buffer there is a login and password, as well as just below it two already prepared lines with “good message” and “bad”.
And in the sixth cell of the working buffer (the second from the right above), the prepared “C” character is already sitting from the displayed message “Congratulations !!! It is a valid serial! ”
This is such an ambush.
What is a decompiler?
In fact, it is a utility that converts a set of machine codes for the processor into a set of assembly instructions that the programmer understands. For each processor it will be its own assembler (32/64 / ARM, etc.). Well, the virtual machine (as mentioned earlier) has the same processor with its own set of instructions, expressed in the form of a picode.
The challenge now is to write a picode decompiler into a 32-bit assembler so that we can work somehow with the result, since we already have a tool for analysis, this is a debugger.
And the task is essentially simple, you do not need to take into account the prefixes, parse ModRM / SIB - just eight instructions, but first you need to figure out how it will look.
Disassembling into the forehead will not be a good idea, you need to collapse the blocks of repeating instructions of the pyode BF.
For example, we have a brainfuck script of the following type: ">>> +++ << ----"
Here you can go to the fourth cell, increase its value by three, go to the second and decrease its value by four.
If you disassemble into the forehead, you get something unintelligible:
It is much easier to minimize duplicate sets of instructions:
Input and output are assembled quite simply.
We only need to know where to read and where to display. Moreover, it is necessary to take into account that each time when reading or outputting data, it is necessary to shift the position in order not to read what has already been read or not to overwrite what has already been written.
There is only a variant with brackets.
The brackets in BF perform an analog of the while loop, i.e. until the cell is zero, the loop body is executed.
The opening bracket "[" is responsible for entering the loop body, for the transition to the next iteration, closing "]".
Those.roughly in the assembler, we need to provide two conditional transitions, one at the entrance to the cycle, one at the transition to the next iteration.
Before the heap, at least one more thing is needed, this is the address where you need to go if the condition for entering the loop failed, or if the condition for going to the next iteration of the loop was not met.
The next step is to figure out how to disassemble the cycles, taking into account the three jumps described above.
For example, there is such a picode:

More convenient for disassembling (at least for me) will be the removal of the loop body beyond the main code, like this:

If we approach this way, then from the disassembler you only need to know the beginning and end of each procedure and in a cycle to decompile the body of each one, inserting jumps into the internal cycles in the right places.
PS: True, right now I am looking at this picture and I understand that it probably shouldn't have been tolerated, because an extra jump has appeared, but ... laziness to rewrite.
Well, okay, now about the working buffer and input / output buffers: the ESI register will be used as a pointer to the working buffer, it will also be the cursor, i.e. on the operations ">" or "<" this particular register will increase or decrease.
A pointer to the buffer with the login and serial number will store the EBX register, and the output buffer will be responsible for the EDI register.
We write the code.
The decompiler will need a buffer with a picode and a small list in which the beginning and end of each While loop will be stored.
Next, we need several utilitarian procedures.
It remains to cycle through to decompile each While block:
And write the startup code for all of this:
(The source code of the decompiler in the archive with examples '. \ Tools \ bf_decompiler \')
Now you need to check its work on anything.
Take for example Hello World from a wiki with this content:
And let's see what it is being decompiled into:
Looks like. I agree, you can sub-optimize, but not the task.
Check how it will work and write a test:
See the result:

Well, not bad.
It turned out what was intended, now we decompile the body of the VM itself.
The output was 8153 lines of the purest assembler :)
(the result of VM decompilation in the archive with examples '. \ Data \ vm.inc')
But ... all the same, more than 8 thousand lines, with a swoop they can not be analyzed.
Need to write additional tools.
In the demo application settings, you need to enable the generation of the MAP file (in the Detailed mode), it will be useful to us in the next chapter.
In order to understand what exactly is happening in the decompiled code, it is necessary to build the execution trace. And there will be enough information about which blocks are executed and where the transition takes place from them.
The essence of the route is to build a directional graph, analyzing which logical branches in vector blocks can be stopped (roughly, in the form of a flowchart).
This will require a debugger: http://habrahabr.ru/post/178159/
In the process of building the route, the debugger will go step by step according to the code of the recipient, interrupting at the addresses that we can lead to the line number in the source code we previously generated.
To bring the address to the line number in the asm listing, you will need a small module that will parse the MAP file and return this information.
You will also need another module, which, by the line number in the asm listing, will return the name of the sub-procedure on which the stop occurred.
The source code of the last two modules will not be given - they are very simple, in any case, the code can be seen in the archive with examples for the article in the following way: '. \ Tools \ tracer \'.
You also need a class that will store the data about the shot track.
Roughly his whole task is to keep an array of records like this:
and provide methods for working with it.
Also very simple, you can see the code in the archive on the way: '. \ Tools \ common \ trace_data.pas'
The execution route will be shot in 4 passes in 4 different modes.
1. Full track program execution.
2. Partial trace, from one iteration of reading the buffer with login and serial number.
3. Partial trace from one iteration of output.
4. Detection of procedures in which cells with login and password are recorded.
A little later, the treser will have to be added, adding the fifth mode to it to completely remove the track, but removed from the de-example, in which the serial number will be dropped into a sequence of zeros (in the source code this mode will be called ttWrongSN).
But more about that later, but now ...
The implementation of the tracer is quite banal:
In short, in the full dump mode (ttFull) the second HBP will signify the completion of the trace process, the “ttIn, ttOut” modes will stop at the second HBP trigger (one I / O pass), and ttCheckLoginBuff will perform a trace using the MBP until the entire VM cycle will be executed.
The first one follows the branching of the transitions, and the second simply collects the names of the procedures from which the access to the buffer occurred, in which the login and the serial number are located.
As a result of the work of the tracer, we will have 4 files on the basis of which we can fairly easily analyze all the work of the VM, but ...
But for this, you need to somehow display the data in the form in which you can work with them ...
IDA Pro is an excellent tool, the graphs issued by it are very helpful in the process of analyzing the source code, but ... but it is not universal.
In particular, with the graph of the decompiled VM code built by IDA, it is not very convenient to work in this case.
That is why I went to personally removing the track (described in the last chapter) and writing a tool to visualize it.
The essence of the tool is as follows:
1. turn the software execution trace into the graph being visualized
2. display the logical execution blocks in the column
3. as a result, show block addresses interesting for code analysis.
The very first stage is the conversion of data from the tracer into a directed graph.
It is built quite simply - we take the current block and recursively build outgoing transitions from it. The main thing to forget about while cycles, where the transition at the end of the procedure to its beginning, will be directed to the already added element.
Therefore, when constructing a graph, it is necessary for each element to add a custom property in which the graph node will be stored, to which a link should be placed at the first call.
Analyzing the BF code, the following conclusions can be made:
1. In each of the while cycles there can be only 2 inputs (from the external code block and the transition from the end of the cycle).
2. The end of each while cycle has only 2 exits (if the cycle is completed go to a higher level by code, otherwise return to the beginning of the cycle).
3. From the body of the block while there may be a multiple number of outputs, provided there are ifthen blocks in its body (but this is not our case).
The code convolution means the following:
1. If the procedure has one input and one output (according to the trace results), then it is added to the current convolution block.
2. The beginning of each convolution block will be any procedure that has two inputs (while loop).
3. The end of the convolution block will be a transition to an already added code (end of while) or any other block of code that, according to the results of the route, has two outputs (which implies the same end of the cycle, based on the previous item 3).
The result of processing the trace of the decompiled code (in which there are no complicated cases in the form of multiple outputs from while) will be the following picture:

It displays the program execution trace, with minimized execution blocks.
Do not pay attention to the fact that everything is so beautifully arranged in vertical columns - I did not write an algorithm for this arrangement and everything was trivially scattered with pens (for it is much faster than writing the same visualization engine as with IDA.
I will not give the source code of this utility , you can see it in the archive ". \ tools \ trace_viewer \".
Its main task is to give a starting point from which you can push off when analyzing the VM code.
And here are two pictures that show part of the logic of the work.
This is what happens when reading the login and serial number:

But these procedures are performed when displaying the result:

Pay attention to the execution of procedures in the center of the scheme, they are a hardware and do not participate in the logic of the algorithm hidden in the VM.
Immediately make a reservation - this conclusion was made in the process of researching the code.
Initially, having received such two pictures on my hands, I was a little puzzled and suggested that there could be another mini-VM hiding inside (a green vertical block from the bottom left) that spreads logic based on my own instructions, but ... the assumption turned out to be wrong.
And so, judging by the pictures we have on hand:
1. The upper left block of the diagram is the reading of data.
2. Lower right - output result.
3. The central branch is a kind of matapparat (as a result, it’s not even necessary to analyze it).
All that is not highlighted in green and there is a third envelope (hidden under VM logic).
Those who will study the source code of this viewer apologize in advance - the tool code is very raw and was written literally on the knee in two nights, so the utility does not have much functionality. It only knows how to display the graph itself, provides a mechanism for modifying it (read, you can move blocks as it will be more convenient).
ZOOM mode is not added, for this there is a separate button that generates a general preview (from which the screenshots were taken).
But the role of the graph analysis tool is not bad.
In the archive with the article there is an already placed graph ('. \ Data \ current.graph') which was obtained from the route taken in the previous chapter ('. \ Data \ full.trace').
However ... to our sheep.
The tool for analyzing the decompiled VM code is ready, let's proceed directly to its analysis ...
Having started the VM analysis, I already had some idea of what I would have to work with.
Relying on the memory card with which the VM is running (shown in Chapter 7), I knew the offsets for which the “correct” and “incorrect” lines with the results are located, as well as the offset for which the buffer with the login and serial number is located.
Knowing how the BF interpreter works, I even figured out an approximate algorithm for working with data, taking into account the fact that certain operations should be performed on login and SN.
For example, if you want to add two Z and X fields, then there is no addition operation in Brainfuck, for this you will need to write a while loop in which the value of cell X will be iteratively decremented and the value of cell Y will be incremented.
Thus, cell Y will contain the sum of both cells, and cell X will be reset.
But at data output, as shown above, one can observe that the buffer with the login and serial number is where it should be and none of its fields are changed. So in the VM, some other approach is used to read the data.
A strange nuance to which I immediately noticed that the login, the serial number, the “correct” and “not correct” lines in the memory card are not as they are, and each byte is separated from the next by zero. It feels like we are working with unicode, although in reality the work goes with ANSI strings.
These two points were not clear to me.
However, it is still necessary to start with something, and I decided to start analyzing the algorithm from its end, assuming that the decision on outputting the result is made here with such a block of procedures (where the result is displayed):

Moreover, the graph shows this block as one function with one entry point and one exit.
(By the way, the assumption that a decision is made in this block, in the end, turned out to be wrong).
For debugging, I used the CPU-View mode directly by Delphi itself (this turned out to be sufficient for the eyes).
The debugged application was “decompiled_vm_text.exe” from which the execution trail was shot.
Three variables were added to the Watch List as auxiliary prompts:
1. The current value of the working buffer cursor (ESI register), which was calculated by the difference from the start address of the working buffer (pWorkBuff) and the current register value. (esi- $ 4E5008)
2. The value of the current pWorkBuff cell (pbyte (esi) ^)
3. It is the same in HEX mode only.
4. The dump window was tuned to the beginning of the VM working buffer ($ 4E5008).
PS: you have the address of the working buffer may be different, so the number 4E5008 you must calculate in advance at the start of debugging, by looking at this value in the variable pWorkBuff.
Thus, the configured debugger stopped at the beginning of the "@ vm_code_39D7" procedure looked like this:

Actually with this procedure and begin.
If you pay attention to the graph image, this is the very first procedure in the minimized execution block that calls itself (while loop).
At the time of calling this procedure, the working buffer cursor is set to cell number 27 (in the picture with the memory card highlighted in red), which contains a certain number (40 or $ 28). This cell is located just before the buffer with the login and serial number (located on the offset 28, which stores the first character of the login - "M").
Remember the number of this cell - it is one of the central elements of the VM logic.
Let's see the source code of the minimized block:
Here I built the execution blocks in the order of their execution (not in the form in which they go in the source code) in order to make it easier to analyze the logic from the work.
So what is going on here?
This algorithm initializes zeros (which separate each element of the login / serial number, as well as the "bad" and "good" lines) with units.
If you stop at the finalization of the cycle and look at the result, you can see this picture:

Cell 27 will be reset to zero, but as a result you can see that the buffer will be initialized to units ending just before the first VM output with the “good string” character, namely the “C” character.
Notice how interesting are the transitions to the beginning and end of the data being changed (the @ vm_code_39D8 and @ vm_code_39DD procedures). The detection of the end blocks is used to verify the current cell value with zero, the leftmost zero will indicate the position of cell 27 (with a shift), and the rightmost zero will indicate the cell that has not yet been initialized.
Thus, the essence of this block is reduced to the construction of an index (in the form of units) to a cell with which the next while cycle will start, starting with the @ vm_code_39EB procedure.
It will begin its work from the cell to which the last unit of the previously built index points, namely from cell No. 108, where the “C” symbol (highlighted in blue) is located, which the VM should now output to the external buffer.
Before calling this procedure, VM managed to perform some preparatory actions, one of which was the initialization of cell No. 27 by a unit, thus. The leftmost cell to which the search algorithm of the left end of the index will go from now on will be cell No. 26.
So:
The logic of the second cycle is as follows: it transfers the value of cell No. 108 to cells number 26 and number 6 (note that this is the sixth cell from which the character is taken, which I indicated in the seventh chapter).
And in fact, the logic of working with data already begins to emerge (when reading a value, a value is duplicated at two addresses).
The memory card starts to look like this:

The green rectangles indicate the places with which the changes occurred, the red cell highlighted number 108 from which the value was taken.
The next while loop in the graph begins with the procedure "@ vm_code_3A2A".
He will begin his work from cell number 26, which stores a copy of the number previously placed in cell number 108.
The code looks like this:
The task of this code is to move the value of the jar of cell No. 26 back to cell No. 108, thus restoring the original value of the cell with which the algorithm began its work.
Let's look at the memory card after the algorithm works:

And the final step in this slightly confusing logic of working with cells will be the final, located in the procedure "@ vm_code_3A41".
It is quite simple:
Its whole task is to start work from the most recent cell equal to one (by means of which the index is built) and remove all units of the index.
The result of her work is such a map:

The green fields are the index fields that were removed by the last procedure, and the red one is the result of the work of all four rolled blocks.
Confused?
Nothing strange, but if you look closely at the most recent picture, you can understand that all this fancy logic from the four stages essentially performs one simple operation.
And this operation is the assignment of the value of cell “A” to cell “B”.
Moreover, the algorithm is quite flexible and thus allows you to read the value of any login / serial number symbol or “good / bad” lines; to do this, it is enough to initialize cell No. 27 with the symbol number and perform all four steps described above.
A beautiful approach - you will not say anything, the logic of working with cells is fairly solidly smeared, although there is a small nuance.
Having understood how the cell value is obtained and having the execution graph in hand, it will take an hour and a half to analyze all the logic of the work from this moment on.
The rest of the procedures from the top picture with the graph does not make sense to consider, there is some internal hardware necessary for the VM to work, there are frankly garbage pieces of code (for example, changing the value of two / three cells in places and returning everything to its original state in the cycle) .
Thus, it turned out that the cell value is obtained by performing three cycles, which can be clearly seen on the graph and the final block of finalization, which removes the array of indices immediately after the end of the third cycle.
Here in this picture I immediately selected them with red rectangles and repelled from this image throughout the entire VM logic parsing:

The two blue rectangles also highlight the reading cycles of the cell value, but since they read the values of the characters Login [0] and Login [1] (I learned this after analyzing all the cycles of the algorithm), then an index array of ones is not built in these two cases, the first cycle reads the value in cells 26 and 6, and in the second, the value from cell # 26 is returned.
The picture is not quite clearly visible (affects the zoom), to make it more clear, here is the second option, which shows the principle by which I circled the blocks with rectangles:

To check my guess, I checked myself and displayed on the graph the blocks in which the login and serial number fields change (the button “Show access to the buffer with login and SN”). For this button, the viewer will load the list of such procedures, created earlier by the tracer in ttCheckLoginBuff mode and show just such a picture:

Everything was as it was supposed in the previous image, the block from the left above is only knocked out of logic (circled by a blue rectangle), this is a piece of code that reads the values of the login and serial number from the external buffer, so it is not surprising that changes in these fields occur in it.
Here I concluded that apparently each of the vertical blocks is one of the stages of checking the serial number (the assumption also turned out to be true).
The next step was interesting to me, and where the decision on the correctness of the serial number is generally made, for this I reassembled the example “decompiled_vm_text.exe” in which I changed the value of the serial number to zero, and again took the track in ttWrongSN mode.
After all these steps, I looked at the differences of the route (the button “Show differences of the route with the wrong SN”) as a result saw the following:

You could say bingo.
At the very first operation (right vertical block), an exit occurred, and not all the procedures were completed (the block marked in red). So it is in it that the decision is made on the results of the first operation on the buffer with the login and serial number.
More precisely, there will be several such blocks in the end, for each operation it’s different, but you don’t have to disassemble their operation logic, since the meaning of all operations will be fairly transparent.
The next step I put breakpoints in the debugger at the beginning of each vertical block (which I had previously marked with rectangles), in order to understand in what order the operations are performed.
It turned out this list:
Remaining, focusing on the graph, just go through all the selected places (skipping the already known elements of logic in which the login / SN symbol is taken) and analyze what operations are performed on these symbols.
I will not give ranges of procedures in which an index is created, a value is read, a value is returned and the index is removed. For simplicity, I will only show the name of the procedure of the first cycle (in which the construction of an index array of ones takes place).
Let us proceed to the analysis of logic:
1. vm_code_17AB
1.1 vm_code_1815 - read the value of SN [0] in cell # 6
1.2 vm_code_17AB_1880 add to cell # 6 the number 12
1.3 vm_code_1903 - read the value of SN [4] in cell # 7
As a result, the same number will be obtained in both cells (6, 7), thus we conclude that the first mathematical operation performs the following check: SN [4] = SN [0] + 12
2. vm_code_1A63
2.1 vm_code_1AD4 - read the value SN [0] in cell No. 6
2.2 vm_code_1B58 this value is transferred to cell No. 7
2.3 vm_code_1BC8 - read the value of SN [3] in cell No. 6
2.4 vm_code_1C4C value of cell No. 6 is added to cell No. 7 (result in 7)
2.5 vm_code_1A63_1C5A - cell №7 increased by the number 84
2.6 vm_code_1D12 - read SN [2] to the cell №6
As a result, both cells (6, 7) is obtained one and the same numbers, thereby de amu conclusion that the second mathematical operation produces the following test: SN [2] = SN [0] + SN [3] + 84
3. vm_code_1E74
3.1 vm_code_1EE8 - read the Login [0] value in cell # 6
3.2 vm_code_1F5B - transfer the value from 6 to 7 cell
3.3 vm_code_1FDD - read the Login value [1] in cell # 6
3.4 vm_code_204D - cell value # 6 is summed with cell No. 7 (result in 7)
3.5 vm_code_20CB - read the value of SN [4] in cell # 6
3.6 vm_code_214F - the value of cell # 6 is added to cell # 7 (result in 7)
3.7 vm_code_21C3 - read the value of SN [1] in cell # 8
as a result, in both cells (7, 8) one and the same number will be obtained, thus we conclude that the third mathematical operation performs the following check: SN [1] = Login [0] + Login [1] + SN [4]
4 . v m_code_2333
4.1 vm_code_239B - read the Login value [8] to cell # 7
4.2 vm_code_2493 - read the Login value [4] to cell # 6
4.3 vm_code_2517 - cell No. 6 value is added to cell # 7 (result in 7)
4.4 vm_code_2586 - read the Login value [ 2] in cell No. 6
4.5 vm_code_260A - the value of cell No. 6 is subtracted from cell No. 7 (the result is 7)
4.6 vm_code_2689 - we read the value of SN [5] in cell No. 6
As a result, in both cells (6, 7) we get the same -zhe number, so we conclude that the fourth mathematical operation produces the following test: SN [5] = Login [8] + Login [4] - Login [2]
5. vm_code_28DA - loop 10 pass all the symbols lo ins and summarize them with a cell №7
Roughly as a result of the fifth mathematical operation, the following code is executed:
The sum of all login symbols will remain in cell number 7
6. vm_code_2AF3
6.1 vm_code_2bc5 — read SN value [8] in cell No. 6
As a result, the same number will be obtained in both cells (6, 7), thus we conclude that the sixth mathematical operation produces the following check: SN [8] = Tmp (sum of all login numbers)
7. vm_code_2D27
7.1 vm_code_2D27_2D29 - 72
7.2 vm_code_2DD5 is added to cell # 7 ; we read the value of SN [9] in cell # 8
As a result, in both cells ( 7, 8) we get the same number, so we conclude that the seventh mathematical operation produces the following check: SN [9] = Tmp (sum of all login numbers) + 72
8. vm_code_2F41(at the moment of calling this procedure, the sum of the login numbers will be in cell No. 18)
8.1 vm_code_2FA1 - read the value of SN [6] in cell No. 6
8.2 vm_code_2F41_300C - cell No. 6 is increased by the number 51
8.3 vm_code_3071_307D + vm_code_308B toss Tmp in cell No. 7
8 vm_code_30AA - the value of cell No. 7 is added to cell No. 6 (the result is 6)
8.5 vm_code_311D - we read the value of SN [7] in cell No. 7
As a result, the same number will be obtained in both cells (6, 7), thus we do the conclusion that the eighth mathematical operation makes the following check: SN [7] = SN [6] + 51 + Tmp
That's actually the whole algorithm hidden in video Rtualnoy machine, in full view.
Well ... almost all, the last third envelope is removed.
Left just a little bit.
In the keygenme task, the condition went on - it is necessary to zakigenit write an algorithm that will generate a serial number based on the entered login.
Having on hand the algorithm for checking the serial number to do it is quite trivial.
If you look at the fields of the serial number, you can see that SN [0], SN [3] and SN [6] are not checked, they only participate in checking the values of other fields. Therefore, these three fields can contain absolutely any values, and the remaining fields will be calculated on their basis.
As a result, here is a small list of serial numbers for the login "Rouse_":
Keygenme resolved.
Let’s go through the stages again and remember which methods were used to hide the serial number check algorithm:
1. Resetting the entry point to zero is a controversial method, moreover, antiviruses will be looked at with suspicion because the usual ones the compiler will never generate such an executable file, it means that someone has modified it, which is a signal for the antivirus.
2. Encryption of the body of an executable file is not in principle punishable, but as was shown above, such encryption is removed quite simply and does not constitute a serious obstacle.
3. The decryptor code abundantly diluted with garbage is a controversial decision; it is rather simply removed due to the fact that garbage blocks were not used as garbage. Well, for example, instead of the ADD EAX, 2 instruction, you can write such a garbage block (the first thing that came to mind):
Such a garbage unit is no longer removed on the machine with a script that detects the absence of changes in the registers, since each instruction in reality will change their meaning.
If it is well podshamanit over such a block and inflated to a large size, then it will be quite difficult to determine the beginning and end of the garbage. Moreover, there is always a stack available, retaining the value of registers on it can, as garbage, even prove Fermat's theorem until you get bored, and then just restore the values of the registers and continue the program :)
4. Virtual machine - due to unprotected handlers (VM instruction handlers) to write its equivalent did not take much time. For good in the combat application, the VM handlers must be qualitatively obfuscated in order to make it difficult to understand the logic of the VM operation. It is clear that for keygenme this stage is superfluous, but one should not forget about such subtlety.
5. The logic of the P-Code operation - despite the presence of clearly garbage instructions, the basic algorithm for receiving data from the buffer with login / SN turned out to be the same at all stages, which made it possible to quickly disassemble all the logic based on the template. If several variants of data acquisition were introduced (and a unique variant for obtaining each symbol would be better), this would greatly complicate the analysis.
6. VM analysis would be complicated at times if inside the P-Code there was another virtual machine (say, based on the same Brainfuck) that would interpret its own P-Code.
What is the result:
A very high-quality keygenme, perfectly showing the work with the virtual machine. The only nuance to which he does not give an answer is how the P-Code was obtained for the virtual machine that it executes :)
This stage is individual for each developer, each one uses his own methods, however, I have an article on the implementation of the picode generation algorithm , true for a slightly different type of VM.
For my part, I showed one of the options for hacking such VMs, without the deobfuscation stage of an acm listing, using VM execution graphs as a toolkit.
I think it will be able to help you in analyzing your own VM implementations for their resistance to this hacking option.
Well, if you have not yet come to the actual implementation of the VM, at least now you have a minimal idea of how it can work.
The source code of demos for an article can be collected at this link: http://rouse.drkb.ru/blog/vm_analize.zip
Draw conclusions and good luck.
Unfortunately, the article will be hard enough for an ordinary application programmer who is not interested in software protection, but there's nothing to be done about it.
For more or less adequate perception of the article will require minimal knowledge of the assembler (there will be a lot of it) as well as skills in working with a debugger.
')
But those who hope that some simple steps to implement this type of protection will be given here will have to be disappointed. The article will consider the already implemented functionality, but ... in terms of its hacking and the full reverse of the algorithm.
The main goals that I set for myself are to give a general idea of how such software protection works, but the most important thing is how a person who will remove your protection will approach this, because there is an old rule - you cannot implement a competent protection kernel algorithm imagining the methods of its analysis and hacking.
As a recipient, on the advice of one sufficiently competent comrade, I chose a slightly old (but not lost in actuality, due to the quality of performance) keygenme from the notorious Ms-Rem.
Here is the original link where it appeared: http://exelab.ru/f/index.php?action=vthread&forum=1&topic=4732
And then he got here: http://www.crackmes.de/users/ms_rem/keygenme_by_ms_rem/
Where this keygenme was set to 8 out of 10 (* VERY VERY * hard).
Although, to be honest, this is a slightly overestimation - I would put in the area of 5-6 points.
Perhaps we will begin.
0. Requirements
For good, for the full debugging of this keygenme, the most convenient platform will be Windows XP 32 bits, it is generally the most optimal environment, therefore I am constantly deployed on my workstation as a virtual machine.
Under Windows 7 - 32 bits (on which debugging was actually done in the process of writing this article) will be a little difficult, but they can be solved (this will be mentioned in the fourth chapter of the article).
Serious difficulties will begin on 64-bit OC due to the fact that the tool used as the main tool (OllyDebug) when debugging this Keygenme will produce errors even at the stage of the loader operation. OllyDebug version 2 will not spit out these errors, but there is one more difficulty, for it there are no necessary plug-ins yet (or maybe I’ve been looking badly).
The keygenme itself must be downloaded from this link: http://exelab.ru/f/files/3635_03.05.2006_CRACKLAB.rU.tgz (registration will be required).
To complete the work with the text of the article, if you decide to go through all the steps described in it, you will need a small set of tools.
I will not describe here in detail about them, all that needs to be done is described in the file “used_tools.txt” located in the root of the archive with examples for the article: http://rouse.drkb.ru/blog/vm_analize.zip
It is also necessary to remember the correct pair of login and serial numbers provided by the very first link, namely “Ms-Rem” and “C38FB7A0CF38F73B1159”. These data will greatly help in the process of parsing keygenme.
Once everything is set, you can begin.
1. Initial analysis
For a start it is worth deciding what we are dealing with.
Start PEiD and open keygenme.exe in it.
Press the rightmost bottom button and select the “Hardcore Scan” type in the menu.
The trouble starts right away, firstly the entry point of the Entrypoint is set to zero, which cannot be in a normal executable file, secondly, the scan showed that UPolyX v0.5 * is present.
The second is just not scary - there would be something like “EXECryptor” or “Themida” - some kind of commercial protectors, then yes, and then just some suitable signature seemed to be found.
We press the second lower right button and in the appeared dialog there are three buttons on the right.
He says that the file is packed and the entropy is already 7.56.
Well, let's say, although it still says nothing. Big entropy happens not only at the packed, but also at the ciphered files.
Close the dialog and click on the button to the right of "Subsystem:"
In addition to the entry point, the code and data bases are killed, the standard load base is 4000000.
Well, okay - in our hands we have a file that was slightly adjusted with pens.
Let's try to feel it all in the debugger.
2. Analyze the behavior of the application with Entrypoint = 0
Open OllyDebug, go to the "Options" menu, select "Debugging options" and on the "Events" tab set the checkbox "Make first pause at: -> System breakpoint".
Thus, we will force the debugger to stop when receiving the first debug message before transferring control to the body of the application being debugged.
This is done because of the entry point dropped to zero.
Open the keygenme.exe itself and immediately interrupt somewhere inside the ntdll.dll
What is the entry point (for the application) is the offset from its load base (hInstance), to which the loader transfers control immediately after the process is initialized.
The load base always contains a PE header, where the very first is the _IMAGE_DOS_HEADER structure.
Since the entry point at keygenme is zero, which means control will be transferred directly to its hInstance.
Knowing this, let's see what we have there.
Press "Ctrl + G" and drive in the address of the database "400000", it should work out something like this:
Quite a decent code instead of a standard header, but the title should be in place, otherwise the application would not start, so changes were made directly to _IMAGE_DOS_HEADER.
We look what exactly has changed:
_IMAGE_DOS_HEADER = record { DOS .EXE header } e_magic: Word; { Magic number } e_cblp: Word; { Bytes on last page of file } e_cp: Word; { Pages in file } e_crlc: Word; { Relocations } e_cparhdr: Word; { Size of header in paragraphs } e_minalloc: Word; { Minimum extra paragraphs needed } The e_magic field cannot be touched and it must always contain the initials of Mark Zbikowski 'MZ' (0x4D, 0x5A).
Actually it is not touched, and both of these symbols are interpreted as instructions:
DEC EBP // POP EDX // EDX The value of the second e_cblp field is changed to 0x45, 0x52, which, as a result, cancels the changes made by the first two instructions, restoring the correct stack state.
The remaining 4 fields are used to implement the MOV + JMP commands.
Here in this picture it is shown more clearly.
The whole point of such manipulations with _IMAGE_DOS_HEADER and a dropped entry point is the transfer of control somewhere inside the application body at 4053B6.
Those. in principle, we can open keygenme.exe right now and specify 53B6 as an entry point in the corresponding field (ignoring edits in the file header), but is this the correct entry point?
3. Disassemble the decryptor code of the application body and unpack the application.
We go to the address of the transition "Ctrl + G" 4056B6 and there we see this:
Generally solid garbage. Whatever the line, the garbage instruction.
For example, all conditional branch operators (JG / JPE / JCXZ / JE) are garbage, because it does not matter whether the condition is fulfilled or not, the transition will always be carried out to the next line (note the addresses of the jumps).
Instructions LEA, MOV, XCNG work with the same register without making any changes to its state - garbage.
The instructions for working with the mattress processor (FCLEX / FFREE) reset the exceptions (which are not present, since the work with the mattress processor has not yet been carried out) frees the registers (which are not actually occupied) - garbage.
Scroll through the code to the end to see where this mess of garbage ends.
Just scroll down until we get to the code consisting of all zeros:
Yeah, but it looks like the address we need is 401000, to which the jump is going, which theoretically could be the original entry point.
Let's see what is there:
And there we have the code, which obviously should not be in the Win32 application, which is clearly indicated by the instructions IN and OUT, which will generate an exception when they are executed.
So it turns out that the code at the original entry point (OEP - Original Entry Point) is encrypted and the code in procedure 53B6 must decrypt it before performing the final jump.
But!!!
But in the 53B6 procedure, as shown earlier, garbage.
In fact, there should be more than trash. Apparently we are dealing with the so-called garbage polymorphic, and in its most simple implementation.
The task of the polymorphic engine is to convert the original code by replacing the original instructions with their analogues (or groups of analogues). In order to make the analysis of the resulting code difficult, garbage blocks of instructions are usually added.
Here, the blocks are not observed, just garbage instructions are generated, plus in the end even if there was a replacement of instructions with analogs, then I noticed this only in one case. It is quite possible that just a garbage generator was used here, which plentifully crammed it between useful instructions, who knows ...
However, a task appeared - it is necessary among all this garbage from the address 4053B6 to 406839 (5251 bytes - however) to find useful instructions that carry out the application's script.
This can be done in two ways.
The first is to view the entire code with the eyes and try to find such instructions. I even tried it for the sake of interest and spent about 7 minutes, as a result I even found two such instructions, which are not rubbish. However, as it turned out later, I missed one between them, and even after the second one I found, I somehow got sick of looking further - too tedious.
Therefore, let's go the second way, and write a small script that will help remove all the garbage and leave only the payload.
The script itself is located in the archive that goes with the article along the following path: ". \ Scripts \ fill_trash_by_nop.txt".
To run it, the OllyScript plugin must be installed.
The script runs like this: you need to restart the keygenme in the debugger and wait for the first BP to be triggered inside NTDLL, then select “ODbgScript-> Run Script ...” in the “Plugins” menu, select the script file in the dialog (the path is above) and run him.
As soon as the script starts its work, you can go to make yourself some tea, you will have five minutes of free time.
The logic of the script is simple:
Since the garbage instructions do not change the register values (except for EIP), the garbage instruction is detected by checking the state of the registers before and after its execution, if the registers have changed - the instruction performs something useful, otherwise the instruction is considered garbage and the NOP is placed instead.
When the script completes its work and displays a message, you can view the results of its work (do not stop the debugger itself - it is still needed).
All the garbage will be replaced by NOP and we will only have the following instructions (we need to go from 4053B6 to 406839 and write everything that is not NOP into a notebook):
The first two lines will be some garbage (zero-delayed sleep is called).
0040548B PUSH 0 0040548D CALL DWORD PTR DS:[<&kernel32.Sleep>] ; kernel32.Sleep Well, more precisely, how - this is not exactly garbage, this line causes the bootloader to load kernel32.dll into the process address space, paired with the already loaded ntdll.dll, when the process starts; This library is declared in the keygenme import table (just as one single function sleep).
Next comes the decryptor code itself:
004054B4 MOV ESI,keygenme.00401000 // ESI 0040559D MOV EDI,ESI // EDI // .. 00405677 MOV ECX,1058 // . // 16736 , // .. 4 ($1058 * 4) 004057FE LODS DWORD PTR DS:[ESI] // 4 00405904 NEG EAX // -1 00405B69 NOT EAX // NOT, // EAX 1 // (NEG + NOT = DEC) 00405D3A BSWAP EAX // 00405E90 SUB EAX,4FE62125 // 0x4FE62125 00406121 XOR EAX,12345 // 0x12345 00406256 STOS DWORD PTR ES:[EDI] // 00406442 DEC ECX // 004065C8 JNZ keygenme.004057D9 // ( 004057FE LODS) and direct transition to OEP on which the debugger is currently stopped.
00406839 JMP keygenme.00401000 Roughly speaking, if you look at the decryptor's instructions, the keygenme body is decrypted by this simple algorithm:
uses Classes, Winsock; var I, A: Integer; M: TMemoryStream; begin M := TMemoryStream.Create; try M.LoadFromFile('keygenme.exe'); M.Position := 512; // $1000 for I := 0 to $1058 - 1 do begin M.ReadBuffer(A, 4); // LODS Dec(A); // NEG + NOT A := htonl(A); // BSWAP Dec(A, $4FE62125); // SUB A := A xor $12345; // XOR M.Position := M.Position - 4; M.WriteBuffer(A, 4); // STOS end; M.SaveToFile('keygenme.exe'); finally M.Free; end; end. Now, in order not to wait for the file decryption each time, you need to dump the result (the OllyDump plugin must be installed).
To do this, you need to switch to OEP (“Ctrl + G” 401000) and place a breakpoint there, and then continue with the program.
As soon as the debugger stops at the installed BP, go to the “Plugins” menu, there we select “OllyDump-> Dump debugged process”, this dialog will open:
Focusing on the “Virtual Offset” column, set the code base to 1000, and the database to 7000, remove the “Rebuil import” checkbox and press the “Dump” button.
In the dialog that appears, specify the new name "keygen_unpacked.exe".
Actually everything - so we took off the first envelope.
A little trick:
In general, it was possible to dump more easily, without considering the source code of the decryptor and other things, but since I decided to look at everything thoroughly, therefore I also had to stop at it.
The second unpacking option is as follows.
1. Run the debugger and wait for the first BP to fire inside NTDLL.
2. Go to the tab of the memory card "Alt + M" and at the address 401000 put MBP on the record:
3. We start the program for execution as soon as we have interrupted for a write operation (this will be the STOS DWORD instruction), go back to the memory card and remove the MBP, then go to the OEP (401000) and set the usual breakpoint there.
4. Well, as soon as we stop on it - you need to perform the steps already described on the dump of the process.
By the way, if you want, you can check the resulting file under PEiD, the entropy magically became 6.95 - but all just decrypted the data block.
4. Primary analysis of the unpacked file and bypass startup problems for Vista and above.
Now we will work with the already unpacked file.
Since the entry point in it is set correctly, in order not to make extra gestures, you need to configure Olly to make the first stop not in NTDLL, but directly at the entry point.
Open OllyDebug, go to the "Options" menu, select "Debugging options" and on the "Events" tab set the checkbox "Make first pause at: -> Entry point of main module".
Open the keygenme_unpacked.exe and see what the previously encrypted code has become:
We immediately see the first “trouble”, the first CALL call goes inside itself (the address 401004 is called, while the next instruction starts only with 4010005).
I have already talked about such jumps earlier in this article: “We study the debugger, part two”
The essence of such a trick is to confuse the disassembler and make it display the wrong code that will be executed in reality. There is nothing wrong with such a “trick”, just press F7 performing this CALL and immediately see the correct code:
You can once again dump the process + remove the POP EBX instruction to turn off such a “focus”, but since it will not interfere - let's leave it as it is and start analyzing.
First comes a block of five instructions that reads some data from the PEB (Process Environment Block), whose address is always located in FS: [$ 30].
If you open the PEB structure and see what the offsets shown in the code mean, you’ll get something like this:
0040100A MOV EAX,DWORD PTR FS:[30] // PEB 00401010 MOV EAX,DWORD PTR DS:[EAX+C] // PEB->LoaderData 00401013 MOV EAX,DWORD PTR DS:[EAX+1C] // LoaderData->InInitOrder 00401016 MOV EAX,DWORD PTR DS:[EAX] // _LDR_DATA_TABLE_ENTRY 00401018 MOV EAX,DWORD PTR DS:[EAX+8] // DllBase Thus, these five instructions look for hInstance "kernel32.dll", which will be located at this address, though under Vista and above, this address will be located hInstance "kernelbase.dll" and this will be associated with one nasty error.
The LEA ESI instruction, places in ESI a pointer to a small array of Ansi strings located at 004012DE. These are three strings separated by zeros: "LoadLibraryA", "ExitProcess", and "VirtualAlloc".
By the way, I completely forgot to mention this earlier, if you look at the keygenme.exe import table, you will see that it imports one single function kernel32.sleep, the rest are missing. This means that the addresses of the others necessary for the work, the application should find by itself.
The following instruction, LEA EDI, places in EDI a pointer to a buffer that will contain the addresses of the functions found (this will be a virtual import table for kernel32), after which the procedure is called at 401198.
In fact, both LEA EDI / ESI calls are garbage, because These registers will be reset when you call the procedure at 401198, but they will be used in it exactly as I described above (EDI, more precisely EBP + 305, will eventually contain the addresses of functions).
In short, the task of procedure 401198 is to prepare an ESI register in which a pointer to the name of the function sought is placed, as well as an EDI register in which a pointer is placed to the library's export table, the hInstance of which we received by reading the data from PEB,
then call the function at 4011E2, which will search by name.
And here we are waiting for the second trouble, much more serious than the trick with CALL at the very beginning.
The very first one will be searched for "LoadLibraryA", which "kernelbase.dll" does not export.
This means that under Windows Vista and above, this keygenme will not work and will fall at the start.
You can check, the exception will rise here:
004011EB CMPS BYTE PTR DS:[ESI],BYTE PTR ES:[EDI] To get around this is quite simple, just after starting the keygenme, put the BP on the instruction:
0040101B LEA ESI,DWORD PTR SS:[EBP+2DE] those. immediately after receiving the library loading address, and changing the value in the EAX register to the hInstance of the library “kernel32.dll” (the correct address can be found in the memory card of the Alt + M process).
After such manipulations, the keygenme will start as normal.
In order not to do this every time the application starts, it will be enough to run the script from the folder ". \ Scripts \ run_at_vista.txt", which will automatically replace the EAX value with the correct one each time and start the program without errors.
5. Read login and serial number
Now it's time to see how the login and serial numbers are read into the application memory and what modifications are made on them.
Usually, reading data from EDIT occurs through the function "GetWindowsText" or "GetDlgItemText", but since in the end, the second function still calls the first one, then we will set the breakpoint on “GetWindowsText”.
To do this, after the keygenme was launched (and the user32.dll library was also loaded) and its dialog box appeared, go to the debugger and look for all available functions in all modules:
In the dialog that appears, look for the name of the exported function “GetWindowsTextA”, and in the menu select the item “Follow in Disassembler”:
After that, we put the BP, go to the dialogue with the keygenme and enter the “Ms-Rem” login and the serial number “C38FB7A0CF38F73B1159” into the corresponding fields.
Click the "Check" button and ... stop at the breakpoint inside user32 just at the beginning of the "GetWindowsTextA" function.
Now you need to return to the place of her call.
Click:
1. Ctrl + Shift + F9 - jumping to the end of the function “GetWindowsTextA”
2. F8 - go up to the function “GetDlgItemText”
3. Ctrl + Shift + F9 - jumping to the end of the function “GetDlgItemText”
4. F8 - go up to the place of the call
The blue frame contains the “GetDlgItemText” call just made, with the following parameters:
hDlg = ESI
nIDDlgItem = 65
lpString = EAX
nMaxCount = $ 10
We read the login value to the buffer pointed to by the EAX register, 16 bytes in size, and in the red frame the call to read the serial number to the buffer pointed to by EDI (EBP + 414E) 32 bytes would be highlighted.
The most interesting begins immediately after reading the serial number.
It is followed by an interesting cycle of 10 iterations, while the ESI register points to the buffer with the serial number just read, and EDI to the buffer where the result is placed:
00401111 MOV ECX,0A // 00401116 LODS WORD PTR DS:[ESI] // 00401118 CALL keygenme.0040117B // 0040111D STOS BYTE PTR ES:[EDI] // 1 0040111E LOOPD SHORT keygenme.00401116 // Those. Over the serial number in the function 40117B, some transformations are performed, the result of which is placed in EDI.
This function is as follows:
This is something like converting two characters from a string HEX representation to a byte.
If roughly this is an analogue of Result: = StrToInt ('$' + Value);
Take for example the original known serial number: "C38FB7A0CF38F73B1159"
After 10 iterations, it will be converted to an array with the following contents:
var sn: array [0..9] of Byte = ($C3, $8F, $B7, $A0, $CF, $38, $F7, $3B, $11, $59); But since the function does not check for boundaries beyond which HEX values should not be in string format, that is, a very large range of acceptable values, which after such a reduction will give the same number.
For example, that "C3" that "s1" as a result of this conversion will be equal to 195 (or $ C3). Therefore, this will also be quite a valid serial number: " s1 8FB7A0CF38F73B1159".
Thus, we conclude: the entered login is read as is, and the serial number after reading is converted to a byte representation, and, since There are only 10 iterations, the length of the serial number should not exceed 20 HEX characters (the rest will not be taken into account).
In principle, this is all the information that we need, now it's time to look at the keygenme source code from a slightly different angle.
6. Analyze keygenme under IDA Pro, disassemble VM and get its P-Code
Launch IDA Pro and open keygenme_unpacked.exe in it, right after opening we go to the tab “Functions”.
Only 8 pieces:
And almost all of us are known:
401,000 is OEP, not interested
401096 - and this seems to be the original entry point, which was before any encryption and creation of virtual IATs hung there, but, by the way, we no longer need it.
40117B is HexToInt, saw ...
401198 - filling virtual IAT, saw ...
4011E2 - search function address by name, saw ...
sub_401204 - something interesting (judging by the graph), perhaps we will begin with it, by the way, it calls the two remaining functions sub_401257 and sub_401276.
And the calls to the reading functions from EDITs at 004010F5 and 00401107, as well as the cycle at 00401111, were not recognized by IDA as procedures due to garbage instructions going before them (and not so important).
So, look at the function graph sub_401204:
Have you ever seen what a VM graph looks like in IDA?
If not, then look - this is the body of the virtual machine, and it is quite simple.
What is a virtual machine?
Roughly ... a normal processor performs a set of instructions known to it (machine code that can be disassembled).
A virtual machine is essentially also a processor, only it executes its own set of instructions that are generated and placed somewhere in the available memory in the form of a so-called P-Code.
It is not at all necessary that these instructions will coincide with those that the real processor can execute (more precisely, on the contrary - in most cases they will not be the same).
In the process of protection, commercial protectors disassemble the protected code blocks, generate their own virtual machine for each of them with a unique logic set and instruction set, translate the disassembled code into a picode that a particular virtual machine can execute and save the result as a buffer somewhere in the body applications. Each VM, when receiving control during the execution of a program, sequentially reads the instructions of the picode intended only for it, and executes them.
Thus, the attacker hides the logic of the protected algorithm, which he could disassemble under the debugger.After such modifications, it will be necessary to first analyze each VM, and only after its complete analysis, the algorithm will be pulled out of the picode performed by it, transforming it back into a machine code understandable to the ordinary processor. The job is still ...
In the picture above, we see just one of the implementations of VM, which can execute only 8 instructions known to it.
Let's take a closer look:
Everything starts with the initialization of the EBX register, which indicates the beginning of the buffer with the picode for the virtual machine, as well as the EAX register, which is the cursor (index of the instruction being executed).
VM operation begins with the procedure loc_40120D.
Its task is to first obtain the opcode of the instruction being executed, by calling the function sub_401276, the code of which is given in the hint.
Judging by this code, it can be understood that the picode itself is also encrypted and immediately after reading each byte, its decrypt occurs approximately like this:
var A, B: Byte; ... A := PicodeBuff[I]; B := A; B := B shr 4; A := A xor B; Result := A and 7; After receiving the opcode, it is checked, if it is zero, then control is transferred here:
Where a unit is simply added to some variable (let's call it arg_4 as it is),
and as a result, further control is transferred to the finalizing block, which starts the execution of the next opcode, incrementing the EAX register.
And in it we can find out the total size of the picode, it is equal to $ 3DA2 (15778 bytes).
So, let's sort all the instructions in order:
0. (loc_4012CA): increases the value of the variable "arg_4"
1. (loc_4012C5): decreases the value of the variable "arg_4"
2. (loc_4012BE): increases the value pointed to by "arg_4"
3. ( loc_4012B7): decreases the value pointed to by arg_4
4. (loc_4012A8): puts the value pointed to by arg_4 in memory pointed to by arg_8, then increases the value of the variable arg_8
5 (loc_401299) :. puts the value pointed to by "arg_" in memory pointed to by "arg_4", and then increases the value of the variable "arg_"
6. (loc_401284): checks the value pointed to by “arg_4”, and if it is zero, runs the procedure “sub_401257” passing the value 1 to the EDX
7. (0040123E): checks the value pointed to by “arg_4” and if it is not zero, runs the “sub_401257” procedure, passing the value -1 to the EDX
. In the “sub_401257” procedure, the following occurs, EDX is the direction of the picode scanning, in the case of a positive value, opcode number 7 is searched, corresponding to opcode number 6 with regard to nesting (t. that is, if they go 066770, then when calling from the first opcode 6, the EAX cursor is set to zero, and when called from the second opcode 6, EAX will point to the second seven).
And if EDX = -1, then the scan goes in the opposite direction, taking into account the nesting.
That's actually the whole VM.
Nothing like?
Yeah - that's Brainfuck itself, as it is.
http://ru.wikipedia.org/wiki/Brainfuck
Those.it turns out that inside the keygenme is an encrypted P-Code, which must be executed on the Brainfuck interpreter, which actually acts as a virtual machine (well, why not?)
By the way, if you pay attention to the description of BF in Wikipedia and the implementation of handlers in this variant of the interpreter, you will see that the fourth and fifth opcodes (read and write) are interchanged.
Well, if so, all that is left for us is to pull out the picode itself from the keygenme body and the keygenme is no longer needed, then we ourselves.
In order to determine the location of the buffer with the picode, put the BP at the beginning of the VM and look at the address with which EBX is initialized.
We launch OllyDebug and put BP on address 401208 in it.
After BP triggers, we look at the EBX value, this is the address 401380.
Go to it in the dump window and look at the HEX values, the first 8 bytes are equal to "CE44 4E53101708DD".
Now open the keygenme_unpacked.exe in any HEX editor and look for these 8 bytes.
VM size, as we found earlier 15778 bytes.
Copy 15778 bytes starting from those found in the “vm.mem” file.
Great, now we have the P-Code of the virtual machine, which we have a long and hard work to do, and we no longer need the keygenme along with OllyDebug and IDA Pro, they have done their job.
PS: already copied file "vm.mem" is available in the archive with examples for the article and is located in the folder ". \ Data \ vm.mem".
By the way.
In the process of reading the article, I was pointed out at such a moment: in a real combat application, the number of functions will be several orders of magnitude larger, and how, in this case, determine the body of the virtual machine?
In this situation, it will be sufficient to set the BP to read external data (login and serial number), from which it will be easy enough to track the transition to one of the virtual machine handlers, or perform the same actions with the output buffer (after all, VM must do something and have interaction with the external environment).
But all this, of course, depends on the specific implementation of the VM and this approach is not always applicable.
7. We write our own interpreter Brainfuck
To begin with, we decode the resulting “vm.mem” into a normal representation like this:
const BrainFuckOpcode: array [0..7] of AnsiChar = ('>', '<', '+', '-', ',', '.', '[', ']'); const PicodeBuffSize = 15778; var PicodeBuff: array [0..PicodeBuffSize - 1] of Byte; M: TMemoryStream; I: Integer; A, B: Byte; begin M := TMemoryStream.Create; try M.LoadFromFile('..\..\data\vm.mem'); M.ReadBuffer(PicodeBuff[0], PicodeBuffSize); for I := 0 to PicodeBuffSize - 1 do begin A := PicodeBuff[I]; B := A; B := B shr 4; A := A xor B; PicodeBuff[I] := Byte(BrainFuckOpcode[A and 7]); end; M.Clear; M.WriteBuffer(PicodeBuff[0], PicodeBuffSize); M.SaveToFile('..\..\data\vm.brainfuck'); finally M.Free; end; You get the file "vm.brainfuck" containing the BF code in the form in which it is usually recorded, and here it is already taken into account that the instructions "." and "," mixed up in places.
In principle, this file can already be fed to any BF interpreter, and if you slip the correct buffer with a login and serial number, it will even be executed.
By the way about the buffer with the login and serial number - I completely forgot to mention it. It enters the virtual machine as a block of 20 bytes, where the first 10 bytes are filled with login characters (if the login is less than 10 bytes, the remaining bytes are zero), and immediately after them there are 10 bytes of the serial number converted from the string HEX representation to byte.
Those.for the “Ms-Rem” and “C38FB7A0CF38F73B1159” known to us, the buffer will be like this:
('M', 's', '-', 'R', 'e', 'm', 0, 0, 0, 0, $ C3, $ 8F, $ B7, $ A0, $ CF, $ 38, $ F7, $ 3B, $ 11, $ 59)
This could be seen when starting the virtual machine under the debugger by looking at the data located at the address pointed to by the variable " arg_C.
The BF interpreter requires a buffer of 300,000 bytes (according to the conditions described in the wiki), but in fact this version of the code uses only 221 bytes out of 300,000. We
actually write the code.
We need 4 buffers, for picode, for the VM workspace, input and output buffers.
const PicodeBuffSize = 15778; var // PicodeBuff: array [0..PicodeBuffSize - 1] of Byte; PicodeIndex: Integer; // VM WorkBuff: array [0..220] of Byte; WorkBuffIndex: Integer; // OutputBuff: array [0..39] of AnsiChar; OutputBuffIndex: Integer; // LoginAndPwd: array [0..29] of AnsiChar; LoginAndPwdIndex: Integer; At the start, it is necessary to load the picode and correctly initialize the buffer with the login and serial number:
procedure InitVM; var M: TMemoryStream; begin M := TMemoryStream.Create; try M.LoadFromFile('..\..\data\vm.brainfuck'); M.Read(PicodeBuff[0], PicodeBuffSize); finally M.Free; end; end; procedure InitLoginAndPwd(const Login, Password: AnsiString); var I: Integer; A, B: Byte; begin // Move(Login[1], LoginAndPwd[0], Length(Login)); Move(Password[1], LoginAndPwd[10], Min(Length(Password), 20)); // for I := 0 to 9 do begin A := Byte(LoginAndPwd[10 + I * 2]); B := Byte(LoginAndPwd[11 + I * 2]); if A > $39 then Dec(A, $37) else Dec(A, $30); if B > $39 then Dec(B, $37) else Dec(B, $30); A := a shl 4; A := A or B; LoginAndPwd[10 + I] := AnsiChar(A); end; end; After that you need to write the code itself interpreter:
procedure RunVM; var I: Integer; Count: Integer; begin repeat case PicodeBuff[PicodeIndex] of Byte('>'): Inc(WorkBuffIndex); Byte('<'): Dec(WorkBuffIndex); Byte('+'): Inc(WorkBuff[WorkBuffIndex]); Byte('-'): Dec(WorkBuff[WorkBuffIndex]); Byte('.'): begin OutputBuff[OutputBuffIndex] := AnsiChar(WorkBuff[WorkBuffIndex]); Inc(OutputBuffIndex); end; Byte(','): begin WorkBuff[WorkBuffIndex] := Byte(LoginAndPwd[LoginAndPwdIndex]); Inc(LoginAndPwdIndex); end; Byte('['): begin if WorkBuff[WorkBuffIndex] <> 0 then begin Inc(PicodeIndex); Continue; end; Count := 1; for I := PicodeIndex + 1 to PicodeBuffSize - 1 do begin if PicodeBuff[I] = Byte('[') then begin Inc(Count); Continue; end; if PicodeBuff[I] = Byte(']') then begin Dec(Count); if Count = 0 then begin PicodeIndex := I; Break; end; end; end; end; Byte(']'): begin if WorkBuff[WorkBuffIndex] = 0 then begin Inc(PicodeIndex); Continue; end; Count := 1; for I := PicodeIndex - 1 downto 0 do begin if PicodeBuff[I] = Byte(']') then begin Inc(Count); Continue; end; if PicodeBuff[I] = Byte('[') then begin Dec(Count); if Count = 0 then begin PicodeIndex := I; Break; end; end; end; end; end; Inc(PicodeIndex); until PicodeIndex = PicodeBuffSize; end; It remains only to run it all:
InitVM; InitLoginAndPwd('Ms-Rem', 'C38FB7A0CF38F73B1159'); RunVM; Writeln(PAnsiChar(@OutputBuff[0])); Readln; Run and look at the result:

Well, it seems everything is done correctly and works as it should.
(The source code of the interpreter in the archive with examples '. \ Tools \ bf_execute \')
Thus - the second envelope is removed.
But now what do we do with all this?
It is impossible to analyze the picode head-on - there are no tools, the only thing that can be peeped are the numbers of the cells in which the login and password are entered and from which the result is derived.
We put BP on reading and writing procedures and see what
happens with us ... Nothing good, while the login and serial numbers are read, each byte is always read in cell number six of the working buffer.
The same happens with data output from the VM, the next character is also taken from cell number six.
The only thing that can somehow clarify the picture for us is a dump of the working buffer at the moment of data output, look at it:

Here at least it is clear that in the VM working buffer there is a login and password, as well as just below it two already prepared lines with “good message” and “bad”.
And in the sixth cell of the working buffer (the second from the right above), the prepared “C” character is already sitting from the displayed message “Congratulations !!! It is a valid serial! ”
This is such an ambush.
8. We write Brainfuck decompiler
What is a decompiler?
In fact, it is a utility that converts a set of machine codes for the processor into a set of assembly instructions that the programmer understands. For each processor it will be its own assembler (32/64 / ARM, etc.). Well, the virtual machine (as mentioned earlier) has the same processor with its own set of instructions, expressed in the form of a picode.
The challenge now is to write a picode decompiler into a 32-bit assembler so that we can work somehow with the result, since we already have a tool for analysis, this is a debugger.
And the task is essentially simple, you do not need to take into account the prefixes, parse ModRM / SIB - just eight instructions, but first you need to figure out how it will look.
Disassembling into the forehead will not be a good idea, you need to collapse the blocks of repeating instructions of the pyode BF.
For example, we have a brainfuck script of the following type: ">>> +++ << ----"
Here you can go to the fourth cell, increase its value by three, go to the second and decrease its value by four.
If you disassemble into the forehead, you get something unintelligible:
inc eax inc eax inc eax inc byte ptr [eax] inc byte ptr [eax] inc byte ptr [eax] dec eax dec eax dec byte ptr [eax] dec byte ptr [eax] dec byte ptr [eax] dec byte ptr [eax] It is much easier to minimize duplicate sets of instructions:
add eax, 3 add byte ptr [eax], 3 sub eax, 2 sub byte ptr [eax], 4 Input and output are assembled quite simply.
We only need to know where to read and where to display. Moreover, it is necessary to take into account that each time when reading or outputting data, it is necessary to shift the position in order not to read what has already been read or not to overwrite what has already been written.
There is only a variant with brackets.
The brackets in BF perform an analog of the while loop, i.e. until the cell is zero, the loop body is executed.
The opening bracket "[" is responsible for entering the loop body, for the transition to the next iteration, closing "]".
Those.roughly in the assembler, we need to provide two conditional transitions, one at the entrance to the cycle, one at the transition to the next iteration.
Before the heap, at least one more thing is needed, this is the address where you need to go if the condition for entering the loop failed, or if the condition for going to the next iteration of the loop was not met.
The next step is to figure out how to disassemble the cycles, taking into account the three jumps described above.
For example, there is such a picode:
More convenient for disassembling (at least for me) will be the removal of the loop body beyond the main code, like this:
If we approach this way, then from the disassembler you only need to know the beginning and end of each procedure and in a cycle to decompile the body of each one, inserting jumps into the internal cycles in the right places.
PS: True, right now I am looking at this picture and I understand that it probably shouldn't have been tolerated, because an extra jump has appeared, but ... laziness to rewrite.
Well, okay, now about the working buffer and input / output buffers: the ESI register will be used as a pointer to the working buffer, it will also be the cursor, i.e. on the operations ">" or "<" this particular register will increase or decrease.
A pointer to the buffer with the login and serial number will store the EBX register, and the output buffer will be responsible for the EDI register.
We write the code.
The decompiler will need a buffer with a picode and a small list in which the beginning and end of each While loop will be stored.
var PicodeBuffSize: Integer; PicodeBuff: array of Byte; type TWhileSubProc = record StartAddr, EndAddr: Integer; SubProcEndLabel, SubProcStartLabel: string; end; TWhileSubProcList = TList<TWhileSubProc>; Next, we need several utilitarian procedures.
The first builds the list itself, and the second and third, returns a list item based on the fields StartAddr and EndAddr.
function GetWhileSubProcList: TWhileSubProcList; var I, A, Z: Integer; Item: TWhileSubProc; begin Result := TWhileSubProcList.Create; for I := 0 to PicodeBuffSize - 1 do if PicodeBuff[I] = Byte('[') then begin Item.StartAddr := I; Z := 1; for A := I + 1 to PicodeBuffSize - 1 do begin if PicodeBuff[A] = Byte('[') then begin Inc(Z); Continue; end; if PicodeBuff[A] = Byte(']') then begin Dec(Z); if Z = 0 then begin Item.EndAddr := A; Break; end; end; end; Result.Add(Item); end; end; function IndexAtStart(List: TWhileSubProcList; Value: Integer): Integer; var I: Integer; begin Result := -1; for I := 0 to List.Count - 1 do if List[I].StartAddr = Value then Exit(I); end; function IndexAtEnd(List: TWhileSubProcList; Value: Integer): Integer; var I: Integer; begin Result := -1; for I := 0 to List.Count - 1 do if List[I].EndAddr = Value then Exit(I); end; Now the main procedure is a decompiler of the specified While block:
procedure DecodeSubRoutine(List: TWhileSubProcList; Index: Integer); function GetCharSimbol(Value: Integer): string; begin if Value < 32 then Result := ' // #' + IntToHex(Abs(Value), 2) else Result := string(' // char "' + AnsiChar(Value) + '"'); end; const LabelPfx = '@vm_code_'; var Count, I: Integer; SubRoutineName: string; Item: TWhileSubProc; begin if Index >= 0 then begin // while , PicodeIndex := List[Index].StartAddr; SubRoutineName := LabelPfx + IntToHex(PicodeIndex, 4); MakeAsmCode(SubRoutineName + ':'); Inc(PicodeIndex); end else // SubRoutineName := '@root'; repeat case PicodeBuff[PicodeIndex] of // Byte('>'), Byte('<'): begin Count := 0; while PicodeBuff[PicodeIndex] in [Byte('>'), Byte('<')] do begin if PicodeBuff[PicodeIndex] = Byte('>') then Inc(Count) else Dec(Count); Inc(PicodeIndex); end; if Count = 0 then Continue; if Count < 0 then begin if Count = -1 then MakeAsmCode(' dec esi') else MakeAsmCode(' sub esi, ' + IntToStr(Abs(Count))); end; if Count > 0 then begin if Count = 1 then MakeAsmCode(' inc esi') else MakeAsmCode(' add esi, ' + IntToStr(Count)); end; Continue; end; // Byte('+'), Byte('-'): begin Count := 0; while PicodeBuff[PicodeIndex] in [Byte('+'), Byte('-')] do begin if PicodeBuff[PicodeIndex] = Byte('+') then Inc(Count) else Dec(Count); Inc(PicodeIndex); end; if Count = 0 then Continue; if Count < 0 then begin if Count = -1 then MakeAsmCode(' dec byte ptr [esi]') else MakeAsmCode(' sub byte ptr [esi], ' + IntToStr(Abs(Count)) + GetCharSimbol(Count)); end; if Count > 0 then begin if Count = 1 then MakeAsmCode(' inc byte ptr [esi]') else MakeAsmCode(' add byte ptr [esi], ' + IntToStr(Count) + GetCharSimbol(Count)); end; Continue; end; // Byte('.'): begin MakeAsmCode(' mov al, byte ptr [esi]'); MakeAsmCode(' mov byte ptr [edi], al'); MakeAsmCode(' inc edi'); end; // Byte(','): begin MakeAsmCode(' mov al, byte ptr [ebx]'); MakeAsmCode(' inc ebx'); MakeAsmCode(' mov byte ptr [esi], al'); end; // While Byte('['): begin I := IndexAtStart(List, PicodeIndex); Item := List[I]; MakeAsmCode(' cmp byte ptr [esi], 0 // ['); Item.SubProcEndLabel := SubRoutineName + '_' + IntToHex(PicodeIndex + 1, 4); Item.SubProcStartLabel := LabelPfx + IntToHex(PicodeIndex, 4); // , // MakeAsmCode(' jne ' + Item.SubProcStartLabel); MakeAsmCode(Item.SubProcEndLabel + ':'); PicodeIndex := Item.EndAddr + 1; List[I] := Item; Continue; end; // Byte(']'): begin I := IndexAtEnd(List, PicodeIndex); MakeAsmCode(' cmp byte ptr [esi], 0 // ]'); // , MakeAsmCode(' jne ' + List[I].SubProcStartLabel); // MakeAsmCode(' jmp ' + List[I].SubProcEndLabel); // - Exit; end; end; Inc(PicodeIndex); until PicodeIndex = PicodeBuffSize; // , MakeAsmCode(' popa'); MakeAsmCode(' ret'); end; It remains to cycle through to decompile each While block:
procedure DecodeVM; var I: Integer; List: TWhileSubProcList; begin MakeAsmCode('procedure RunBrainfuck(pWorkBuff, pInBuf, pOutBuf: Pointer);'); MakeAsmCode('asm'); MakeAsmCode(' pusha'); MakeAsmCode(' mov esi, pWorkBuff'); MakeAsmCode(' mov ebx, pInBuf'); MakeAsmCode(' mov edi, pOutBuf'); List := GetWhileSubProcList; try DecodeSubRoutine(List, -1); for I := 0 to List.Count - 1 do DecodeSubRoutine(List, I); finally List.Free; end; MakeAsmCode('end;'); end; And write the startup code for all of this:
function InitPicode: Boolean; var M: TMemoryStream; begin Result := False; if (ParamCount = 0) or not FileExists(ParamStr(1)) then begin Writeln('Brainfuck file not found.'); Exit; end; M := TMemoryStream.Create; try M.LoadFromFile(ParamStr(1)); PicodeBuffSize := M.Size; SetLength(PicodeBuff, PicodeBuffSize); M.ReadBuffer(PicodeBuff[0], PicodeBuffSize); Result := True; finally M.Free; end; end; begin if InitPicode then begin AsmCode := TFileStream.Create(ChangeFileExt(ParamStr(1), '.inc'), fmCreate); try DecodeVM; finally AsmCode.Free; end; Writeln('Done.'); end; Readln; end. (The source code of the decompiler in the archive with examples '. \ Tools \ bf_decompiler \')
Now you need to check its work on anything.
Take for example Hello World from a wiki with this content:
++++++++++ [> +++++++> +++++++++> +++> + <<<< -]> ++
.> +. + ++++++. +++.> ++. << +++++++++++++++.>. +++.
------.--------.> +.>.
And let's see what it is being decompiled into:
procedure RunBrainfuck(pWorkBuff, pInBuf, pOutBuf: Pointer); asm pusha mov esi, pWorkBuff mov ebx, pInBuf mov edi, pOutBuf add byte ptr [esi], 10 // #0A cmp byte ptr [esi], 0 // [ jne @vm_code_000B @root_000C: inc esi add byte ptr [esi], 2 // #02 mov al, byte ptr [esi] mov byte ptr [edi], al inc edi inc esi inc byte ptr [esi] mov al, byte ptr [esi] mov byte ptr [edi], al inc edi add byte ptr [esi], 7 // #07 mov al, byte ptr [esi] mov byte ptr [edi], al inc edi mov al, byte ptr [esi] mov byte ptr [edi], al inc edi add byte ptr [esi], 3 // #03 mov al, byte ptr [esi] mov byte ptr [edi], al inc edi inc esi add byte ptr [esi], 2 // #02 mov al, byte ptr [esi] mov byte ptr [edi], al inc edi sub esi, 2 add byte ptr [esi], 15 // #0F mov al, byte ptr [esi] mov byte ptr [edi], al inc edi inc esi mov al, byte ptr [esi] mov byte ptr [edi], al inc edi add byte ptr [esi], 3 // #03 mov al, byte ptr [esi] mov byte ptr [edi], al inc edi sub byte ptr [esi], 6 // #06 mov al, byte ptr [esi] mov byte ptr [edi], al inc edi sub byte ptr [esi], 8 // #08 mov al, byte ptr [esi] mov byte ptr [edi], al inc edi inc esi inc byte ptr [esi] mov al, byte ptr [esi] mov byte ptr [edi], al inc edi inc esi mov al, byte ptr [esi] mov byte ptr [edi], al inc edi popa ret @vm_code_000B: inc esi add byte ptr [esi], 7 // #07 inc esi add byte ptr [esi], 10 // #0A inc esi add byte ptr [esi], 3 // #03 inc esi inc byte ptr [esi] sub esi, 4 dec byte ptr [esi] cmp byte ptr [esi], 0 // ] jne @vm_code_000B jmp @root_000C end; Looks like. I agree, you can sub-optimize, but not the task.
Check how it will work and write a test:
program hello_world_test; {$APPTYPE CONSOLE} {$R *.res} {$I ..\..\data\helloworld.inc} var WorkBuff: array [0..300000] of Byte; OutBuf: array [0..100] of Byte; begin RunBrainfuck(@WorkBuff[0], nil, @OutBuf[0]); Writeln(PAnsiChar(@OutBuf[0])); Readln; end. See the result:
Well, not bad.
It turned out what was intended, now we decompile the body of the VM itself.
The output was 8153 lines of the purest assembler :)
(the result of VM decompilation in the archive with examples '. \ Data \ vm.inc')
Having run through his eyes, you can immediately notice the initialization procedure for the 'good' and 'bad' lines inside vm_code_001B_001D:
@vm_code_001B_001D: add esi, 105 add byte ptr [esi], 67 // char "C" add esi, 2 add byte ptr [esi], 111 // char "o" add esi, 2 add byte ptr [esi], 110 // char "n" add esi, 2 add byte ptr [esi], 103 // char "g" add esi, 2 add byte ptr [esi], 114 // char "r" add esi, 2 add byte ptr [esi], 97 // char "a" add esi, 2 add byte ptr [esi], 116 // char "t" add esi, 2 add byte ptr [esi], 117 // char "u" add esi, 2 add byte ptr [esi], 108 // char "l" add esi, 2 add byte ptr [esi], 97 // char "a" add esi, 2 add byte ptr [esi], 116 // char "t" add esi, 2 add byte ptr [esi], 105 // char "i" add esi, 2 add byte ptr [esi], 111 // char "o" add esi, 2 add byte ptr [esi], 110 // char "n" add esi, 2 add byte ptr [esi], 115 // char "s" add esi, 2 add byte ptr [esi], 33 // char "!" add esi, 2 add byte ptr [esi], 33 // char "!" add esi, 2 add byte ptr [esi], 33 // char "!" add esi, 2 add byte ptr [esi], 32 // char " " add esi, 2 add byte ptr [esi], 73 // char "I" add esi, 2 add byte ptr [esi], 116 // char "t" add esi, 2 add byte ptr [esi], 32 // char " " add esi, 2 add byte ptr [esi], 105 // char "i" add esi, 2 add byte ptr [esi], 115 // char "s" add esi, 2 add byte ptr [esi], 32 // char " " add esi, 2 add byte ptr [esi], 118 // char "v" add esi, 2 add byte ptr [esi], 97 // char "a" add esi, 2 add byte ptr [esi], 108 // char "l" add esi, 2 add byte ptr [esi], 105 // char "i" add esi, 2 add byte ptr [esi], 100 // char "d" add esi, 2 add byte ptr [esi], 32 // char " " add esi, 2 add byte ptr [esi], 115 // char "s" add esi, 2 add byte ptr [esi], 101 // char "e" add esi, 2 add byte ptr [esi], 114 // char "r" add esi, 2 add byte ptr [esi], 105 // char "i" add esi, 2 add byte ptr [esi], 97 // char "a" add esi, 2 add byte ptr [esi], 108 // char "l" add esi, 2 add byte ptr [esi], 33 // char "!" add esi, 4 add byte ptr [esi], 83 // char "S" add esi, 2 add byte ptr [esi], 101 // char "e" add esi, 2 add byte ptr [esi], 114 // char "r" add esi, 2 add byte ptr [esi], 105 // char "i" add esi, 2 add byte ptr [esi], 97 // char "a" add esi, 2 add byte ptr [esi], 108 // char "l" add esi, 2 add byte ptr [esi], 32 // char " " add esi, 2 add byte ptr [esi], 105 // char "i" add esi, 2 add byte ptr [esi], 110 // char "n" add esi, 2 add byte ptr [esi], 118 // char "v" add esi, 2 add byte ptr [esi], 97 // char "a" add esi, 2 add byte ptr [esi], 108 // char "l" add esi, 2 add byte ptr [esi], 105 // char "i" add esi, 2 add byte ptr [esi], 100 // char "d" add esi, 2 add byte ptr [esi], 32 // char " " add esi, 2 add byte ptr [esi], 58 // char ":" add esi, 2 add byte ptr [esi], 40 // char "(" But ... all the same, more than 8 thousand lines, with a swoop they can not be analyzed.
Need to write additional tools.
But for this you need to write a small demo application that executes decompiled VM code, with which we will work throughout the rest of the article.
program decompiled_vm_test; {$APPTYPE CONSOLE} {$R *.res} uses Classes, Math; var // VM WorkBuff: array [0..220] of Byte; WorkBuffIndex: Integer; // OutputBuff: array [0..39] of AnsiChar; OutputBuffIndex: Integer; // LoginAndPwd: array [0..29] of AnsiChar; LoginAndPwdIndex: Integer; procedure InitLoginAndPwd(const Login, Password: AnsiString); var I: Integer; A, B: Byte; begin // Move(Login[1], LoginAndPwd[0], Length(Login)); Move(Password[1], LoginAndPwd[10], Min(Length(Password), 20)); // for I := 0 to 9 do begin A := Byte(LoginAndPwd[10 + I * 2]); B := Byte(LoginAndPwd[11 + I * 2]); if A > $39 then Dec(A, $37) else Dec(A, $30); if B > $39 then Dec(B, $37) else Dec(B, $30); A := a shl 4; A := A or B; LoginAndPwd[10 + I] := AnsiChar(A); end; end; {$I ..\..\data\vm.inc} begin InitLoginAndPwd('Ms-Rem', 'C38FB7A0CF38F73B1159'); RunBrainfuck(@WorkBuff[0], @LoginAndPwd[0], @OutputBuff[0]); Writeln(PAnsiChar(@OutputBuff[0])); Readln; end. In the demo application settings, you need to enable the generation of the MAP file (in the Detailed mode), it will be useful to us in the next chapter.
9. Writing a tracer
In order to understand what exactly is happening in the decompiled code, it is necessary to build the execution trace. And there will be enough information about which blocks are executed and where the transition takes place from them.
The essence of the route is to build a directional graph, analyzing which logical branches in vector blocks can be stopped (roughly, in the form of a flowchart).
This will require a debugger: http://habrahabr.ru/post/178159/
In the process of building the route, the debugger will go step by step according to the code of the recipient, interrupting at the addresses that we can lead to the line number in the source code we previously generated.
To bring the address to the line number in the asm listing, you will need a small module that will parse the MAP file and return this information.
You will also need another module, which, by the line number in the asm listing, will return the name of the sub-procedure on which the stop occurred.
The source code of the last two modules will not be given - they are very simple, in any case, the code can be seen in the archive with examples for the article in the following way: '. \ Tools \ tracer \'.
You also need a class that will store the data about the shot track.
Roughly his whole task is to keep an array of records like this:
type TTraceItem = record SubName: string; InList, OutList: TStringList; CustomData: Pointer; end; and provide methods for working with it.
Also very simple, you can see the code in the archive on the way: '. \ Tools \ common \ trace_data.pas'
The execution route will be shot in 4 passes in 4 different modes.
1. Full track program execution.
2. Partial trace, from one iteration of reading the buffer with login and serial number.
3. Partial trace from one iteration of output.
4. Detection of procedures in which cells with login and password are recorded.
A little later, the treser will have to be added, adding the fifth mode to it to completely remove the track, but removed from the de-example, in which the serial number will be dropped into a sequence of zeros (in the source code this mode will be called ttWrongSN).
But more about that later, but now ...
The implementation of the tracer is quite banal:
1. turn off the OnCreateProcess debugger and initialize it with the installation of the corresponding BP:
procedure TTracer.OnCreateProcess(Sender: TObject; ThreadIndex: Integer; Data: TCreateProcessDebugInfo); begin Writeln('process start'); case FTraceType of // ttFull: begin FDebuger.SetHardwareBreakpoint(ThreadIndex, Pointer(FMap.AddrAtLine(FSrc.StartLine)), hsByte, hmExecute, 0, 'vm_start'); FDebuger.SetHardwareBreakpoint(ThreadIndex, Pointer(FMap.AddrAtLine(FSrc.EndLine)), hsByte, hmExecute, 1, 'vm_end'); end; ttIn: // FDebuger.SetHardwareBreakpoint(ThreadIndex, Pointer(FMap.AddrAtLine(FSrc.ReadPwdLine)), hsByte, hmExecute, 0, 'read_pwd_start'); ttOut: // FDebuger.SetHardwareBreakpoint(ThreadIndex, Pointer(FMap.AddrAtLine(FSrc.OutputBufLine)), hsByte, hmExecute, 0, 'out_data_start'); ttCheckLoginBuff: begin // FDebuger.SetHardwareBreakpoint(ThreadIndex, Pointer(FMap.AddrAtLine(FSrc.StartLine)), hsByte, hmExecute, 0, 'LoginAndSN_MBP_Present'); FDebuger.SetHardwareBreakpoint(ThreadIndex, Pointer(FMap.AddrAtLine(FSrc.EndLine)), hsByte, hmExecute, 1, 'vm_end'); end; end; end; 2. After that, in the handler of the hardlock, we set the operation modes:
procedure TTracer.OnHardwareBreakpoint(Sender: TObject; ThreadIndex: Integer; ExceptionRecord: Windows.TExceptionRecord; BreakPointIndex: THWBPIndex; var ReleaseBreakpoint: Boolean); var CurrentName: string; ThreadData: TThreadData; I: Integer; begin Inc(FTotalStepCount); ThreadData := FDebuger.GetThreadData(ThreadIndex); Writeln(ThreadData.Breakpoint.Description[BreakPointIndex]); case FTraceType of ttFull: begin if BreakPointIndex = 0 then begin FDebuger.ResumeAction := raTraceInto; ReleaseBreakpoint := True; end else begin ReleaseBreakpoint := True; CurrentName := FSrc.GetProcedureNameAtLine(FMap.LineAtAddr(DWORD(ExceptionRecord.ExceptionAddress))); FTrace.AddTace(FPreviousName, CurrentName); FTrace.SaveToFile('..\..\data\full.trace'); Writeln('Trace done.'); Writeln('Total instructions traced: ', FTotalStepCount); Writeln('Traced subroutine added: ', FTrace.Count); Writeln('Time elapsed: ', GetTickCount - FStart, 'ms'); end; end; ttIn, ttOut: begin if FProcList.Count > 0 then begin ReleaseBreakpoint := True; CurrentName := FSrc.GetProcedureNameAtLine(FMap.LineAtAddr(DWORD(ExceptionRecord.ExceptionAddress))); FTrace.AddTace(FPreviousName, CurrentName); if FTraceType = ttIn then FProcList.SaveToFile('..\..\data\in.proclist') else FProcList.SaveToFile('..\..\data\out.proclist'); Writeln('Trace done.'); Writeln('Total instructions traced: ', FTotalStepCount); Writeln('Traced subroutine added: ', FProcList.Count); Writeln('Time elapsed: ', GetTickCount - FStart, 'ms'); FDebuger.ResumeAction := raRun; end else FDebuger.ResumeAction := raTraceInto; end; ttCheckLoginBuff: begin ReleaseBreakpoint := True; if BreakPointIndex = 0 then begin FWorkBuffAddr := PByte(FDebuger.GetContext(0).Eax); for I := 0 to 9 do FDebuger.SetMemoryBreakpoint(FWorkBuffAddr + 28 + (I * 2), 1, True, 'Login' + IntToStr(I)); for I := 0 to 9 do FDebuger.SetMemoryBreakpoint(FWorkBuffAddr + 48 + (I * 2), 1, True, 'SN' + IntToStr(I)); end else begin FProcList.SaveToFile('..\..\data\change_buff.proclist'); Writeln('Trace done.'); Writeln('Total instructions traced: ', FTotalStepCount); Writeln('Traced subroutine added: ', FProcList.Count); Writeln('Time elapsed: ', GetTickCount - FStart, 'ms'); end; end; end; end; In short, in the full dump mode (ttFull) the second HBP will signify the completion of the trace process, the “ttIn, ttOut” modes will stop at the second HBP trigger (one I / O pass), and ttCheckLoginBuff will perform a trace using the MBP until the entire VM cycle will be executed.
3. Trace results will be collected in these two handlers:
procedure TTracer.OnSingleStep(Sender: TObject; ThreadIndex: Integer; ExceptionRecord: Windows.TExceptionRecord); var CurrentName: string; begin Inc(FTotalStepCount); CurrentName := FSrc.GetProcedureNameAtLine(FMap.LineAtAddr(DWORD(ExceptionRecord.ExceptionAddress))); if FTraceType = ttFull then begin if FPreviousName = '' then FPreviousName := CurrentName; if FPreviousName <> CurrentName then begin FTrace.AddTace(FPreviousName, CurrentName); FPreviousName := CurrentName; end; end else FProcList.Add(CurrentName); FDebuger.ResumeAction := raTraceInto; end; procedure TTracer.OnMemoryBreakpoint(Sender: TObject; ThreadIndex: Integer; ExceptionRecord: Windows.TExceptionRecord; BreakPointIndex: Integer; var ReleaseBreakpoint: Boolean); begin Inc(FTotalStepCount); FProcList.Add( FSrc.GetProcedureNameAtLine(FMap.LineAtAddr(DWORD(ExceptionRecord.ExceptionAddress)))); end; The first one follows the branching of the transitions, and the second simply collects the names of the procedures from which the access to the buffer occurred, in which the login and the serial number are located.
As a result of the work of the tracer, we will have 4 files on the basis of which we can fairly easily analyze all the work of the VM, but ...
But for this, you need to somehow display the data in the form in which you can work with them ...
10. Display the execution route in the form of a graph.
IDA Pro is an excellent tool, the graphs issued by it are very helpful in the process of analyzing the source code, but ... but it is not universal.
In particular, with the graph of the decompiled VM code built by IDA, it is not very convenient to work in this case.
That is why I went to personally removing the track (described in the last chapter) and writing a tool to visualize it.
The essence of the tool is as follows:
1. turn the software execution trace into the graph being visualized
2. display the logical execution blocks in the column
3. as a result, show block addresses interesting for code analysis.
The very first stage is the conversion of data from the tracer into a directed graph.
It is built quite simply - we take the current block and recursively build outgoing transitions from it. The main thing to forget about while cycles, where the transition at the end of the procedure to its beginning, will be directed to the already added element.
Therefore, when constructing a graph, it is necessary for each element to add a custom property in which the graph node will be stored, to which a link should be placed at the first call.
Analyzing the BF code, the following conclusions can be made:
1. In each of the while cycles there can be only 2 inputs (from the external code block and the transition from the end of the cycle).
2. The end of each while cycle has only 2 exits (if the cycle is completed go to a higher level by code, otherwise return to the beginning of the cycle).
3. From the body of the block while there may be a multiple number of outputs, provided there are ifthen blocks in its body (but this is not our case).
The code convolution means the following:
1. If the procedure has one input and one output (according to the trace results), then it is added to the current convolution block.
2. The beginning of each convolution block will be any procedure that has two inputs (while loop).
3. The end of the convolution block will be a transition to an already added code (end of while) or any other block of code that, according to the results of the route, has two outputs (which implies the same end of the cycle, based on the previous item 3).
A fairly simple recursive procedure ('. \ Tools \ trace_viewer \ trace_graph.pas') is responsible for all these stages:
procedure TTraceGraph.LoadItem(Index: Integer; AParent: TExecutionBlock); var Block: TExecutionBlock; Item: TTraceItem; begin // - // - // - // , Item := FTrace[Index]; if Item.CustomData <> nil then begin AddVector(AParent, Item.CustomData); Exit; end; Block := TExecutionBlock(AddNode(NodesCount)); if AParent = nil then Block.Level := 0 else begin AddVector(AParent, Block); Block.Level := AParent.Level + 1; FMaxLevel := Max(FMaxLevel, Block.Level); end; Block.ProcList.Add(Item.SubName); FTrace.SetCustomData(Index, Block); // - if Item.OutList.Count = 0 then Exit; // - if (Item.OutList.Count = 2) then begin LoadItem(FTrace.GetItemIndexByName(Item.OutList[0]), Block); LoadItem(FTrace.GetItemIndexByName(Item.OutList[1]), Block); Exit; end; // Item := FTrace.ItemByName(Item.OutList[0]); while Item.InList.Count = 1 do begin Block.ProcList.Add(Item.SubName); FTrace.SetCustomData(FTrace.GetItemIndexByName(Item.SubName), Block); case Item.OutList.Count of 0: Exit; 1: Item := FTrace.ItemByName(Item.OutList[0]); 2: begin LoadItem(FTrace.GetItemIndexByName(Item.OutList[0]), Block); LoadItem(FTrace.GetItemIndexByName(Item.OutList[1]), Block); Exit; end; end; end; if Item.InList.Count = 2 then LoadItem(FTrace.GetItemIndexByName(Item.SubName), Block); end; The result of processing the trace of the decompiled code (in which there are no complicated cases in the form of multiple outputs from while) will be the following picture:
It displays the program execution trace, with minimized execution blocks.
Do not pay attention to the fact that everything is so beautifully arranged in vertical columns - I did not write an algorithm for this arrangement and everything was trivially scattered with pens (for it is much faster than writing the same visualization engine as with IDA.
I will not give the source code of this utility , you can see it in the archive ". \ tools \ trace_viewer \".
Its main task is to give a starting point from which you can push off when analyzing the VM code.
And here are two pictures that show part of the logic of the work.
This is what happens when reading the login and serial number:
But these procedures are performed when displaying the result:
Pay attention to the execution of procedures in the center of the scheme, they are a hardware and do not participate in the logic of the algorithm hidden in the VM.
Immediately make a reservation - this conclusion was made in the process of researching the code.
Initially, having received such two pictures on my hands, I was a little puzzled and suggested that there could be another mini-VM hiding inside (a green vertical block from the bottom left) that spreads logic based on my own instructions, but ... the assumption turned out to be wrong.
And so, judging by the pictures we have on hand:
1. The upper left block of the diagram is the reading of data.
2. Lower right - output result.
3. The central branch is a kind of matapparat (as a result, it’s not even necessary to analyze it).
All that is not highlighted in green and there is a third envelope (hidden under VM logic).
Those who will study the source code of this viewer apologize in advance - the tool code is very raw and was written literally on the knee in two nights, so the utility does not have much functionality. It only knows how to display the graph itself, provides a mechanism for modifying it (read, you can move blocks as it will be more convenient).
ZOOM mode is not added, for this there is a separate button that generates a general preview (from which the screenshots were taken).
But the role of the graph analysis tool is not bad.
In the archive with the article there is an already placed graph ('. \ Data \ current.graph') which was obtained from the route taken in the previous chapter ('. \ Data \ full.trace').
However ... to our sheep.
The tool for analyzing the decompiled VM code is ready, let's proceed directly to its analysis ...
11. Analysis and detection of the variable reading algorithm.
Having started the VM analysis, I already had some idea of what I would have to work with.
Relying on the memory card with which the VM is running (shown in Chapter 7), I knew the offsets for which the “correct” and “incorrect” lines with the results are located, as well as the offset for which the buffer with the login and serial number is located.
Knowing how the BF interpreter works, I even figured out an approximate algorithm for working with data, taking into account the fact that certain operations should be performed on login and SN.
For example, if you want to add two Z and X fields, then there is no addition operation in Brainfuck, for this you will need to write a while loop in which the value of cell X will be iteratively decremented and the value of cell Y will be incremented.
Thus, cell Y will contain the sum of both cells, and cell X will be reset.
But at data output, as shown above, one can observe that the buffer with the login and serial number is where it should be and none of its fields are changed. So in the VM, some other approach is used to read the data.
A strange nuance to which I immediately noticed that the login, the serial number, the “correct” and “not correct” lines in the memory card are not as they are, and each byte is separated from the next by zero. It feels like we are working with unicode, although in reality the work goes with ANSI strings.
These two points were not clear to me.
However, it is still necessary to start with something, and I decided to start analyzing the algorithm from its end, assuming that the decision on outputting the result is made here with such a block of procedures (where the result is displayed):
Moreover, the graph shows this block as one function with one entry point and one exit.
(By the way, the assumption that a decision is made in this block, in the end, turned out to be wrong).
For debugging, I used the CPU-View mode directly by Delphi itself (this turned out to be sufficient for the eyes).
The debugged application was “decompiled_vm_text.exe” from which the execution trail was shot.
Three variables were added to the Watch List as auxiliary prompts:
1. The current value of the working buffer cursor (ESI register), which was calculated by the difference from the start address of the working buffer (pWorkBuff) and the current register value. (esi- $ 4E5008)
2. The value of the current pWorkBuff cell (pbyte (esi) ^)
3. It is the same in HEX mode only.
4. The dump window was tuned to the beginning of the VM working buffer ($ 4E5008).
PS: you have the address of the working buffer may be different, so the number 4E5008 you must calculate in advance at the start of debugging, by looking at this value in the variable pWorkBuff.
Thus, the configured debugger stopped at the beginning of the "@ vm_code_39D7" procedure looked like this:
Actually with this procedure and begin.
If you pay attention to the graph image, this is the very first procedure in the minimized execution block that calls itself (while loop).
At the time of calling this procedure, the working buffer cursor is set to cell number 27 (in the picture with the memory card highlighted in red), which contains a certain number (40 or $ 28). This cell is located just before the buffer with the login and serial number (located on the offset 28, which stores the first character of the login - "M").
Remember the number of this cell - it is one of the central elements of the VM logic.
Let's see the source code of the minimized block:
@vm_code_39D7: cmp byte ptr [esi], 0 // №27 ? jne @vm_code_39D8 // , @vm_code_39D8: add esi, 2 // 2 cmp byte ptr [esi], 0 // ? jne @vm_code_39D8 // , @vm_code_39D7_39D9: // ? inc byte ptr [esi] // 1 cmp byte ptr [esi], 0 jne @vm_code_39DD // #27 @vm_code_39DD: sub esi, 2 // ( 2 ), // .. , #27 cmp byte ptr [esi], 0 jne @vm_code_39DD @vm_code_39D7_39DE: add esi, 2 // #27 dec byte ptr [esi] // cmp byte ptr [esi], 0 // , jne @vm_code_39D7 jmp @vm_code_397A_39D8 // Here I built the execution blocks in the order of their execution (not in the form in which they go in the source code) in order to make it easier to analyze the logic from the work.
So what is going on here?
This algorithm initializes zeros (which separate each element of the login / serial number, as well as the "bad" and "good" lines) with units.
If you stop at the finalization of the cycle and look at the result, you can see this picture:
Cell 27 will be reset to zero, but as a result you can see that the buffer will be initialized to units ending just before the first VM output with the “good string” character, namely the “C” character.
Notice how interesting are the transitions to the beginning and end of the data being changed (the @ vm_code_39D8 and @ vm_code_39DD procedures). The detection of the end blocks is used to verify the current cell value with zero, the leftmost zero will indicate the position of cell 27 (with a shift), and the rightmost zero will indicate the cell that has not yet been initialized.
Thus, the essence of this block is reduced to the construction of an index (in the form of units) to a cell with which the next while cycle will start, starting with the @ vm_code_39EB procedure.
It will begin its work from the cell to which the last unit of the previously built index points, namely from cell No. 108, where the “C” symbol (highlighted in blue) is located, which the VM should now output to the external buffer.
Before calling this procedure, VM managed to perform some preparatory actions, one of which was the initialization of cell No. 27 by a unit, thus. The leftmost cell to which the search algorithm of the left end of the index will go from now on will be cell No. 26.
So:
@vm_code_39EB: dec esi // №108, cmp byte ptr [esi], 0 // , jne @vm_code_39ED @vm_code_39ED: sub esi, 2 // , cmp byte ptr [esi], 0 // ( №26) jne @vm_code_39ED jmp @vm_code_39EB_39EE @vm_code_39EB_39EE: inc esi // №26 inc byte ptr [esi] // №26 sub esi, 20 // №6 inc byte ptr [esi] // add esi, 21 // cmp byte ptr [esi], 0 jne @vm_code_3A1D @vm_code_3A1D: add esi, 2 // ( 108) cmp byte ptr [esi], 0 jne @vm_code_3A1D jmp @vm_code_39EB_3A1E // , @vm_code_39EB_3A1E: dec esi // №108 dec byte ptr [esi] // cmp byte ptr [esi], 0 // , ... jne @vm_code_39EB jmp @vm_code_397A_39EC // The logic of the second cycle is as follows: it transfers the value of cell No. 108 to cells number 26 and number 6 (note that this is the sixth cell from which the character is taken, which I indicated in the seventh chapter).
And in fact, the logic of working with data already begins to emerge (when reading a value, a value is duplicated at two addresses).
The memory card starts to look like this:
The green rectangles indicate the places with which the changes occurred, the red cell highlighted number 108 from which the value was taken.
The next while loop in the graph begins with the procedure "@ vm_code_3A2A".
He will begin his work from cell number 26, which stores a copy of the number previously placed in cell number 108.
The code looks like this:
@vm_code_3A2A: inc esi // cmp byte ptr [esi], 0 jne @vm_code_3A2C @vm_code_3A2C: add esi, 2 cmp byte ptr [esi], 0 // , №108 jne @vm_code_3A2C jmp @vm_code_3A2A_3A2D @vm_code_3A2A_3A2D: dec esi // №108 inc byte ptr [esi] // dec esi // cmp byte ptr [esi], 0 jne @vm_code_3A33 @vm_code_3A33: sub esi, 2 // cmp byte ptr [esi], 0 jne @vm_code_3A33 jmp @vm_code_3A2A_3A34 // , @vm_code_3A2A_3A34: inc esi // №26 dec byte ptr [esi] // cmp byte ptr [esi], 0 // jne @vm_code_3A2A // jmp @vm_code_397A_3A2B // The task of this code is to move the value of the jar of cell No. 26 back to cell No. 108, thus restoring the original value of the cell with which the algorithm began its work.
Let's look at the memory card after the algorithm works:
And the final step in this slightly confusing logic of working with cells will be the final, located in the procedure "@ vm_code_3A41".
It is quite simple:
@vm_code_3A41: dec byte ptr [esi] sub esi, 2 cmp byte ptr [esi], 0 jne @vm_code_3A41 Its whole task is to start work from the most recent cell equal to one (by means of which the index is built) and remove all units of the index.
The result of her work is such a map:
The green fields are the index fields that were removed by the last procedure, and the red one is the result of the work of all four rolled blocks.
Confused?
Nothing strange, but if you look closely at the most recent picture, you can understand that all this fancy logic from the four stages essentially performs one simple operation.
And this operation is the assignment of the value of cell “A” to cell “B”.
Moreover, the algorithm is quite flexible and thus allows you to read the value of any login / serial number symbol or “good / bad” lines; to do this, it is enough to initialize cell No. 27 with the symbol number and perform all four steps described above.
A beautiful approach - you will not say anything, the logic of working with cells is fairly solidly smeared, although there is a small nuance.
Having understood how the cell value is obtained and having the execution graph in hand, it will take an hour and a half to analyze all the logic of the work from this moment on.
The rest of the procedures from the top picture with the graph does not make sense to consider, there is some internal hardware necessary for the VM to work, there are frankly garbage pieces of code (for example, changing the value of two / three cells in places and returning everything to its original state in the cycle) .
12. Analysis of elements of logic into components.
Thus, it turned out that the cell value is obtained by performing three cycles, which can be clearly seen on the graph and the final block of finalization, which removes the array of indices immediately after the end of the third cycle.
Here in this picture I immediately selected them with red rectangles and repelled from this image throughout the entire VM logic parsing:
The two blue rectangles also highlight the reading cycles of the cell value, but since they read the values of the characters Login [0] and Login [1] (I learned this after analyzing all the cycles of the algorithm), then an index array of ones is not built in these two cases, the first cycle reads the value in cells 26 and 6, and in the second, the value from cell # 26 is returned.
The picture is not quite clearly visible (affects the zoom), to make it more clear, here is the second option, which shows the principle by which I circled the blocks with rectangles:
To check my guess, I checked myself and displayed on the graph the blocks in which the login and serial number fields change (the button “Show access to the buffer with login and SN”). For this button, the viewer will load the list of such procedures, created earlier by the tracer in ttCheckLoginBuff mode and show just such a picture:
Everything was as it was supposed in the previous image, the block from the left above is only knocked out of logic (circled by a blue rectangle), this is a piece of code that reads the values of the login and serial number from the external buffer, so it is not surprising that changes in these fields occur in it.
Here I concluded that apparently each of the vertical blocks is one of the stages of checking the serial number (the assumption also turned out to be true).
The next step was interesting to me, and where the decision on the correctness of the serial number is generally made, for this I reassembled the example “decompiled_vm_text.exe” in which I changed the value of the serial number to zero, and again took the track in ttWrongSN mode.
After all these steps, I looked at the differences of the route (the button “Show differences of the route with the wrong SN”) as a result saw the following:
You could say bingo.
At the very first operation (right vertical block), an exit occurred, and not all the procedures were completed (the block marked in red). So it is in it that the decision is made on the results of the first operation on the buffer with the login and serial number.
More precisely, there will be several such blocks in the end, for each operation it’s different, but you don’t have to disassemble their operation logic, since the meaning of all operations will be fairly transparent.
The next step I put breakpoints in the debugger at the beginning of each vertical block (which I had previously marked with rectangles), in order to understand in what order the operations are performed.
It turned out this list:
- vm_code_17AB
- vm_code_1A63
- vm_code_1E74
- vm_code_2333
- vm_code_28DA —
- vm_code_2AF3
- vm_code_2D27
- vm_code_2F41
Remaining, focusing on the graph, just go through all the selected places (skipping the already known elements of logic in which the login / SN symbol is taken) and analyze what operations are performed on these symbols.
I will not give ranges of procedures in which an index is created, a value is read, a value is returned and the index is removed. For simplicity, I will only show the name of the procedure of the first cycle (in which the construction of an index array of ones takes place).
Let us proceed to the analysis of logic:
1. vm_code_17AB
1.1 vm_code_1815 - read the value of SN [0] in cell # 6
1.2 vm_code_17AB_1880 add to cell # 6 the number 12
1.3 vm_code_1903 - read the value of SN [4] in cell # 7
As a result, the same number will be obtained in both cells (6, 7), thus we conclude that the first mathematical operation performs the following check: SN [4] = SN [0] + 12
2. vm_code_1A63
2.1 vm_code_1AD4 - read the value SN [0] in cell No. 6
2.2 vm_code_1B58 this value is transferred to cell No. 7
2.3 vm_code_1BC8 - read the value of SN [3] in cell No. 6
2.4 vm_code_1C4C value of cell No. 6 is added to cell No. 7 (result in 7)
2.5 vm_code_1A63_1C5A - cell №7 increased by the number 84
2.6 vm_code_1D12 - read SN [2] to the cell №6
As a result, both cells (6, 7) is obtained one and the same numbers, thereby de amu conclusion that the second mathematical operation produces the following test: SN [2] = SN [0] + SN [3] + 84
3. vm_code_1E74
3.1 vm_code_1EE8 - read the Login [0] value in cell # 6
3.2 vm_code_1F5B - transfer the value from 6 to 7 cell
3.3 vm_code_1FDD - read the Login value [1] in cell # 6
3.4 vm_code_204D - cell value # 6 is summed with cell No. 7 (result in 7)
3.5 vm_code_20CB - read the value of SN [4] in cell # 6
3.6 vm_code_214F - the value of cell # 6 is added to cell # 7 (result in 7)
3.7 vm_code_21C3 - read the value of SN [1] in cell # 8
as a result, in both cells (7, 8) one and the same number will be obtained, thus we conclude that the third mathematical operation performs the following check: SN [1] = Login [0] + Login [1] + SN [4]
4 . v m_code_2333
4.1 vm_code_239B - read the Login value [8] to cell # 7
4.2 vm_code_2493 - read the Login value [4] to cell # 6
4.3 vm_code_2517 - cell No. 6 value is added to cell # 7 (result in 7)
4.4 vm_code_2586 - read the Login value [ 2] in cell No. 6
4.5 vm_code_260A - the value of cell No. 6 is subtracted from cell No. 7 (the result is 7)
4.6 vm_code_2689 - we read the value of SN [5] in cell No. 6
As a result, in both cells (6, 7) we get the same -zhe number, so we conclude that the fourth mathematical operation produces the following test: SN [5] = Login [8] + Login [4] - Login [2]
5. vm_code_28DA - loop 10 pass all the symbols lo ins and summarize them with a cell №7
Roughly as a result of the fifth mathematical operation, the following code is executed:
Tmp := 0; for I := 0 to 9 do Inc(Tmp, Login[I]); // "Ms-Rem" $11 The sum of all login symbols will remain in cell number 7
6. vm_code_2AF3
6.1 vm_code_2bc5 — read SN value [8] in cell No. 6
As a result, the same number will be obtained in both cells (6, 7), thus we conclude that the sixth mathematical operation produces the following check: SN [8] = Tmp (sum of all login numbers)
7. vm_code_2D27
7.1 vm_code_2D27_2D29 - 72
7.2 vm_code_2DD5 is added to cell # 7 ; we read the value of SN [9] in cell # 8
As a result, in both cells ( 7, 8) we get the same number, so we conclude that the seventh mathematical operation produces the following check: SN [9] = Tmp (sum of all login numbers) + 72
8. vm_code_2F41(at the moment of calling this procedure, the sum of the login numbers will be in cell No. 18)
8.1 vm_code_2FA1 - read the value of SN [6] in cell No. 6
8.2 vm_code_2F41_300C - cell No. 6 is increased by the number 51
8.3 vm_code_3071_307D + vm_code_308B toss Tmp in cell No. 7
8 vm_code_30AA - the value of cell No. 7 is added to cell No. 6 (the result is 6)
8.5 vm_code_311D - we read the value of SN [7] in cell No. 7
As a result, the same number will be obtained in both cells (6, 7), thus we do the conclusion that the eighth mathematical operation makes the following check: SN [7] = SN [6] + 51 + Tmp
That's actually the whole algorithm hidden in video Rtualnoy machine, in full view.
This is how its source code will look like:
program keygenme_source; {$APPTYPE CONSOLE} {$R *.res} uses Windows, Math; function CheckSerial(const ALogin, ASerial: AnsiString): string; const ValidSN = 'Congratulations!!! It is valid serial!'; InvalidSN = 'Serial invalid :('; var Login: array [0..9] of Byte; Serial: array [0..9] of Byte; I, A, B, Tmp: Byte; Checked: Boolean; begin ZeroMemory(@Login[0], 10); Move(ALogin[1], Login[0], Min(10, Length(ALogin))); // for I := 0 to 9 do begin A := Byte(ASerial[1 + I * 2]); B := Byte(ASerial[2 + I * 2]); if A > $39 then Dec(A, $37) else Dec(A, $30); if B > $39 then Dec(B, $37) else Dec(B, $30); A := A shl 4; Serial[I] := A or B; end; // Checked := True; // if Serial[4] <> Byte(Serial[0] + 12) then Checked := False; // if Serial[2] <> Byte(Serial[0] + Serial[3] + 84) then Checked := False; // if Serial[1] <> Byte(Login[0] + Login[1] + Serial[4]) then Checked := False; // if Serial[5] <> Byte(Login[8] + Login[4] - Login[2]) then Checked := False; // Tmp := 0; for I := 0 to 9 do Inc(Tmp, Login[I]); // if Serial[8] <> Tmp then Checked := False; // if Serial[9] <> Byte(Tmp + 72) then Checked := False; // if Serial[7] <> Byte(Serial[6] + 51 + Tmp) then Checked := False; // if Checked then Result := ValidSN else Result := InvalidSN; end; begin Writeln(CheckSerial('Ms-Rem', 'C38FB7A0CF38F73B1159')); Readln; end. Well ... almost all, the last third envelope is removed.
Left just a little bit.
13. We write the generator of serial numbers.
In the keygenme task, the condition went on - it is necessary to zakigenit write an algorithm that will generate a serial number based on the entered login.
Having on hand the algorithm for checking the serial number to do it is quite trivial.
If you look at the fields of the serial number, you can see that SN [0], SN [3] and SN [6] are not checked, they only participate in checking the values of other fields. Therefore, these three fields can contain absolutely any values, and the remaining fields will be calculated on their basis.
Thus, the generator code will look like this:
program serial_generator; {$APPTYPE CONSOLE} {$R *.res} uses Windows, Math, SysUtils; function GetSN(const ALogin: AnsiString): string; var Login: array [0..9] of Byte; Serial: array [0..9] of Byte; I, Tmp: Byte; begin ZeroMemory(@Login[0], 10); Move(ALogin[1], Login[0], Min(10, Length(ALogin))); Randomize; // Serial[0] := Random(255); Serial[3] := Random(255); Serial[6] := Random(255); // Serial[4] := Serial[0] + 12; // Serial[2] := Serial[0] + Serial[3] + 84; // Serial[1] := Login[0] + Login[1] + Serial[4]; // Serial[5] := Login[8] + Login[4] - Login[2]; // Tmp := 0; for I := 0 to 9 do Inc(Tmp, Login[I]); // Serial[8] := Tmp; // Serial[9] := Tmp + 72; // Serial[7] := Serial[6] + 51 + Tmp; // HEX Result := ''; for I := 0 to 9 do Result := Result + IntToHex(Serial[I], 2); end; begin Writeln(GetSN('Rouse_')); Readln; end. As a result, here is a small list of serial numbers for the login "Rouse_":
- 5E2BB2006AF04EEE6DB5
- C5929D84D1F0F9996DB5
- BC894434C8F0BA5A6DB5
- 14E19B3320F0B2526DB5
Keygenme resolved.
14. Conclusions
Let’s go through the stages again and remember which methods were used to hide the serial number check algorithm:
1. Resetting the entry point to zero is a controversial method, moreover, antiviruses will be looked at with suspicion because the usual ones the compiler will never generate such an executable file, it means that someone has modified it, which is a signal for the antivirus.
2. Encryption of the body of an executable file is not in principle punishable, but as was shown above, such encryption is removed quite simply and does not constitute a serious obstacle.
3. The decryptor code abundantly diluted with garbage is a controversial decision; it is rather simply removed due to the fact that garbage blocks were not used as garbage. Well, for example, instead of the ADD EAX, 2 instruction, you can write such a garbage block (the first thing that came to mind):
asm inc eax // // push eax lea eax, @label inc eax xchg eax, [esp] call @label @label: ret // inc eax // end; Such a garbage unit is no longer removed on the machine with a script that detects the absence of changes in the registers, since each instruction in reality will change their meaning.
If it is well podshamanit over such a block and inflated to a large size, then it will be quite difficult to determine the beginning and end of the garbage. Moreover, there is always a stack available, retaining the value of registers on it can, as garbage, even prove Fermat's theorem until you get bored, and then just restore the values of the registers and continue the program :)
4. Virtual machine - due to unprotected handlers (VM instruction handlers) to write its equivalent did not take much time. For good in the combat application, the VM handlers must be qualitatively obfuscated in order to make it difficult to understand the logic of the VM operation. It is clear that for keygenme this stage is superfluous, but one should not forget about such subtlety.
5. The logic of the P-Code operation - despite the presence of clearly garbage instructions, the basic algorithm for receiving data from the buffer with login / SN turned out to be the same at all stages, which made it possible to quickly disassemble all the logic based on the template. If several variants of data acquisition were introduced (and a unique variant for obtaining each symbol would be better), this would greatly complicate the analysis.
6. VM analysis would be complicated at times if inside the P-Code there was another virtual machine (say, based on the same Brainfuck) that would interpret its own P-Code.
What is the result:
A very high-quality keygenme, perfectly showing the work with the virtual machine. The only nuance to which he does not give an answer is how the P-Code was obtained for the virtual machine that it executes :)
This stage is individual for each developer, each one uses his own methods, however, I have an article on the implementation of the picode generation algorithm , true for a slightly different type of VM.
For my part, I showed one of the options for hacking such VMs, without the deobfuscation stage of an acm listing, using VM execution graphs as a toolkit.
I think it will be able to help you in analyzing your own VM implementations for their resistance to this hacking option.
Well, if you have not yet come to the actual implementation of the VM, at least now you have a minimal idea of how it can work.
The source code of demos for an article can be collected at this link: http://rouse.drkb.ru/blog/vm_analize.zip
Draw conclusions and good luck.
Source: https://habr.com/ru/post/218887/
All Articles