Navigator for the project: MS Project + formulas + indicators
The plan is not an ideal picture, but project navigation.
Why when you drive a car and get into a traffic jam that has just arisen, then your navigator recalculates the route and time of driving on it, and by managing the project, you refuse such a useful tool?
When the real picture of the project develops not as planned, then its head begins to build other routes in his head and ceases to focus on the original plan.
I am also sure that you know the following opinion. A plan is an ideal scenario, in reality everything is different, therefore it is impossible to focus on a plan. The authors of such abstracts under the phrase "project plan" mean only the original plan ( Basic Plan ). But I note that the project should also have a different plan - the Work Plan , which will take into account all changes in the project and be your project navigator. Such a tool will show you:
- Current schedule of all tasks
- Narrow places
- Project (stage) completion forecast
Using the recommendations provided in the article, you will learn how to easily revive your work schedules, find problem areas, predict the achievement of the final goal. Thus, you will qualitatively improve your planning and control skills, which will increase your efficiency by at least 20%!
Setting task statuses
Once you need to configure the program (MS Project), using the formulas given at the end of the article, and graphical indicators.
Then you can regularly use a simple and effective tool.
So, consider the status of tasks that we have to configure.
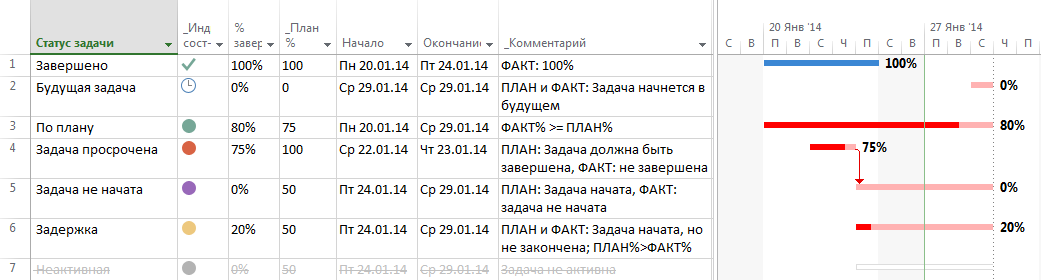
- Completed
The task is 100% complete. - Future challenge
The task will be carried out in the future, as planned, and in fact. - According to the plan. The task is not lagging behind. It is executed, but its actual completion percentage is greater than planned. For example, there is a task lasting 10 days. After 5 days, it is performed on "90%", and according to the plan it should be performed only by half (50%)
Task groups with delay: - Delay
The task is being carried out, but the actual percentage of its completion is lower than the planned one. For example, there is a similar task lasting 10 days. According to the plan, after 9 days, the task should already be completed by “90%”, and in fact it is completed only by half (50%). This is a special case of a simple version of the task with a delay, when the task according to the plan should not be completed yet, but the actual progress is less than planned. - Task expired
This is a special case of delayed tasks. According to the plan, such a task should be completed (100%) at the time of the reporting date, but in fact this task is not completed (<100%). - Task not started
This is a special case of delayed tasks. According to the plan, such a task should be started (> 0%) at the time of the reporting date, but in fact this task has not yet been started (0%). - Inactive task
Such tasks are rarely, but sometimes they are found in the schedules, so you need to set an appropriate indicator for them so that the program does not mislead you. For example, a task may be overdue, and in fact it cannot be such, since it is not required to perform it.
Task analysis
- Status "Completed"
It is recommended to mark such tasks in front of the project team in order to show the progress of approaching the intended goal, thereby increasing the positive motivation of the team members.
It is not recommended to spend time on the “project committees” in order to report in detail to the curator or the customer on the work done. At such meetings it is much more effective to discuss problems, risks and upcoming plans for the near future. - Status "Future Task"
It makes no sense to analyze all the tasks that will begin in the future. However, it makes sense to pay attention to the tasks that will begin in the near future. (For this it is convenient to apply filters, but about this in another article). - Status "Task expired"
Important. Planners consider it a crime when you have such tasks in your plan! For such tasks, a forecast of completion should always be provided. - Status “Task not started”
Important. Since the start of such tasks is overdue, it is necessary to request a forecast for the start of execution. In practice, it is often the case that the start of such tasks depends on the completion of overdue tasks or on running tasks that are not included in the plan. - Status "Delay"
In practice, they often do not pay attention to tasks that should not yet be completed, but it would not be superfluous to clarify with the implementers whether the task will be completed by the target date. In the case of a negative answer, you need to request a termination forecast so that the task is not subsequently overdue.
Practical use of indicators
Indication is a partial automation of the project control process. Indicators instantly signal task status to plan users. Instead of counting task statuses in your head, the program does it for you. Then, when working on problem tasks, you get a “live” work schedule, which will be the navigator for your project.
')
Algorithm update plan
I strongly recommend regularly monitoring the progress of the project. It should be done once a week or 2 times a week. In the process of control you need to follow the algorithm:
- Collect and complete task completion percentages
- Request and make predictions of the end of tasks with the status “Task Overdue”
- Request and set forecasts for the start of tasks with the status “Task not started”
- Include in the plan forgotten work that inhibits the implementation of "not started" tasks
As a result, you will always have an up-to-date plan (project schedule) and predictions of the onset of final events (project completion, stage).
Typical examples
For all examples, the beginning is the same. You put down the percentages of the work. Then the program automatically calculates task statuses. The following examples show how to work with this information.
Example 1
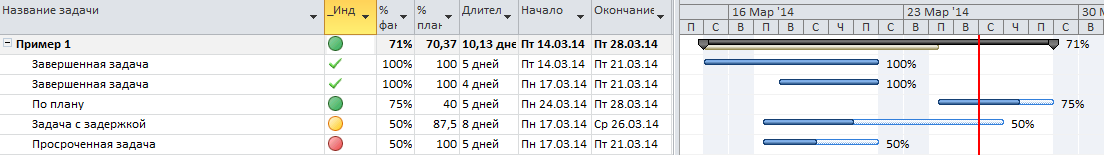
We see that there are completed tasks in the plan - we praise the executors for this, as well as overdue tasks (how to proceed, see Example 2 below).
Example 2
Problem

In the plan there are overdue and not started tasks.
For example, the task of developing the design of internal pages is not completed (an overdue task ), so the coder cannot proceed to his task ( not started task ).
Decision
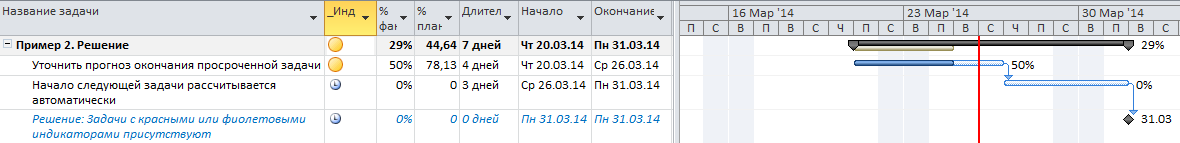
It is necessary to clarify with the designer when the rendering of the layouts will be completed and when they will be transferred to the typesetter. The start date of the layout is automatically calculated by the program.
As a result, the plan will not have overdue and not started tasks.
Example 3
Problem

In the plan there are overdue and not started tasks.
For example, you have a number of completed tasks, but the subsequent tasks on integration with the adjacent customer system have not yet been started.
Decision
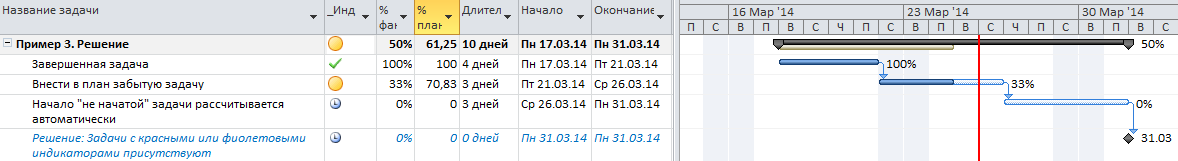
As it turned out, you cannot start work on the integration, because the customer has not transferred to you the unloading from the database and the details for integration. Initially, the plan did not mark the client’s task of providing this data, and the result that should be provided to start the integration work was not noted. This information was kept in mind, everyone was hoping for the customer, because this is his job.
Therefore, in this situation, it is necessary to add this task and the milestone on providing the result to start the next task in the Plan. If these tasks had been planned in advance, the customer’s “kicking” would have started much earlier.
As a result, the plan will not have overdue and not started tasks.
Project (stage) completion forecast
One of the purposes for which the plan is updated is to obtain a forecast for the completion of the project (stage or other control event). This article will not discuss the use of a baseline to measure the deviations of each task. However, using one simple MS Project option, you can always get information about the rejection of control events.
Council During initial planning, set a “Deadline” for large total tasks (such as a total project / stage task) and / or control milestones. To do this, go to the "Task Details", go to the "Advanced" tab and set the "Deadline" in it. In the diagram, it will be marked with a green arrow. With respect to this point, you will always measure the deviation.

Comment
The examples above do not address the question of how much percent is the deviation of the tasks. I recommend decomposing tasks for tasks no longer than the reporting period. For example, you have a meeting on the status of a project once a week, which means that the duration of the task should not exceed 5 working days if possible. In this case, it will not be so important, the deviation is 20% or 34.5%. You will focus on the results of small tasks, rather than the percentage of long-term tasks that are not so easy to measure.
Formulas
Integrated rejection status of tasks relative to the Plan
IIf(Not [];"";
IIf([% ]=100;"";
IIf([];
Switch(
([% ]<100) And ([]>[ ]);" ";
([% ]<100) And ([]=[ ]);" ";
([% ]<100) And ([]<[ ]);" ");
Switch(
(IIf(ProjDateDiff([];[ ])>0;100;ProjDateDiff([];[ ])/[]*100)<=[% ]) And ([]<=[ ]);" ";
[]>[ ];" ";
([% ]<100) And []<[ ];" ";
([% ]=0) And ([]<=[ ]) And ([]>=[ ]);" ";
(IIf(ProjDateDiff([];[ ])>0;100;ProjDateDiff([];[ ])/[]*100)>[% ]) And ([]>=[ ]);"")
)
)
)
Planned percent of completion of tasks
Used in the above formula. However, I single it out separately; you may need to build other formulas.
IIf([];
IIf([]>=[ ];0;100);
IIf([]>=[ ];0;
IIf(ProjDateDiff([];[ ])>0;100;ProjDateDiff([];[ ])/[]*100)
)
)
Comment. For total tasks, this percentage is not always calculated in view of the limited capabilities of MS Project in using formulas for total tasks.
Source: https://habr.com/ru/post/218885/
All Articles