How long can you be mistaken thinking that Foglight will promptly report a problem with memory loading
If you know that feeling of confidence when you know what is happening, you know that everything is under control, then you may be familiar with the feeling when it turns out that this is far from being the case. In this post, I will talk about how I sat on a flat surface in a puddle, why it happened and what kind of work was done on the bugs. It's about Quest Foglight and the built-in memory check rule.

In my first article, I described how the Quest Folight monitoring system was commissioned in our department. A couple of weeks ago, after the next release, complaints started about the fact that one of the services was clogging up the memory and arranging problems in the form of “system out of memory exception” to our customers. So we are dealing with a banal memory leak. Why is the monitoring silent, because in fact the memory was clogged up gradually and all the thresholds for triggering the rule were passed during the day? At least two times we should have received an alert, but this did not happen. Let's try to figure it out together.
')
In the picture you see the VMW Virtual Machine Memory Utilization rule and the fact that the rule covers the VMWVirtualMachineMemory topology. So far, everything is correct and nothing portends a trick.
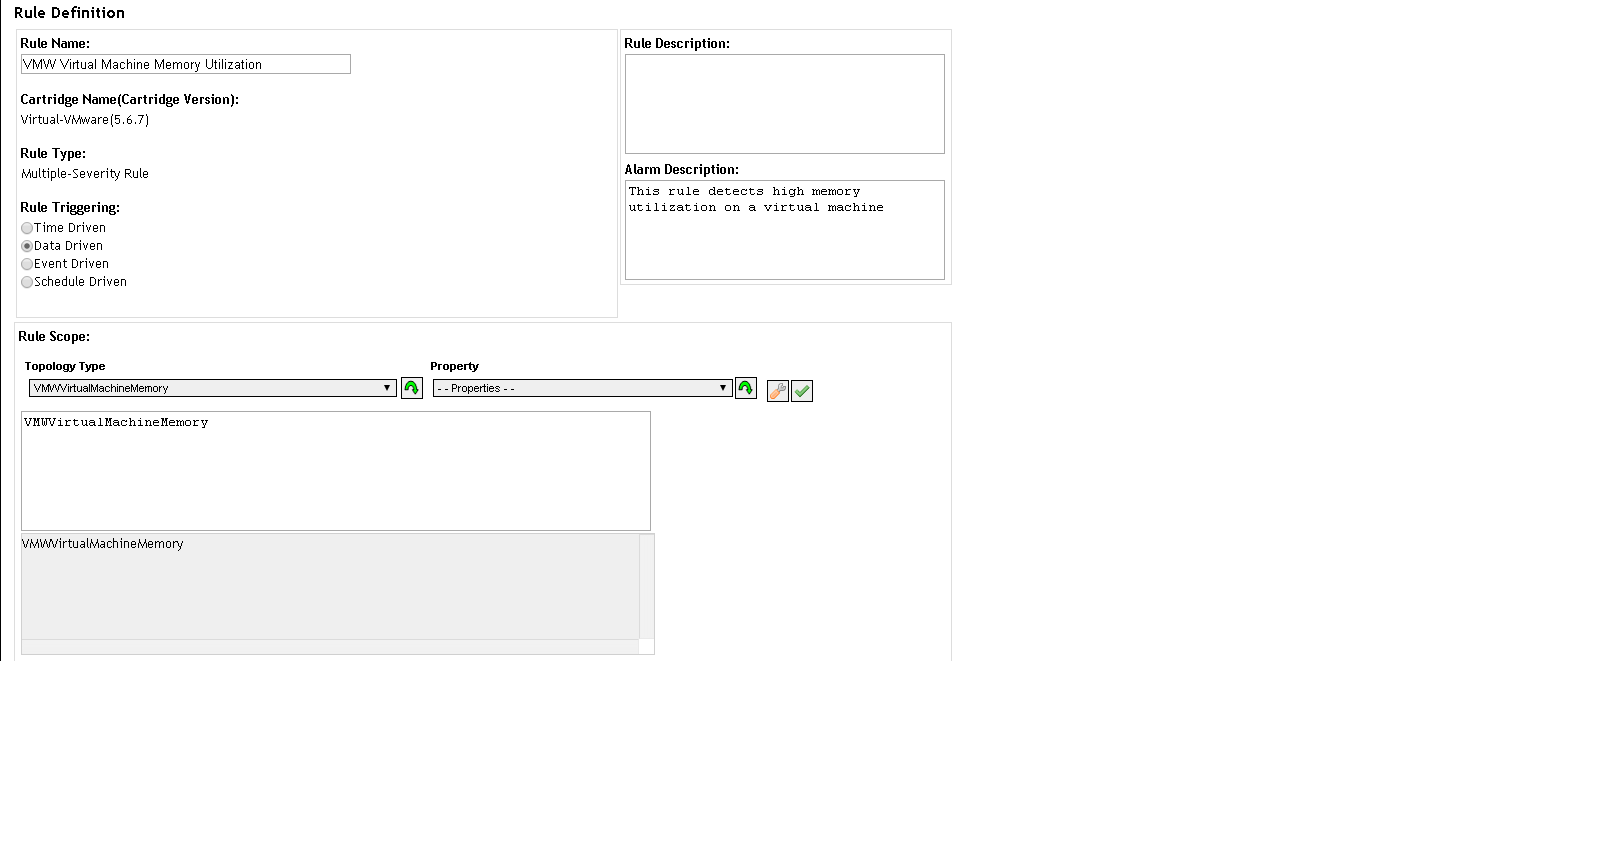
Now take a look at one of the thresholds. We are interested in the line "#utilization from $ scope.hostMemory #. Scope, in this case, we have VMWVirtualMachineMemory from the previous picture. Still, there is no trick, but it is there.

If you already understand what's the matter, then you know more about vCenter than I do. Where is the problem? The problem was found in the analysis of what feeds vCenter as statistics. From this link you can learn about the various metrics that can be learned from the vCenter. What we used all this time turned out to be nothing more than Active Memory. If you don’t want to follow the links, here’s a quote: “It’s actively used as a guideline.” Those who already laugh at this are right. What is a memory leak? A memory leak is like a hamster; it takes seeds of itself and lays it behind the cheek, but at the same time it does not take any active actions with them. This means that if the load rises gradually, and not abruptly, then our rule will not work! That is why we consistently received alerts when we tested this rule with memtest and did not receive anything during a leak.
Then we opened the case with the supplier and received confirmation that yes, we are right of course, but there is no alternative to get the required information from the VMware cartridge. We were recommended to use host agents as an alternative to obtain the required information. I am sure that many have never used this monitoring system and are not aware of an absolutely wild approach to collecting data from the operating system. There is simply no mechanism for importing or automatically adding machines to the system. It is required to manually add each, spending an average of one and a half minutes. Needless to say that no one wants to manually add a few hundred virtual locks, and even then you have to keep track of what they have deleted and what they added.
The solution was a few scripts written in powershell. One constantly checks and compares the list of included virtuals where there is a non-zero IP. The second one is connected directly to the virtual machines via WMI and collects what is required. Immediately I confess that I am not an expert on powershell and therefore I submit my scripts for review only as an introduction - there is nothing to boast about. It is enough to mention that I was not able to master the powershell jobs at once, although the understanding of the fact that it was necessary to parallelize - the script consistently checking a couple of hundreds of virtual machines took 10 minutes, is not the best way to collect data. Now these scripts collect data for Foglight for me, and already in it I create rules and reports, although you could do it right in the script, but then there would be no beautiful display of data on the big screen.
Here is the data collection script. Nothing phenomenal. Some had to be cut out - there are different specifics of our environment.
Constructive criticism is welcome.
In my first article, I described how the Quest Folight monitoring system was commissioned in our department. A couple of weeks ago, after the next release, complaints started about the fact that one of the services was clogging up the memory and arranging problems in the form of “system out of memory exception” to our customers. So we are dealing with a banal memory leak. Why is the monitoring silent, because in fact the memory was clogged up gradually and all the thresholds for triggering the rule were passed during the day? At least two times we should have received an alert, but this did not happen. Let's try to figure it out together.
')
In the picture you see the VMW Virtual Machine Memory Utilization rule and the fact that the rule covers the VMWVirtualMachineMemory topology. So far, everything is correct and nothing portends a trick.
Now take a look at one of the thresholds. We are interested in the line "#utilization from $ scope.hostMemory #. Scope, in this case, we have VMWVirtualMachineMemory from the previous picture. Still, there is no trick, but it is there.
If you already understand what's the matter, then you know more about vCenter than I do. Where is the problem? The problem was found in the analysis of what feeds vCenter as statistics. From this link you can learn about the various metrics that can be learned from the vCenter. What we used all this time turned out to be nothing more than Active Memory. If you don’t want to follow the links, here’s a quote: “It’s actively used as a guideline.” Those who already laugh at this are right. What is a memory leak? A memory leak is like a hamster; it takes seeds of itself and lays it behind the cheek, but at the same time it does not take any active actions with them. This means that if the load rises gradually, and not abruptly, then our rule will not work! That is why we consistently received alerts when we tested this rule with memtest and did not receive anything during a leak.
Then we opened the case with the supplier and received confirmation that yes, we are right of course, but there is no alternative to get the required information from the VMware cartridge. We were recommended to use host agents as an alternative to obtain the required information. I am sure that many have never used this monitoring system and are not aware of an absolutely wild approach to collecting data from the operating system. There is simply no mechanism for importing or automatically adding machines to the system. It is required to manually add each, spending an average of one and a half minutes. Needless to say that no one wants to manually add a few hundred virtual locks, and even then you have to keep track of what they have deleted and what they added.
The solution was a few scripts written in powershell. One constantly checks and compares the list of included virtuals where there is a non-zero IP. The second one is connected directly to the virtual machines via WMI and collects what is required. Immediately I confess that I am not an expert on powershell and therefore I submit my scripts for review only as an introduction - there is nothing to boast about. It is enough to mention that I was not able to master the powershell jobs at once, although the understanding of the fact that it was necessary to parallelize - the script consistently checking a couple of hundreds of virtual machines took 10 minutes, is not the best way to collect data. Now these scripts collect data for Foglight for me, and already in it I create rules and reports, although you could do it right in the script, but then there would be no beautiful display of data on the big screen.
Here is the data collection script. Nothing phenomenal. Some had to be cut out - there are different specifics of our environment.
Hidden text
$csv = Import-Csv .\Inv.csv #Load inventory foreach ($server in $csv){ if ($server."Domain Name" -like "**"){ #This limits the number of concurrently running jobs. Set number of jobs and sleep timer here. While ($(Get-Job -state running).count -ge 50){ Start-Sleep -Milliseconds 250 } Start-Job -scriptblock { param($ipAddress, $hostName, $domainName) $return=@() $Memory=Get-WmiObject win32_operatingsystem -ComputerName $ipAddress | Foreach {"{0:N2}" -f ((($_.TotalVisibleMemorySize - $_.FreePhysicalMemory)*100)/ $_.TotalVisibleMemorySize)} $return=New-Object PSObject $return|Add-Member -MemberType "NoteProperty" -Name "ipAddress" -Value $ipAddress $return|Add-Member -MemberType "NoteProperty" -Name "memoryUtilization" -Value $Memory $return|Add-Member -MemberType "NoteProperty" -Name "hostName" -Value $hostName $return|Add-Member -MemberType "NoteProperty" -Name "domainName" -Value $domainName if ($error[0]) { $return|Add-Member -MemberType "NoteProperty" -Name "Error" -Value $error[0] } else { $return|Add-Member -MemberType "NoteProperty" -Name "Error" -Value "NA" } $return } -ArgumentList ($server."IP Address", $server."VMName".toUpper(), $server."Domain Name".toUpper()) } } Get-Job | Wait-Job -Timeout 30 $recievedObject = Get-Job | Receive-Job Get-Job | Remove-Job -Force #start building folight observation set Write-Output "TABLE WMI" foreach($observation in $recievedObject) { Write-Output "START_SAMPLE_PERIOD" Write-Output "host.String.id = $($observation.hostName).$($observation.domainName)" Write-Output "ipAddress.String = $($observation.ipAddress)" Write-Output "physicalMemoryUsed:percent = $($observation.memoryUtilization)" Write-Output "error.StringObservation.obs =$($observation.Error)" Write-Output "END_SAMPLE_PERIOD" } Write-Output "END_TABLE" Constructive criticism is welcome.
Source: https://habr.com/ru/post/218843/
All Articles