Using the PerfView utility in customer support
One of the stages of processing the application from the user in our support service is to reproduce the problem. Difficulties with reproduction arise for various reasons: the user cannot always provide an example of an application where the incorrect behavior of the code manifests itself, or the problem may be specific to a particular environment. Today, a huge number of software, hardware configurations and virtual environments are used in which programs written with our components work. The screen width in pixels can vary five times (from 800 to 4k). And configurations may differ by other parameters: memory size, number of displays, DPI, security settings, video card and its drivers. This diversity provides a steady stream of requests from customers specific to a particular configuration. For example, the problem is reproduced only on a specific version of Windows, or only on certain DPI settings, or if the user has three monitors. To solve this problem for several years, our support service has been using the Microsoft PerfView utility. If all other ways to reproduce the problem are exhausted, we give the user a simple instruction on how to start the trace and send us the resulting file. Tracing information helps to understand exactly what causes the problem.
This article will discuss the possibilities of using PerfView in technical support and the limitations of this utility.
Initially, PerfView was created for internal use and used by Microsoft to optimize Windows, .NET CLR and Visual Studio performance. The utility uses the Windows kernel tool - ETW (event tracing for windows)
In order to correctly interpret the trace results, it is important to understand how this utility works. Any program can be represented as a directed graph, the vertices of which are methods. Then the stack of the program at any time will be the path from the main () method to the method that is currently running.
')

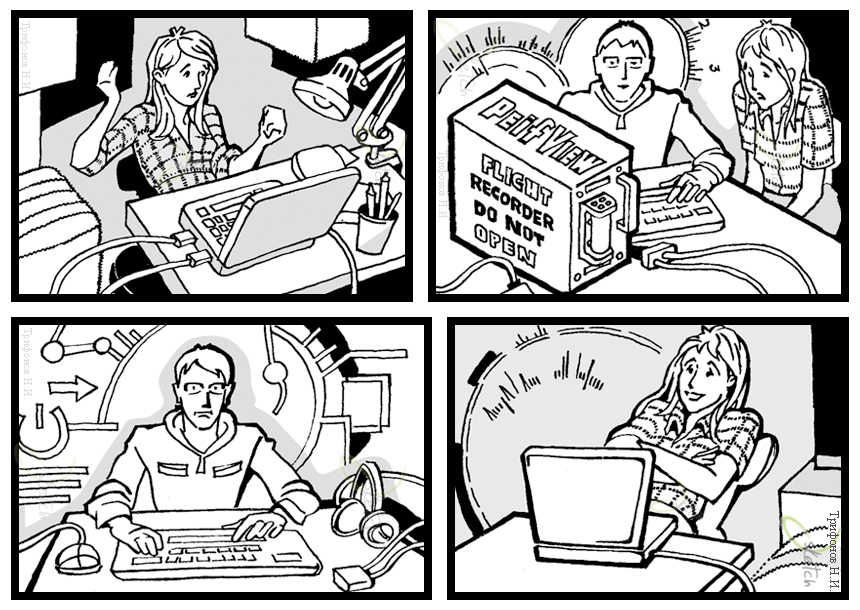
In the ideal case, to analyze the operation of this program, it is necessary to have information about its state at each time point. For example, this information is provided by debugging. But, first, the debugger has an impact on the process being debugged and the data obtained may be unreliable. Secondly, asynchronous calls are becoming more common, which debuggers do not analyze well enough. For many tasks, there is no need for information about the state of the program being analyzed at any given time. You can take snapshots of the program at regular intervals. The figure shows the timing diagram of a simple program in one thread. The time axis at the bottom of the diagram is divided into equal periods of time, multiples of the processor clock cycle. Stacked stacks are unavailable for gray segments, and available for green ones.

Based on this idea, the PerfView profiler was created. After certain, rather short periods of time, a snapshot of the stacks of all processes on the machine is taken. PerfView can download symbols from the Internet, is small in size and is transferred to another machine by simple copying. This makes PerfView a powerful tool for analyzing the operation of any programs on any Windows machine. In addition to stack count, system events, .NET events, and much more are stored. This information often helps to understand the essence of the problem and find a solution.
Consider the typical situations where PerfView may be useful for technical support:
1. The application freezes at the user. This is the simplest thing that can be. The stack count that causes the hang is guaranteed to be contained in the trace.
2. The application stops working with an error. At the same time, Windows suspends the problematic process and calls the debugging process dwwin.exe for it. This call takes time much longer than the time between shots, so you can safely say that the stack of the fall will also fall into the trace.
3. The application does not work as expected. For example, in some configurations, the application may flicker unpleasantly when the window is resized. In this situation, it is necessary to compare the results of the traces with the “good” and “bad” configurations.
4. Poor application performance on the user's machine. PerfView was originally created as a performance profiler. In this case, the utility is used for its intended purpose.
Of course, PerfView will not be useful in situations where the problematic code is manifested for a time that is shorter than the interval between images and does not repeat.
Example
It is proposed to analyze the work of a simple WPF application that draws lines on the screen when it is played with a finger, drawing with the mouse is also supported. The finished application was taken from here.
This is the application being analyzed:
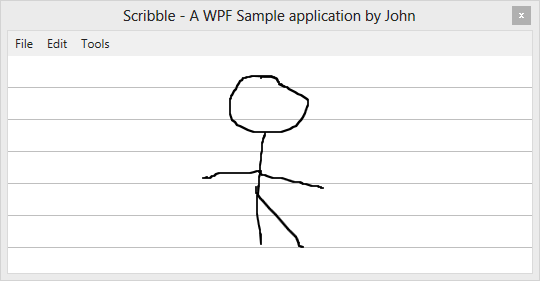
Task: estimate the delay time from input to display the line on the screen, examine the delay time for the following scenarios
1. The application launches the Acer Iconia W3 810 tablet. Touch input is used.
2. Remotely launch the application on Acer Iconia W3 810 and use mouse input instead of touch input.
Cheap and weak tablet from Acer is not chosen by chance. It is rather slow and has little memory in order to run some other, more demanding software developer.
We start by collecting data for analysis. In the main PerfView window, press Alt + C. A dialog will appear.
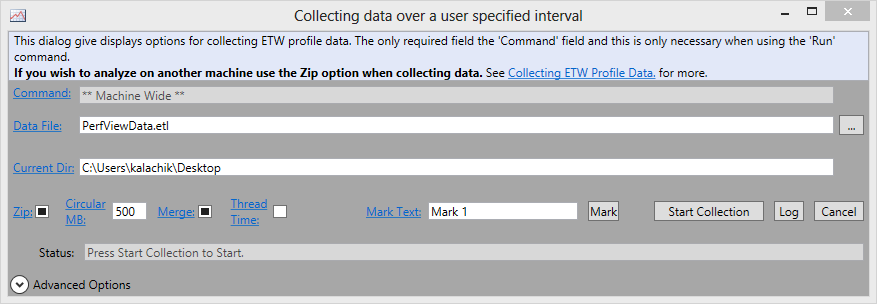
We leave the options as they are, click Start Collection. In order not to analyze too much, it is advisable to reduce the number of actions during data collection. For example, you can run the analyzed program in advance, if you are not interested in what happens when it starts. We draw several lines and click Stop Collection. It’s not convenient to analyze on a small tablet screen, so we transfer the resulting * .etl file to a large computer. To analyze the trace, you need pdb files for assemblies that were installed on the machine at the time of the trace. PerfView puts them in the archive with the etl file if you run Collect-> Merge. The latest version of the utility does it by default, in earlier versions it was necessary to remember this. Open the received file.
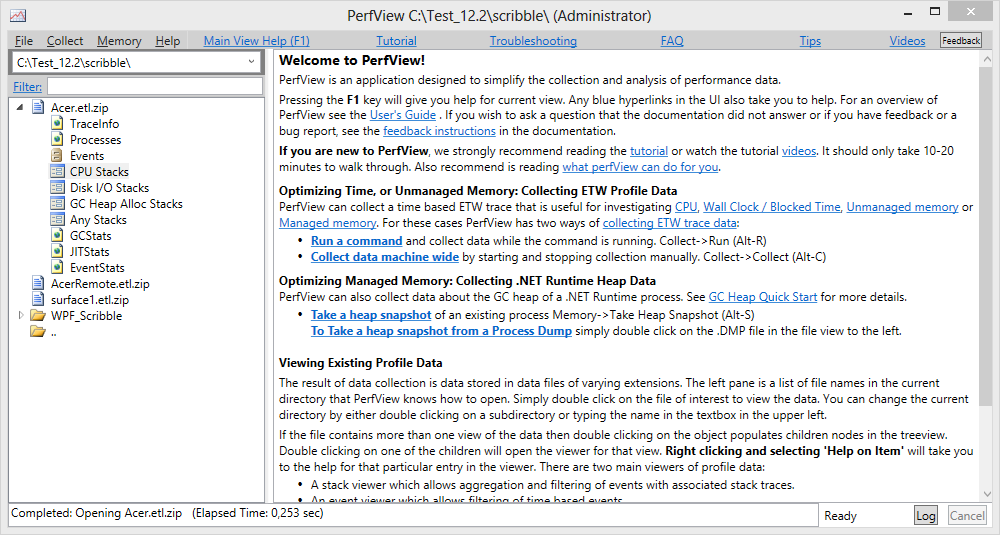
There is a lot that can be told here, but now we select CPU Stacks and see all the processes that were running on the tablet at the time of the trace.
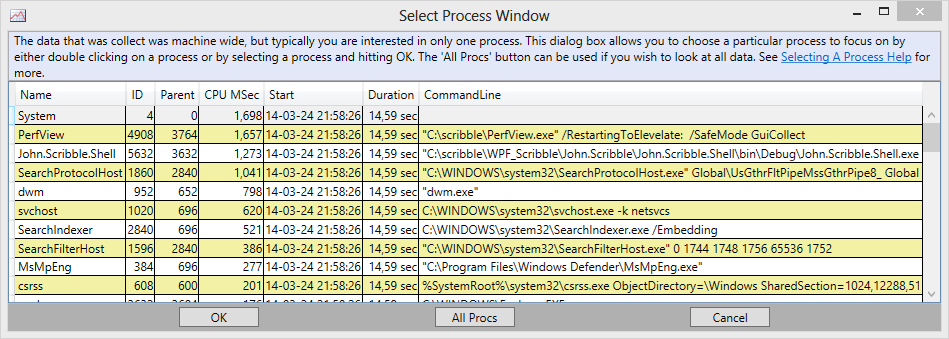
You can see any of them. This makes PerfView a useful tool for analyzing cross-process interactions. The third process above is ours. Choose it, get it.
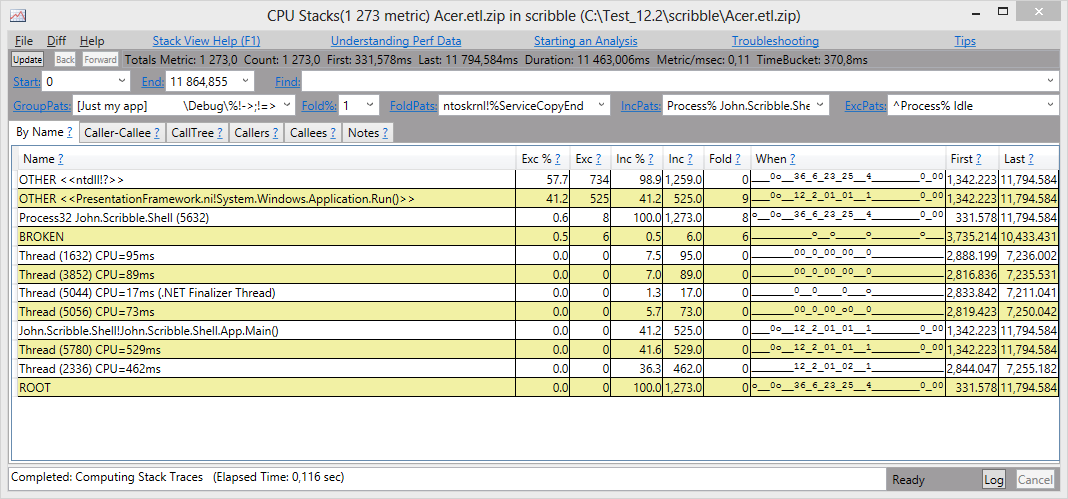
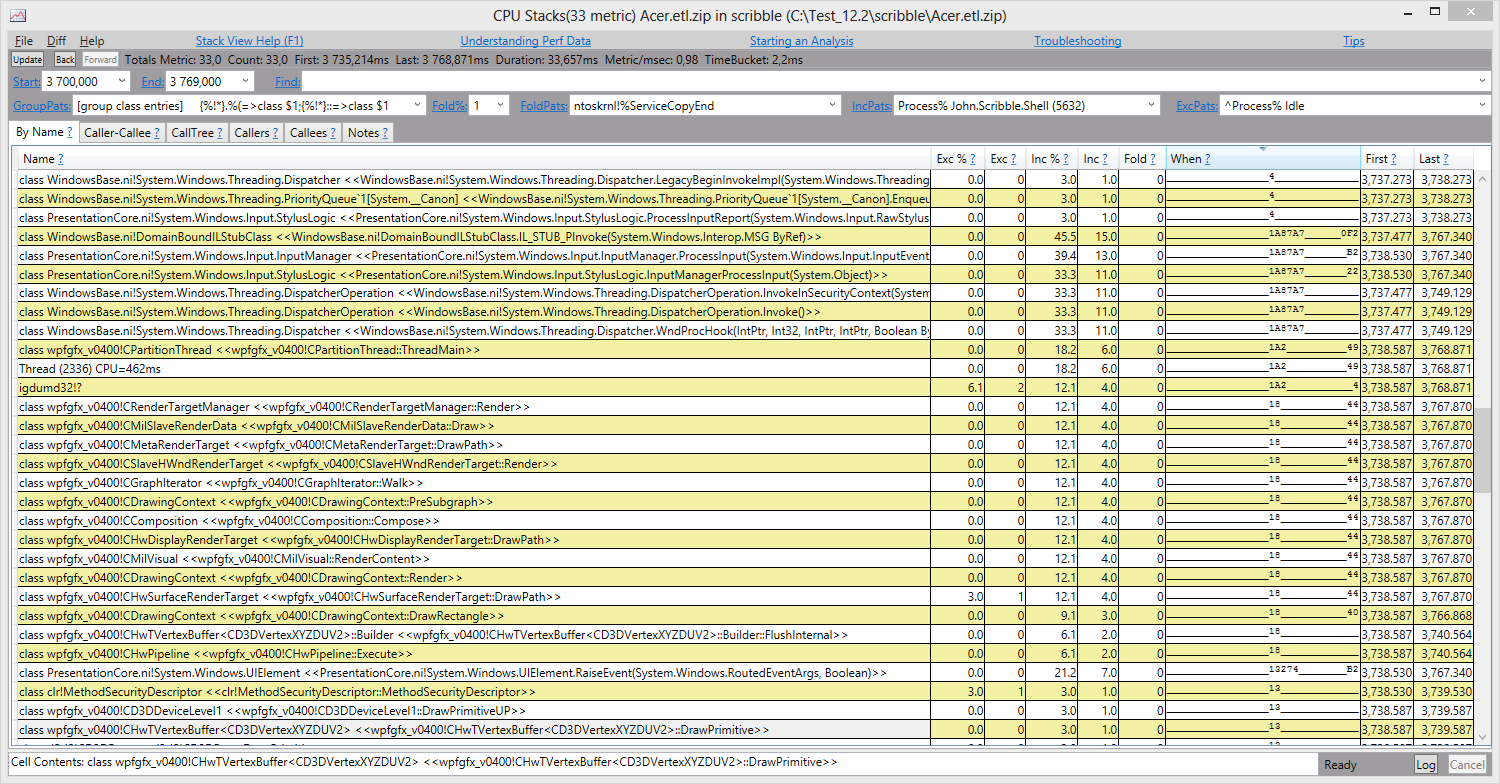
The When column displays numbers on the time axis. The smaller the number, the less processor resources were consumed. A dash in this column means that the stacks with this method did not fit into the trace at the appropriate points in time. There are five bursts of activity. When tracing drew five lines. GroupPats is best set to Group class entries. In this mode, the table line will correspond to the method.
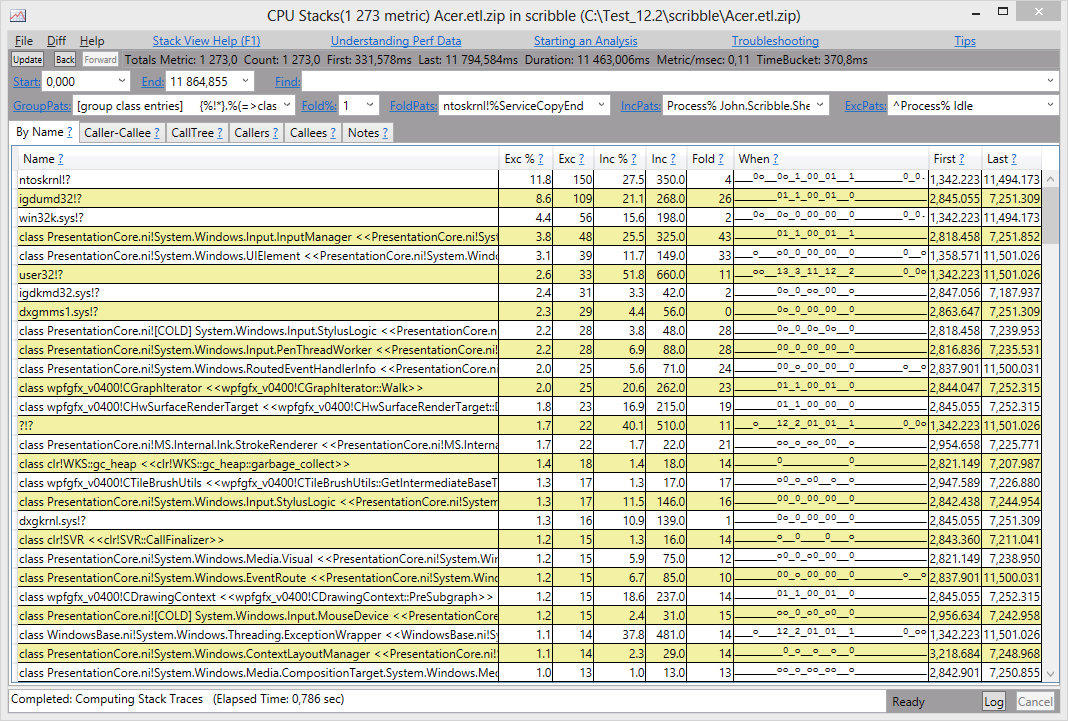
PerfView shows several hundred methods in the table, although there are many more. Therefore, to see a more complete picture, it is important to reduce the time interval when analyzing the trace data. As we already guessed, bursts of activity on the time axis correspond to drawing lines. Choose a second burst; To do this, select the characters in the When column, and PerfView will prompt the beginning and end of the interval, which must be entered into the Start and End fields. The following view corresponds to the beginning of the line drawing. At the beginning of the time period, the application process did nothing. If we order the methods by the When column, we get:
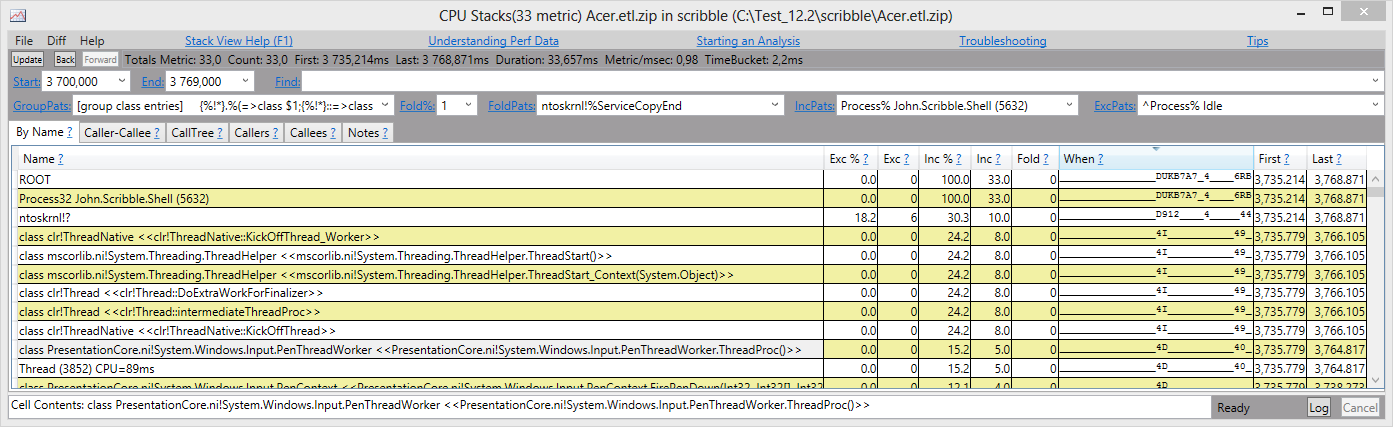
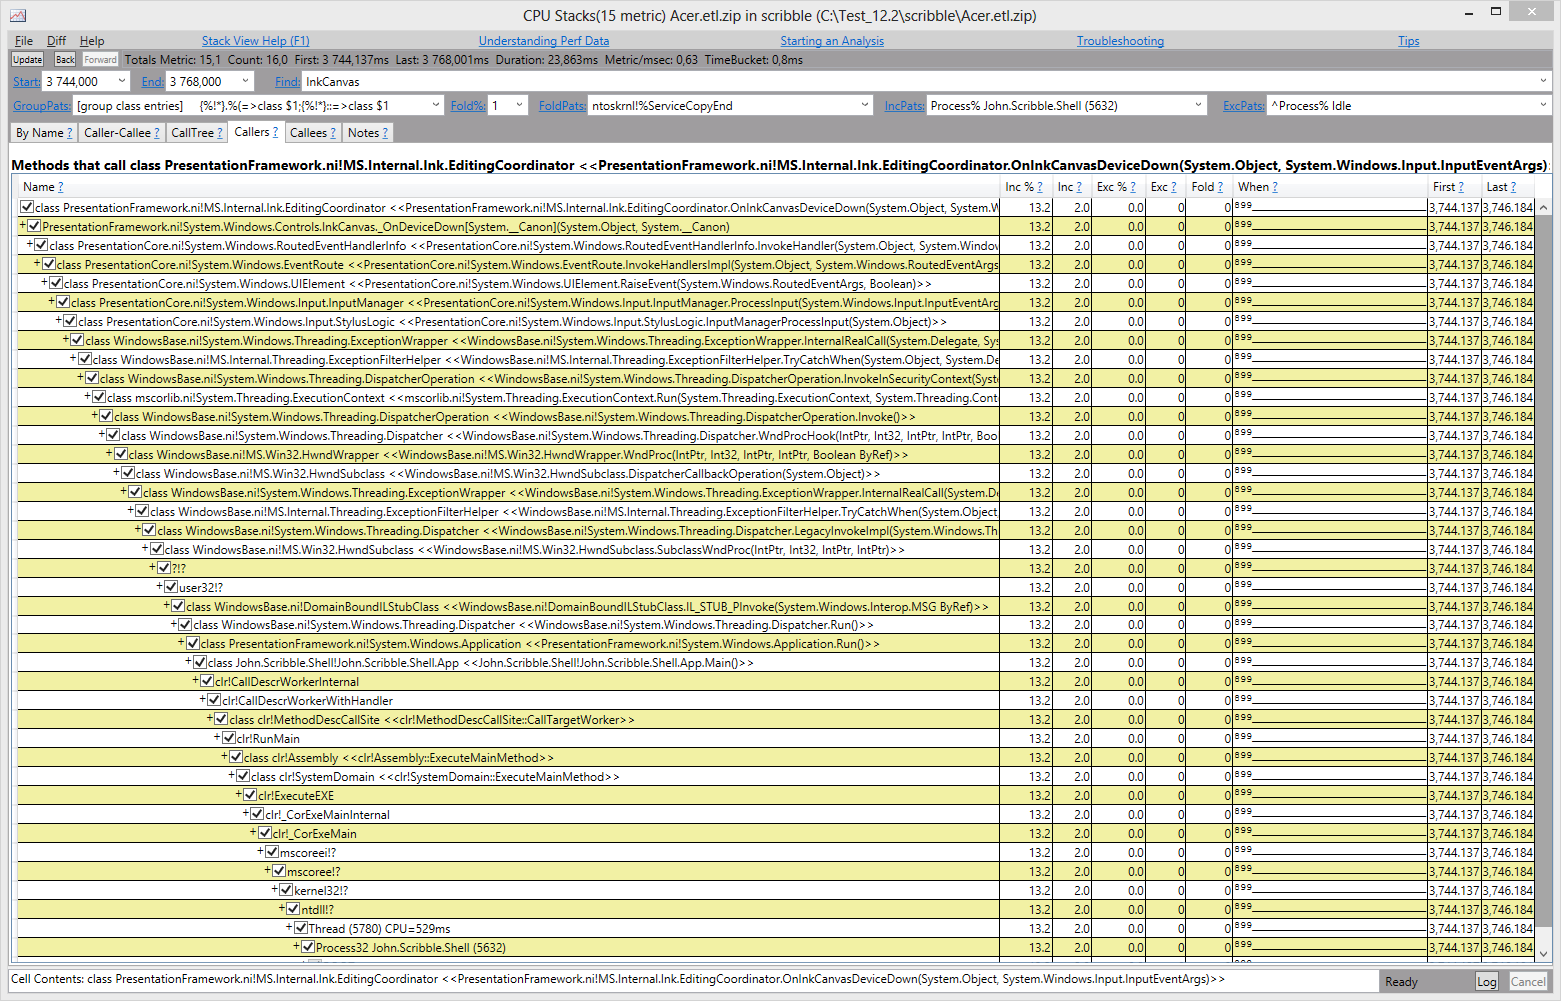
In this screenshot, you can see that the drawing process begins with handling the event of touch input PresentationCore.ni! PenThreadWorker.ThreadProc. This occurred 3,735 milliseconds from the start of the trace. The touch event will be processed in the program and should cause a redraw. Since the methods are ordered by call time, just scroll down the table and look for calls related to redrawing.
Calls in wpfgfx occur after about three milliseconds, but this is not what we were looking for, because the code of our application did not work in this time interval. It seems that we accidentally made a small discovery - WPF has its own visualization of sensory input. Even if the application does not handle touch input events, its window will still redraw when such events arrive. The end of the redraw will be the d3d9! CSwapChain :: Present call. The first redraw (not ours) occurred at 3,740 milliseconds. Moving further along the time axis. The touch event was processed by user code after another 4 milliseconds. Below is the full stack of event handling.
The next call to the d3d9 method! CSwapChain :: Present occurred at 3,767 milliseconds.
Thus, it took about 32 milliseconds from a touch event to a redraw caused by the operation of a custom code. With the speed of one finger per second, the visualization lag will be about three pixels.
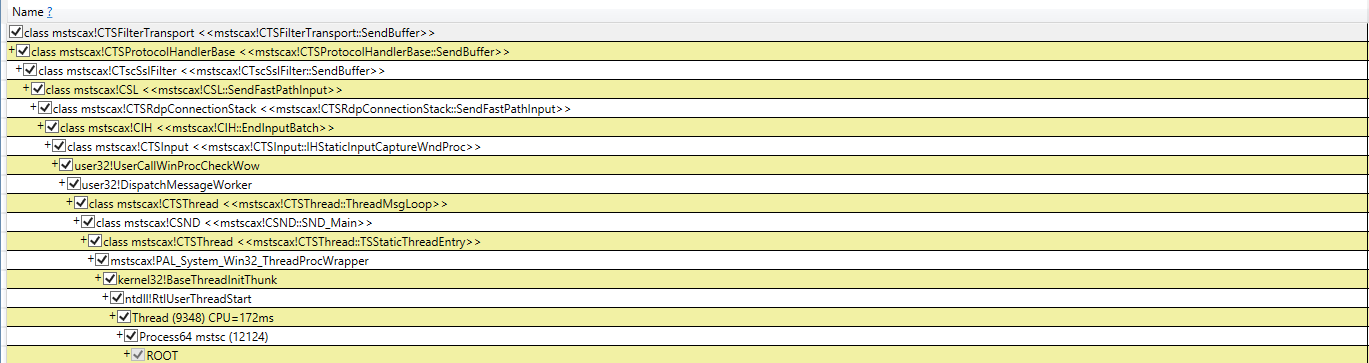
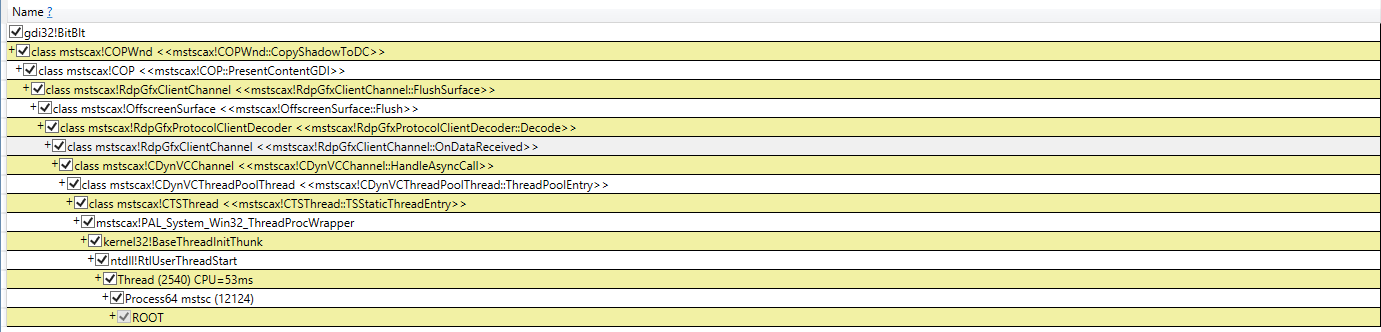
In the case of a remote connection to the tablet, the delay time will consist of: the delay in transmitting user input to the remote machine, the delay in forming the frame on the remote machine, the delay in receiving and drawing the frame in Remote Desktop. To estimate these delays, it is enough to perform a trace on the machine with which Remote Desktop is started. We present here only the results of the analysis and interesting findings. We will analyze the process mstsc.exe. Neglecting the time spent on processing the input message, we will take the delay time from the call to mstscax! CTSProtocolHandler Base: SendBuffer to the call to mstscax! COP :: PresentContentGDI. The transfer of user input to the remote machine occurred at 14,348 milliseconds.
After that, receiving graphic data from a remote machine and redrawing the Remote Desktop application window occurred at 15,139 milliseconds.
The delay was 791 millisecond. At a speed of one finger per second, the visualization lag will be about 75 pixels.
We hope that after reading the article will be less elusive bugs, and all sorts of "miracles" and incomprehensible points related to the work of programs.
Source: https://habr.com/ru/post/218767/
All Articles