QlikView. Create your first application? ...

In this article I want to describe the basics of using QlikView from QlikTech, a company designed for Business Intelligence. Caution, a lot of spoilers.
Little preface
QlikTech is a business intelligence software development company headquartered in Radnor. Founded in 1993 in Sweden.
QlikView is a BI platform with associative in-memory search with built-in ETL tools.
Abbreviations, definitions, information
- QV - QlikView
- It is customary to call not “report”, but “application” in QV
- There can be as many reports in one application.
- Under the reports are determined - tables, graphs, lists, charts
')
Actually, why are we here? - To create your first application for simple sales analysis
What do we need for this?
1. QlikView.
2. Data, I created them randomly using QV.
3. 25-30 minutes time.
Links
1. QlikView Personal Edition (ver. 11.20 SR5) x86 x64 Win8andUp - Free version, available for everyone, without restrictions of use under one user on one computer
2. Data archive on Mega
Data loading
We assume that you have already installed QV and created a new document.
Go to the script editor (CTRL + E) and see that we have already created the default environment variables:
Script Editor Window
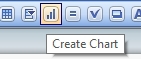
All we need today for work is a button -
 , because we will load data from Excel-files.
Let's first create a calendar, type the code:
(the full script will be under the cut at the end of the article)
The calendar
Do not forget to save the application every time before loading the data, otherwise you will have to type all the code again.
Enable auto save can be in the settings.
Now let's load the data by pressing CTRL + R
progress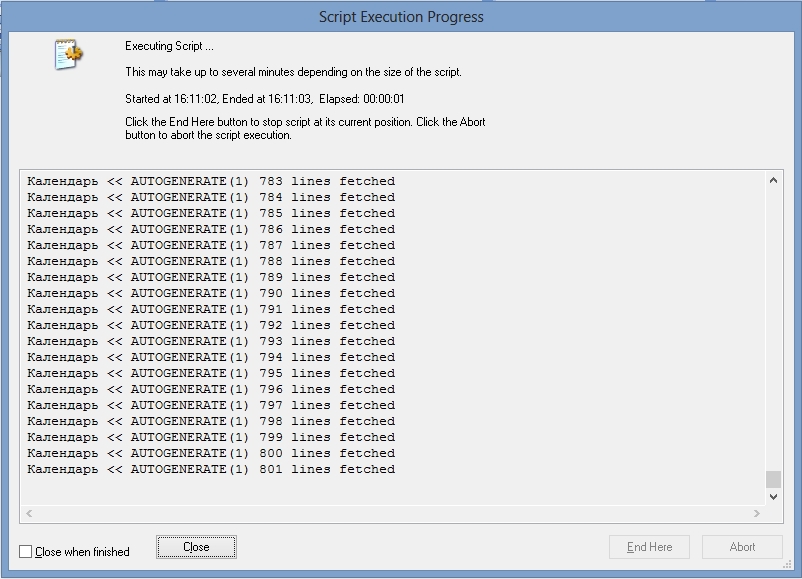
Close it and a sheet properties window appears in front of us.
sheet properties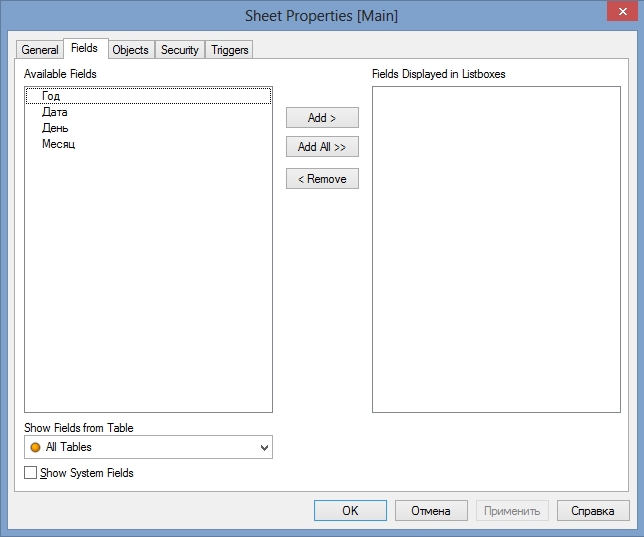
We are offered to change the composition of the displayed data on the sheet based on what we have, so let's take advantage.
Add Year, Month
it should be
and click OK, arrange our “listboxes” as we like:
move objects
That's it, go to the CTRL + E script editor and click on the - Table Files button, select the Nomenclature file and click open:
directory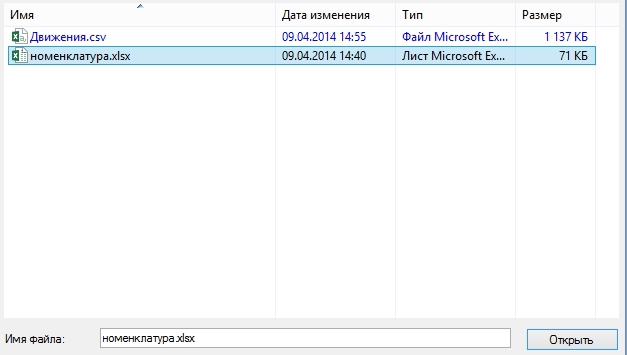
we will not change any properties, but simply click Finish (or Done)
tabular document properties
at the same time, we automatically generated a code for loading data from the document:
nomenclature code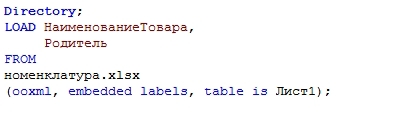
All we need is to replace the first line of the Directory; on nomenclature
and add the line RowNo () as ID, I specifically made it here, because very often when loading data we do not have unique identifiers for which we can bind data, and we have to create them manually, and even sometimes using 5-6 fields for this but more about that another time.
as it should be with the nomenclature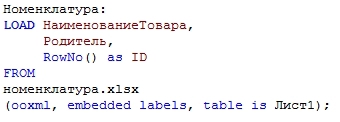
We continue, add to the script the loading of sales data similar to the Nomenclature
as it should be with sales
We finished the work with the script, save the application CTRL + S, and load CTRL + R, pay attention to how quickly you loaded 50 thousand. lines from Excel file.
progress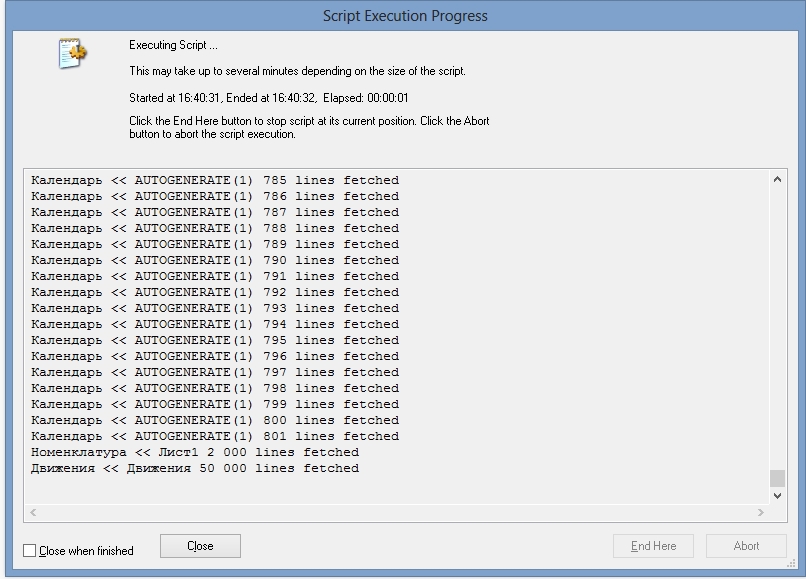
Design
Let's leave the result unchanged
data sheet
and create a pivot table
full table
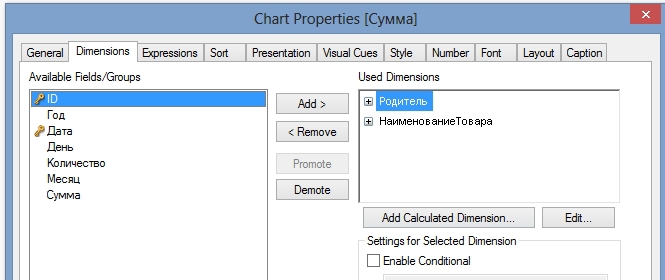
Chose the type of table - summary, click on next, add measurements

click next, add expressions:


Chose the type of table - summary, click on next, add measurements
click next, add expressions:
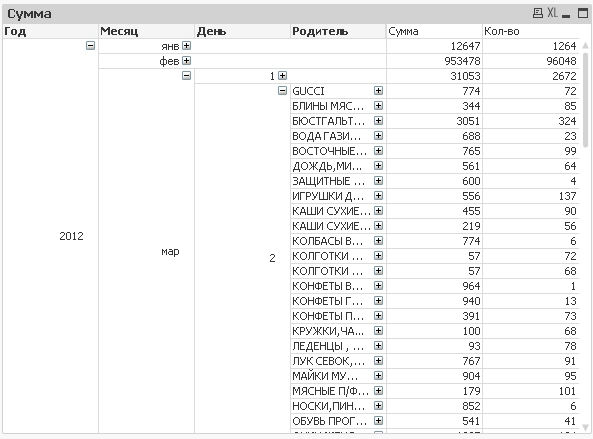
A little straighten the table and get something like this
Something like this
what you got:
have checked
go to the properties:

for the first 4 measurements we will put separately Show Partial Sums on the Presentation tab (Presentation)

have checked
go to the properties:
for the first 4 measurements we will put separately Show Partial Sums on the Presentation tab (Presentation)
We will continue the transformation, since now nothing is clear.
Pictures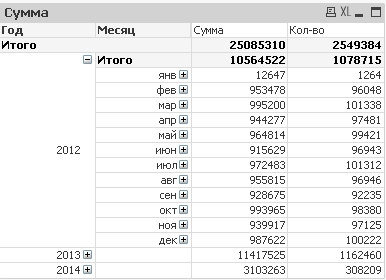
and simply remove the measurements of the year, month and day, and leave only the Parent and Item Nomenclature
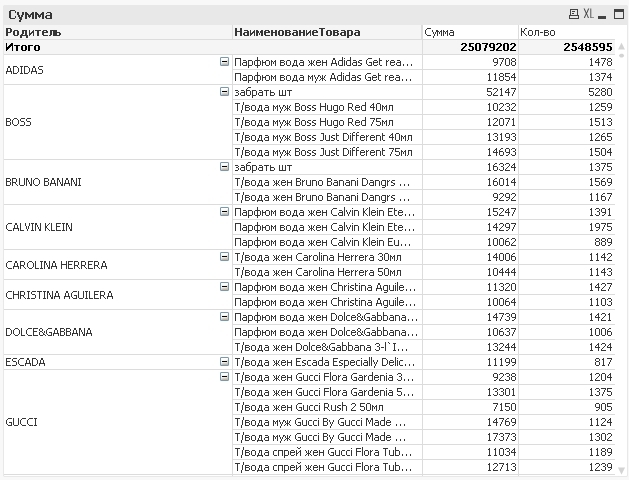
and simply remove the measurements of the year, month and day, and leave only the Parent and Item Nomenclature
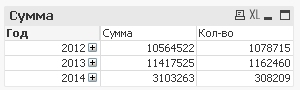
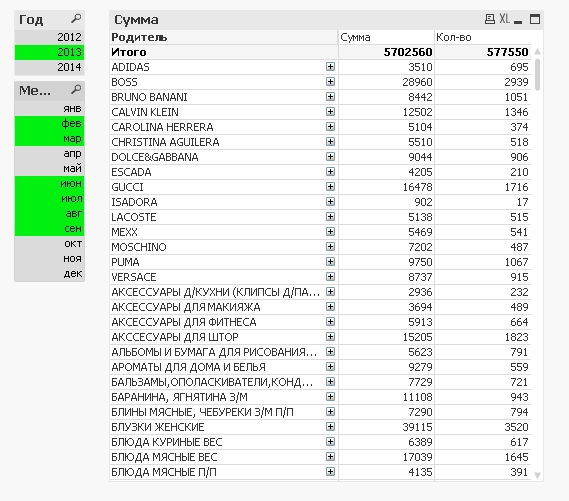
It has become more or less clearly look great.
Now you can play with the years and months, for this it is enough to choose the one you need, and pay attention to the speed of data conversion in the table
sampling
Button clean up samples: 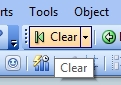
The end.
Conclusion
Actually, I wanted to show the community how to work and build applications in QV on fingers.
I myself am now engaged in more serious projects on QV in particular, building reports for 500 million data lines.
If the community is interested in continuing, then I will gladly provide it.
Welcome everyone to the room.
full application code
SET ThousandSep = '';
SET DecimalSep = ',';
SET MoneyThousandSep = ";
SET MoneyDecimalSep = ',';
SET MoneyFormat = '# ## 0.00 p.; - # ## 0.00 p.';
SET TimeFormat = 'h: mm: ss';
SET DateFormat = 'DD.MM.YYYY';
SET TimestampFormat = 'DD.MM.YYYY h: mm: ss [.fff]';
SET MonthNames = 'Jan; Feb; Mar; Apr; May; Jun; Jul; Aug; sen; Oct; but I; Dec ';
SET DayNames = 'Mon; W; Wed; Th; Fri; Sat; Su ';
// empty calendar table
Calendar: / * The name of our table * /
load * Inline / * Load the data line by line while we explicitly specify the data * /
[Date, Month, Year, Day]; / * The name of the data fields that will be in our table * /
// create a calendar from the current date minus 800 days
Let CurrentDate = Num (Today (1)); / * Define the variable CurrentDate -
as today's number in digital representation * /
Let Period = 800; / * I took an arbitrary number, you can use any * /
For i = 0 to $ (Period) / * create a loop * /
Concatenate (Calendar) / * The Concatenate command indicates what is to the already created table
we need to add new data * /
Load / * The Load command is used almost everywhere, it means loading data into a table * /
Date ($ (CurrentDate) - $ (i)) as Date, / * Calculate Date * /
Month (Date ($ (CurrentDate) - $ (i))) as Month, / * Calculate Month * /
Year (Date ($ (CurrentDate) - $ (i))) as Year, / * Calculate Year * /
Day (Date ($ (CurrentDate) - $ (i))) as Day / * Calculate Number * /
AutoGenerate 1 / * Autogenerate 1 - stubs that we need to write one row to the table * /
;
Next i; / * continue the cycle * /
Nomenclature:
LOAD Product Name,
Parent,
RowNo () as ID
FROM
nomenclature.xlsx
(ooxml, embedded labels, table is Sheet1);
Movement:
LOAD ID,
Date,
Amount,
Amount
FROM
Movements.csv
(txt, utf8, embedded labels, delimiter is ',', msq);
Source: https://habr.com/ru/post/218737/
All Articles