Diagnosing problems with the "unstable availability" of the site

I present to you the article, the purpose of which is to determine the sequence of actions in the analysis of unstable loading pages or inaccessibility of the site for the average user. In addition, I propose to supplement my scheme with the general mind of the habrasoobshchestva, so I am waiting for your comments under the post, so that together we can form a “reminder for the non-sysadmin”.
So let's get started.

First, you need to exclude from the list of possible faults the most obvious and easily diagnosed: the lack of connection to Wi-Fi, problems on the side of the Internet provider, or, for example, the lack of a cable in the socket and the battery in the laptop.
I also propose to omit difficult-to-solve problems and malfunctions of the local Internet or the computer itself, which require the direct intervention of a sysadmin. These may be Trojans, problems with hardware, browser or operating system, MTU on the router, incorrectly configured DNS or DNS failures and a number of problems that can be identified, but the article will turn into a book or even in a training course.
Let us dwell on the fact that we have no problems with the Internet and the websites are loading normally, but our site is accessible with interruptions or is not available at all.
')

How to find the cause?
1. The Internet is a huge number of highways leading from the server to the server, and there are cases when our server is working and we see other sites, but here the path of the packets from us to our site is broken: the network has been segmented because of a routing failure or somewhere then there was a failure in the channels of the providers. Of course, in the console, the traceroute command (tracert on Windows) will show whether the server of our site is accessible, which servers go through the packages and where they stop. If traceroute and ping do not reach our server, but reach the hosting network, then it’s time to call the hosting technical support or sysadmins, since in this case it will be difficult to do something on your own.
Traceroute and ping are simple commands, there are articles on this topic on Wikipedia with quite an accessible description:
https://ru.wikipedia.org/wiki/Traceroute
https://ru.wikipedia.org/wiki/Ping
If traceroute “sticks” somewhere on the main channels on the way to the site, then I recommend you to check how the server / site is visible from other servers (computers) of the global network outside of your provider. They are very likely to use other trunks and it is often clear that traceroute passes through other channels to your server successfully. For example,
http://network-tools.com/default.asp?prog=express&host=www.reg.ru
If everything is in order, then the problems are either with your provider or with his providers a level higher, but not near your server and not on it.
Now you can call the technical support of your local provider and ask: "What are the main channels there?";)
2. The speed and stability of the Internet channel is the speed and stability of the slowest and worst communication channel on the way from you to the server. You can determine if there are problems with packet loss “on the road”, large packet delays between different providers or between you and the provider, using the mtr utility, and the results of the utility are especially indicative of a large packet size and its possible segmentation (for example, 1500 bytes) .
Mtr is something like combined ping (polling each server along the path of packets) and traceroute (determining the entire path of packets), but keep in mind that due to the constant stream of packets, the utility eats up a lot of traffic.
Call example:
mtr -s 1500 --report .com Request verification to the website yahoo.com:
HOST: xxx.reg.ru Loss% Snt Last Avg Best Wrst StDev 1.|-- 31.31.xxx.xxx 0.0% 10 43.4 16.7 0.5 102.8 33.1 2.|-- bdi-799.sr7.msk1.ip.di-ne 0.0% 10 1.5 1.5 1.5 1.7 0.1 3.|-- vlan-793.br1.msk1.ip.di-n 0.0% 10 0.8 0.8 0.8 0.9 0.0 4.|-- 31.28.19.100 0.0% 10 0.9 4.5 0.9 36.8 11.3 5.|-- ae0-948-rt2.spb.cloud-ix. 90.0% 10 14.7 14.7 14.7 14.7 0.0 6.|-- ae0-59-rt1.frk.cloud-ix.n 10.0% 10 37.7 37.8 37.7 38.3 0.2 ... 15.|-- po-15.bas2-7-prd.gq1.yaho 10.0% 10 204.7 207.0 204.5 211.1 2.8 16.|-- ir1.fp.vip.gq1.yahoo.com 10.0% 10 204.7 227.4 204.7 281.4 32.1 Indicative for us will be the value of the percentage of packet loss (Loss%) of our final list server. Losses on intermediate servers, if they do not affect the final server, are most likely due to the limitation of the number of test packets to them (ICMP traffic).
Usually, if there is a 30-50% loss of large packets, the connection problems are already becoming noticeable (the page sticks, slows down due to underloaded elements), and the higher the percentage, the harder it is to break through.

Problems can be born on some intermediate node, for example, on the next main Wi-Fi link from your office to the provider (if any). In addition, problems can be caused by communication and packet routing between providers.
A detailed article on how to use mtr to diagnose problems with the channel (in English) can be found here or on Wikipedia .
Something similar to the mtr utility in Windows NT is pathping .
Sometimes the provider (or our server) can be completely disabled or limited to pass these test packets (ICMP traffic). In this case, such tests will not help identify the problem. Here, of course, it is fit to remember about “everybody is angry with Buratino himself” - if you disable the ability to check the server, then you will not be able to check it :-).
3. If the above tests do not reveal any problems, then we use the main visual and convenient tool - Chrome Developer Tools (Web Inspector in Safari, Firefox Develper Tools):
https://developers.google.com/chrome-developer-tools/
https://developer.apple.com/library/safari/documentation/AppleApplications/Conceptual/Safari_Developer_Guide/Introduction/Introduction.html
https://developer.mozilla.org/en-US/docs/Tools/Network_Monitor
When working with Chrome Developer Tools (Menu -> Tools -> Developer Tools), in the Network tab, we update the page of our website and get a report on how all the resources are loaded on it:

Upon successful loading (albeit slow), the page of the site will be visible: when the main content of the page is loaded and it begins to be formed for display, when all nested java-scripts tied to work with page elements and waiting for the full load of the main code and the necessary undefined additional nested elements. This moment in the picture above: the blue vertical line is the DOMContentLoaded event, and the red vertical line is the activation of the windows.onLoad event (when the scripts have already worked and the whole page with elements has been formed, the contents of the images are loaded).
Using this information tool, we can check whether everything is in order with loading the main content of the page and the main html-code, that is, to make sure that our server is completely “live” and the main engine of the site does not slow down.
This is the first item on the list. By clicking on it, we get a more detailed server response time:
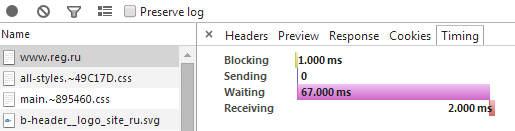
As we see here, our browser waited for data from the server for 68 milliseconds (the server formed the page on the request received from us) and 2 milliseconds it was received (which was fast enough).
Already from this information, it is sometimes possible to see that the problem consists in slow loading of the site - this, for example, is not a millisecond, but a 30-second formation of the main code of the page. This happens when the server or provider is overloaded with requests, inefficient code is used (the request on this page works for a long time) or there are some other reasons that the sysadmins and the programmer of the engine can analyze.
Below in the list of download graphs you will see which resources on the page load longer, which page resources the browser waits before displaying the page, and what blocks its display.

A common cause of blocking is the dependence of the start time of work on changing / forming the page content (before linking to the DOMContentLoaded event) of scripts from any external statistics collection services, advertising engines or link exchange pages. Usually these are pieces of a script for inserting "one more" external script:
<script> document.write('<scr'+'ipt type="text/javascript"'+' src="http://jsc.dt00.net .... </script> These systems are located on foreign servers and are often inaccessible to our sysadmins, so they can behave as they please, for example:
That is, until it loads and executes the <script ...> block, which in turn refers to an external resource, the browser will expect results from it, often not displaying the content of the page or displaying it incorrectly, although modern browser engines can work ahead of the curve.
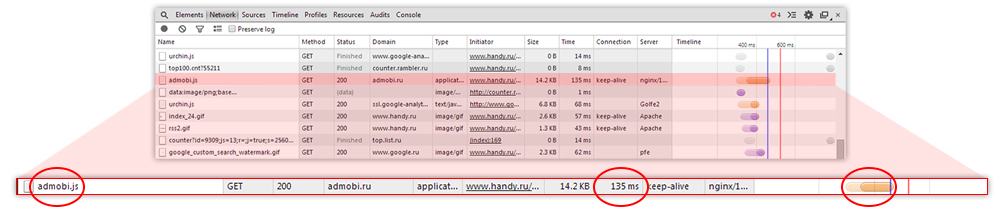
Here and in the screenshot above, the work of the scripts on the page started with a delay of 135 ms due to the download of the ad script from admobi.ru (admobi.js). There are cases when the distribution server code advertising and statistics is available, but responds slowly, and the browser, successfully connected with it, can wait a response for tens of seconds.
4. As with traceroute (p. 1), information on loading the page through the Developer Tools (p. 3) can and should be checked “by someone else’s view of your server” using similar external analyzer services, for example:
http://www.uptrends.com/aspx/free-html-site-page-load-check-tool.aspx
What it looks like:


and http://tools.pingdom.com/fpt/
Pay attention to the final table of the first service with temporary totals. And at the beginning of the second table, with the ranking of "how your site is accessible by speed, in comparison with other network sites", as well as the number of requests (elements), volume and download time of all information on the page.

Such reports and comparisons with download timelines in your browser will show the places where the loading of the site through your provider differs from the loading in these two services and where the longest delay occurs. Even, for example, in HTTPS Handshake, there can be tangible lags when checking certificates from you to the server of the certificate provider.
Another “feature” of these two services is the ability to select the server from which the test request will be conducted, that is, simulate how your page is loaded from a server in Berlin, New York or Moscow.
5. Strange and not frequent "sticking".
Sometimes with unpredictable periodicity, “sticking” of page loads occurs. For example, once a day. The first time - after a long break or even by accident. Such cases are harder to catch.
I propose to single out and supplement with a general mind possible options for such problems:
- The problem with the work of plug-ins, which in modern browsers are now tons:
- Unplug everything and compare;
- Or vice versa, enable (look for!) Adblock and ghostery plugins.
- The first contact with the server after the break.
Initiation of a secure ssl session for the browser usually takes place more slowly due to the initial key exchange and verification of certificates. This happens just when entering the site after a break or clearing caches / keys. - Lags with obtaining certificates or keys when loading other (external) scripts and page elements that can block the display: statistics collectors, ad networks, banner exchanges.
- All the named elements from the previous paragraph, if the connection with our server is good, but with the server giving this embedded element - it is bad or it is overloaded.
As mentioned in one of the points above, until the script is reloaded, the page render can “stick”, OnDom / OnLoad is processed with a delay. It often happens that when viewing other pages this item is already cached and everything is in order. Here you can try to exclude requests for these external servers (again, we see the brakes in Developer Tools) by adding to the local computer for a time in the hosts file in turn:- server-collection-statistics.ru 127.0.0.1;
- advertising server.com 127.0.0.1;
- and other servers, the scripts of which are called on the page.
It must be remembered that if we redirect requests instead of some servers on the Internet inside our network "directly to our laptop" (to localhost, 127.0.0.1), then we can get a second delay, as in the example above, where we have port not responding by timeout. - If a page is delivered not by one, but several servers in turn at load distribution, it happens that we after some number of times get on some kind of “tight” server, and then again on fast ones.
Here you can check whether there is a separate server name from those to which the load is distributed, and work directly. - Problem with statics return servers, if it is issued by another server. Here, often, subsequent downloads are in order, since all the static goes with a noticeable margin of obsolescence (expired), here and then it has slowed down once, then the pages load normally. Developer Tools will help you see this clearly with the options to clear or turn off the cache.
- If the “brakes” are observed when editing the pages of your site, you can exclude elements and blocks of external advertising and statistics from the page in turn and, by updating, determine what the problem is.

Of course, there are a lot of possible problems, and in order to form a complete list, you need to brainstorm. For example, at one time there were lags of fresh technologies in browsers and their beta versions on the svg renderer or glitches with new protocols, such as SPDY. But this is just an example of which way you can think further, and here intuition, the experience of your sysadmin and, most importantly, the size and quality of his tambourine are already important.
Source: https://habr.com/ru/post/218161/
All Articles