Scientists have received new images of brain neurons
34 scientists from the Allen Institute for Brain Science in Seattle completed the creation of the first comprehensive map of the mammalian brain, which they announced on April 2 in the journal Nature Neuroscience . The map displays in detail the interconnections between the brain cells of the mouse - neurons, which have about 71 million .

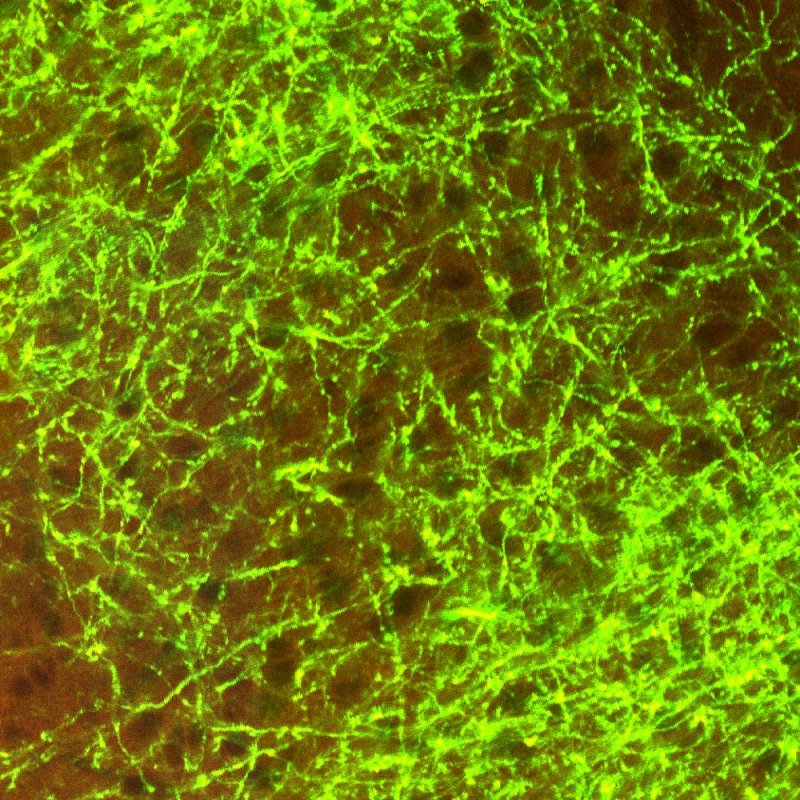
To create a map, the researchers injected a green fluorescent virus into a specific area of the brain of a live mouse. The virus infected neurons near the injection site, and after three weeks spreading throughout the brain. Below is a map of interconnections occurring in one of the brain regions, displayed as a green fluorescent grid of infected neurons. Among other functions, this area of the brain is responsible for interpreting certain sensations, primarily the sense of touch.
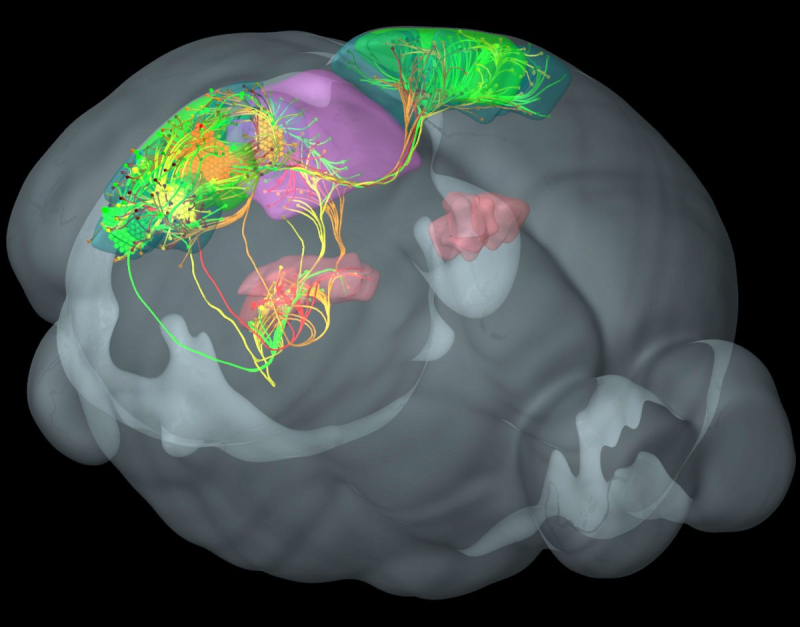
After the virus spread, the scientists took the brain out of the mouse and took pictures of it in various ways, eventually getting about 1 terabyte of data. Following the path of the virus and analyzing the created images to an incredibly small scale, the researchers got a picture of how the infected area interacts with the entire brain. For example, here is a 3D visualization of the relationship between the four areas responsible for vision in the cortex of the mouse (green, yellow, red, orange). A press release from the study reported that these areas are closely interconnected with each other and with neighboring areas of the brain in the thalamus (pink) and midbrain (purple).
')
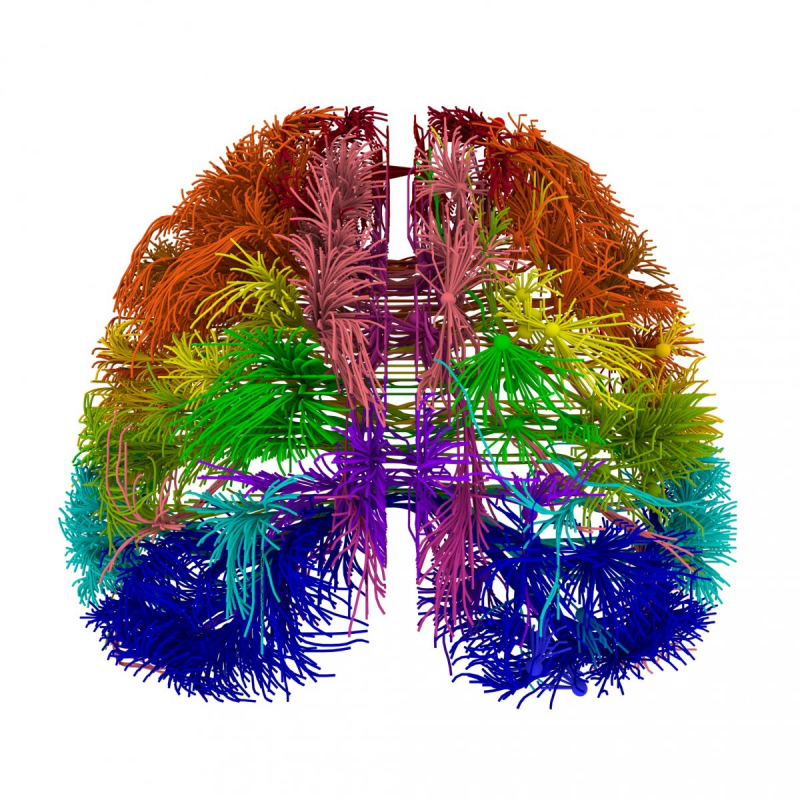
As soon as the scientists achieved the image of the neural network map in one area of the brain, they repeated this process with all the other parts. In total, researchers analyzed images of about 1,700 mice, but the study is based on only 469 of them. Below is the visualization of the data, which includes the relationship of several areas of the brain:
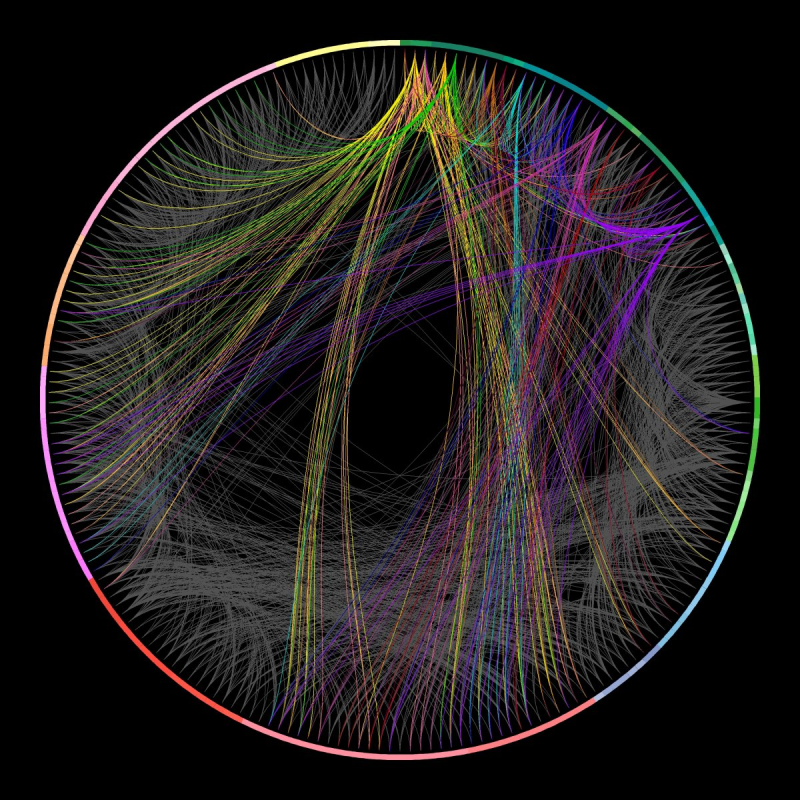
The obtained data can also be presented in the form of a round chart. This diagram shows the connections between 215 areas of the mouse brain. Relationships emanating from 11 specific areas of the brain are highlighted in different colors, the rest are displayed in gray.
Additional interesting materials:
1. Brain Explorer 2 from the team of scientists from the Allen Institute for Brain Science - with this software you can explore the 3D atlas of the human brain.
2. Interactive map of the mouse brain.
3. Books on biotechnology can be found here , books on psychology .
PS And the mouse is still a pity ...
Source: https://habr.com/ru/post/218075/
All Articles