Forecast for the number of likes in the post. SNA Hackathon 2014
 What good can be learned from social networks? You can find yourself a football team, a bass player in the group, brothers in mind, a wife , rent / rent an apartment / room / villa on the ocean. And if you connect the data analysis? You can find your place in society. For example, if I listen to XXX, read YYY and drink ZZZ, then there are only 100 of us on this ball. And if I still paint my nails in green, then I will definitely be the one and only?
You can understand what people like, what they can sell, you can make predictions and check the theory of six handshakes for the hundredth time. In the field of Social Network Analysis, there are many tasks, one of which we propose to solve at the online stage of SNA Hackathon 2014 .
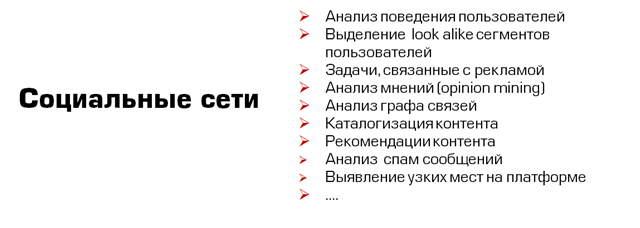
Tasks in social networks
Social networks today are an inexhaustible source of information about people, their hobbies and thoughts. Every day, users generate about 8 terabytes of photos, text, videos, which can become a resource for creating new software products or a powerful prediction tool.
')
We decided to focus on the task of analyzing text data generated by users, and asked the hackathon participants to analyze the relationship between the content of the post and its rating.
About the hackathon and task of the online stage
To take part in the offline stage, participants need to predict by April 10 the number of likes that the post will collect within a certain time after publication. Or, to use the terms of Odnoklassniki, whose data we analyze, the number of “Class!” Marks for a particular topic.
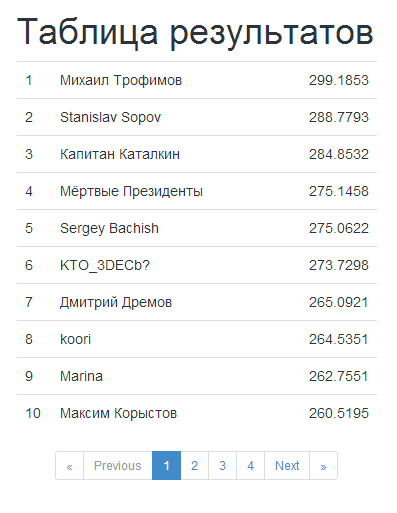
To date, such a leaderboard has been formed. Participants whose models will be the most accurate will be invited to the offline stage, which will be held in St. Petersburg, and the chance to win a Macbook pro. There, in 24 hours, it will be necessary to analyze the real publications of about 44 million users and create a prototype of the product based on them. Experts from EMC, JetBrains, Data Mining Labs and HSE and NES universities will help with advice and make small presentations.
Initial data of the first stage
Post data is stored in two files: train_content.csv and test_content.csv with the following fields:
group_id - Anonymous identifier of the group in which the post is located
post_id - Anonymized post id
timestamp - The post publication time, which is the number of milliseconds that has elapsed since midnight on January 1, 1970 (UTC).
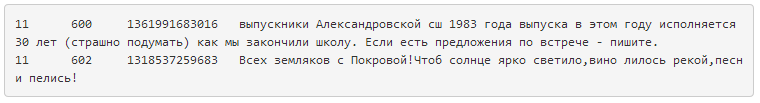
content - The content of the post. Note: this field may contain spaces, special characters, as well as http-links, images and polls. Author's spelling and punctuation preserved.
Example:
The data for the “Classes!” Training set is stored in the file train_likes.csv with the following fields:
user_id - Anonymous identifier of the user who put the "Class!"
post_id - Anonymized post id
timestamp - Class time, representing the number of milliseconds that has elapsed since midnight on January 1, 1970 (UTC).
Example:

The forecast is estimated using the R2 metric (multiplied by 1000 for ease of display):
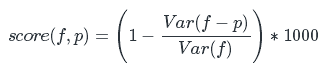
Where:
f - the actual value of the number of "Classes!"
p - forecast of the number of “Classes!”
Var (x) is the sample dispersion of x
It turns out that 1000 is the maximum score for the forecast. To get to the second stage of the hackathon, it is necessary to overcome the baseline, the accuracy of the algorithm that we wrote.
Default algorithm
The source code for R with preliminary data processing and building a baseline forecast can be found in our repository on github .
There you will find three scripts on R:
prepare.R - Data preprocessing
features.R - Finding basic features (number of characters, number of words, average word length)
baseline.R - Model building (we use linear regression)
How to start?
Unzip the input (test_content.csv, train_content.csv, train_likes.csv) into the folder ./data/src/. Type in the command line:
git clone https://github.com/snahackathon/sh2014.git cd ./sh2014 #<unzip data to ./data> cd R R --vanilla < prepare.R R --vanilla < features.R R --vanilla < baseline.R The predicted number of likes for the test set is in data / submit. Of course, this is just a basic algorithm; it does not overcome the limit score value.
If you are brave, clever, skillful ...

Participate in the hackathon! Our task is to gather enthusiastic and creative people in order to compete, it was interesting, and as a result of the competition we got exact models and elegant algorithms. Those who are still learning and want to try their hand, we invite to participate - download the training and test data and squeeze out of them all that is possible. Those who have already learned are invited not only to participate, but also to act as an expert or judge. To do this, email us at contact@sh2014.org.
Source: https://habr.com/ru/post/217659/
All Articles