Through the eyes of subscribers. Rating of mobile operators for February 2014
Moscow:
At peak hours (CHNN) Megaphone in the first place with an average speed of video viewing - 1647 Kbps, MTS at the last with an average speed - 1337 Kbps.
Megafon has the largest share of subscribers who watch videos with good quality, and at YOTA - with the worst.
Megafon subscribers are less and less likely to wait when the projectionist returns, and the situation at YOTA is just the opposite.
The most impatient subscribers in MTS and YOTA.
St. Petersburg:
At peak hours (CHNN) Beeline in first place with an average speed of video viewing - 1387 Kbps, Megaphone at the last with an average speed - 1145 Kbps.
Beeline has the largest share of subscribers who watch videos with good quality, and in Megaphone - with the worst.
MTS and Beeline subscribers are less and less likely to wait for “the projectionist to return.”
The most impatient subscribers in YOTA.
Introduction
We get the parameters and events of video views directly from online video services.
The total number of unique views of online films participating in the analysis is monthly
more than 1.5 million
The analysis presents the following mobile data operators:
- Megaphone
- Mts
- VimpelCom (Beeline)
- Scartel (YOTA)
Why did we choose online video?
Currently, the share of online video in the total traffic of mobile operators reaches 40% in 3G networks and 60% in 4G. According to the Cisco Visual Networking Index, the percentage of online video in mobile traffic by 2017 will exceed 66%.
In addition, online video is one of the most demanding network types of traffic, and on the other hand, it has built-in means of comparing the quality of the video itself.
')
This report is a development of VIGO research in the field of user experience quality assessment and includes an analysis of the following key parameters for the quality of online video delivery:
- Average download speed
- Watch video bitrate
- The number and duration of fading (buffering) when viewing
- The percentage of failure of subscribers from viewing during buffering
Moscow.
1. Data transfer rate
At peak hours (CHNN) Megaphone in the first place with an average speed of video viewing - 1647 Kbps, MTS at the last with an average speed - 1337 Kbps.
The network load of mobile operators is cyclical, for example, the network is more loaded in the evening than in the morning.
The graphs show the average speed of video views at different times of the day.
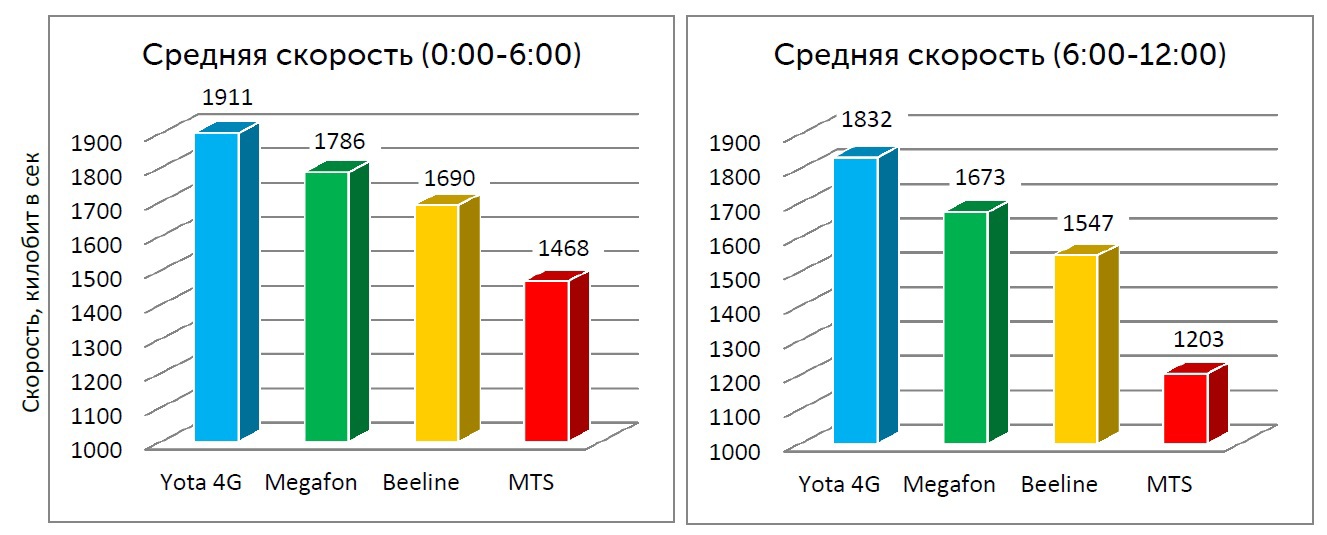
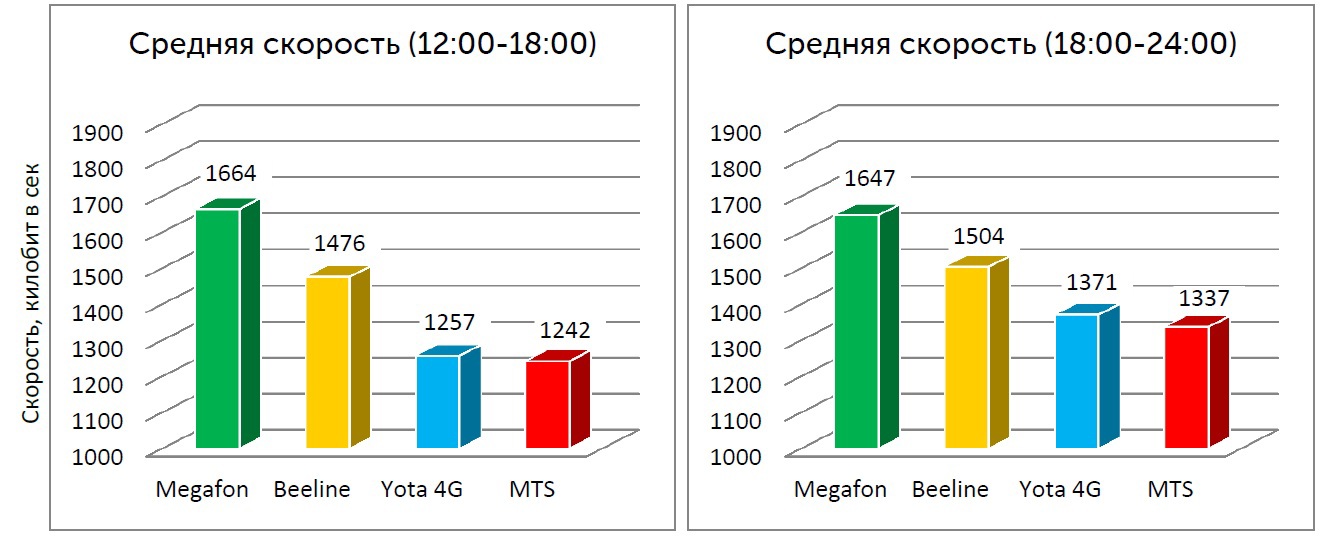
Figure 1. The average speed of video views at different times of the day (Moscow)
The difference in speed between operators can be explained by any combination of the following factors: the ratio of 2G / 3G / 4G base stations, the workload of a specific base station (sector), subscriber tariff limits, their radio conditions, subscriber traffic priority management policies.
2. Bitrate of the video being watched
Megafon has the largest share of subscribers who watch videos with good quality, and at YOTA - with the worst.
Figure 2. The distribution of views as a percentage of video with different quality and the corresponding approximate bitrate (Moscow)
What is the bitrate?
Usually, the subscriber does not know what bitrate of the video being viewed, but, as a rule, he knows the resolution (picture quality) through the notation - Xp (for example, 240p) or in a very simple form - Low (144p-360p), Standard (480p), High (720p-1080p and higher). The higher the quality of the “picture”, the higher the bitrate.
The quality of reproduced online video depends on both the user's choice and the decision of the service itself to forcibly lower the quality, and therefore the bitrate, due to insufficient data transfer speed.
3. Number and duration of video buffering
Megafon subscribers are less and less likely to wait for “the projectionist to return.” The situation in YOTA is exactly the opposite.
The effect of buffering online video most clearly characterizes the quality of the operator’s network. The very moment of fading indicates that the video is played faster than the time to download data to the subscriber’s mobile device (Figure 3).

Figure 3. Buffering
The duration and number of buffers are undoubtedly influenced by both parties: the mobile operator’s network and the video service distribution. Using data of the same video services for all operators suggests that the rating of operators for buffering directly correlates with the quality of the network for subscribers.
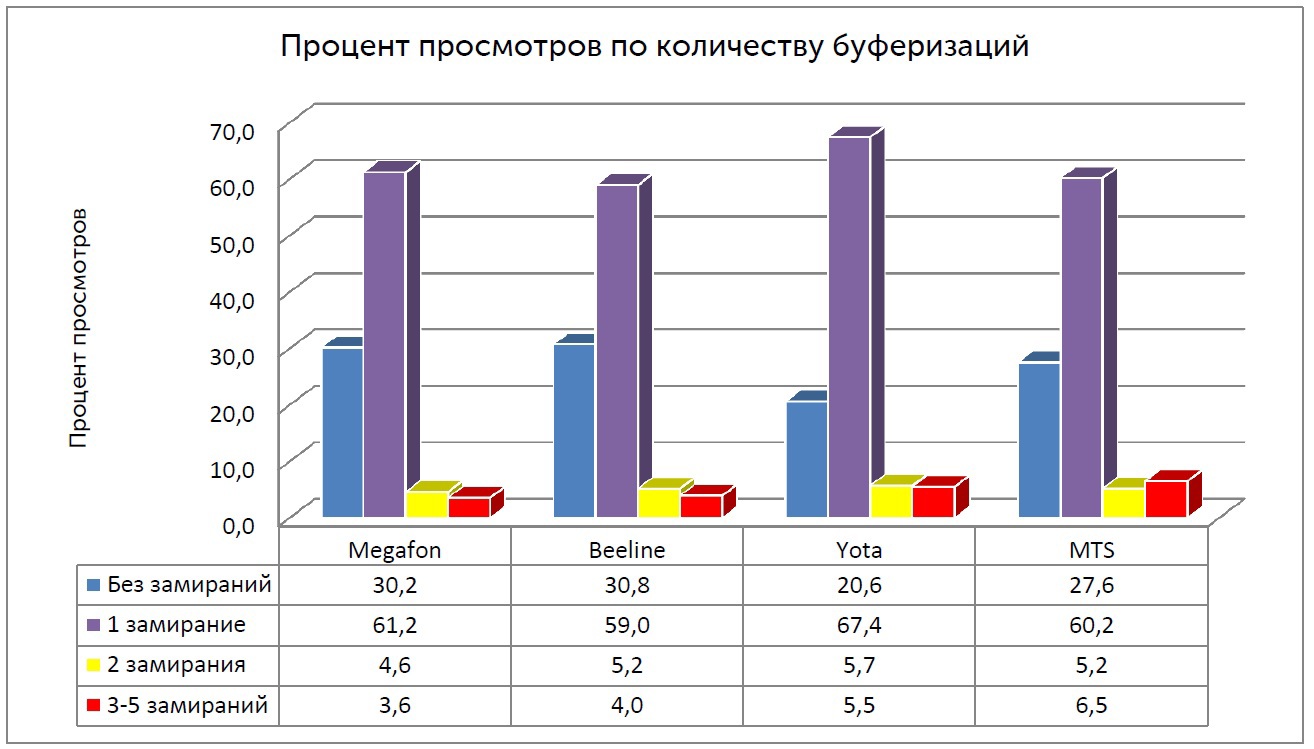
Figure 4. Distribution of the percentage of video views lasting at least 10 minutes by the number of buffers (Moscow)
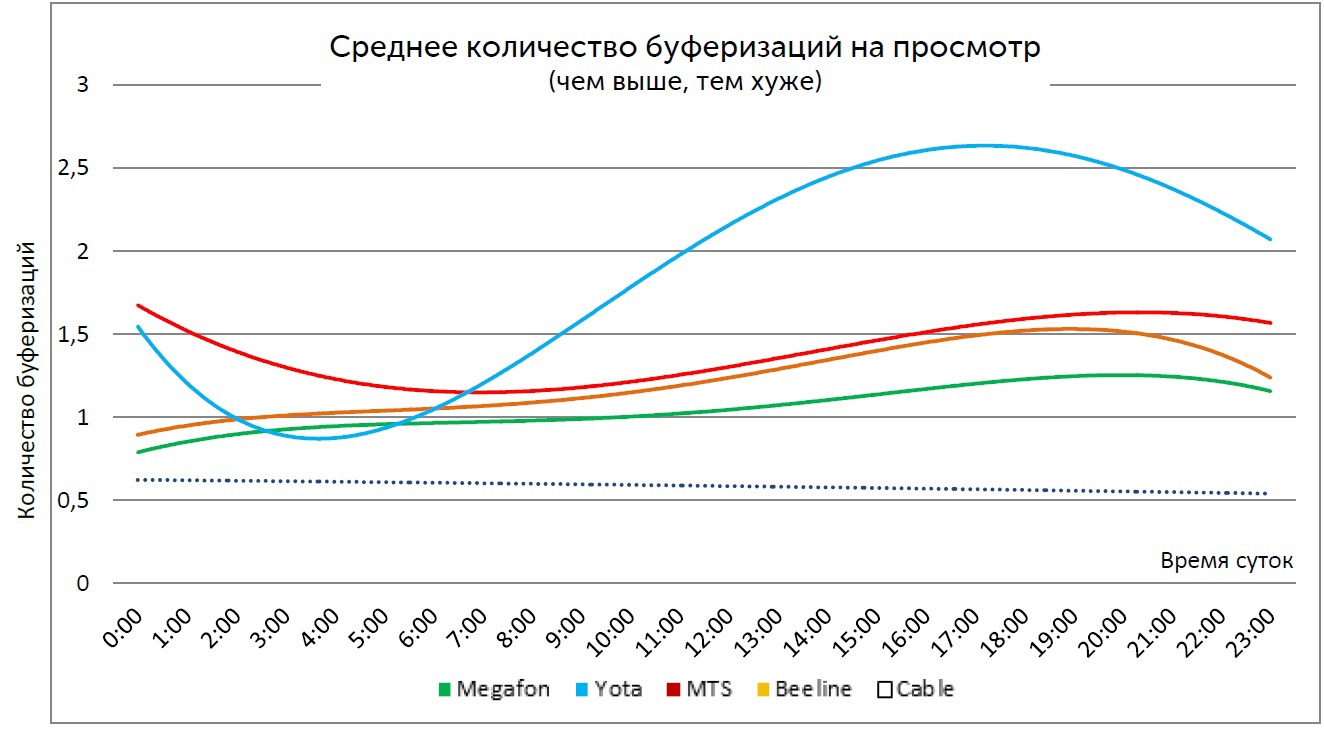
Figure 5. The average number of buffers on views with a duration of more than 10 minutes (Moscow)
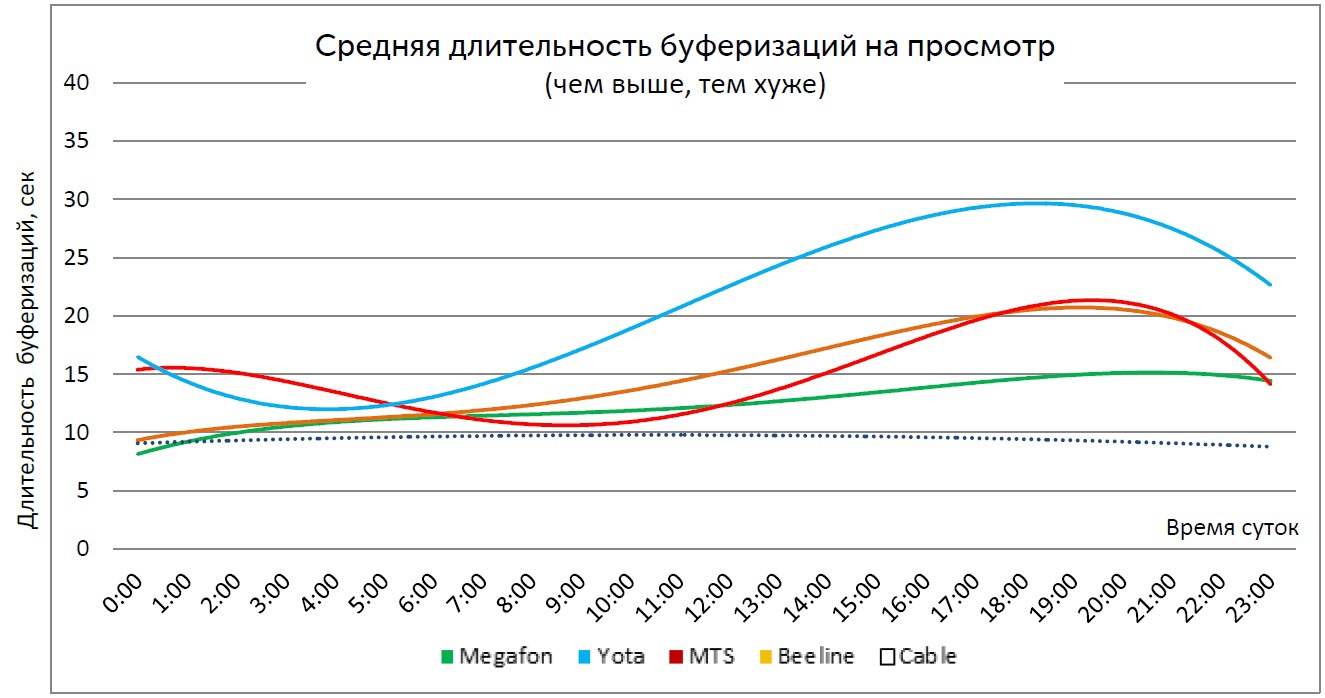
Figure 6. The average duration of buffering on views with a duration of more than 10 minutes (Moscow)
The average duration of buffering shows how long the user waits until “the projectionist returns.”
4. The percentage of failure of subscribers from viewing during buffering (Subscriber Satisfaction Index)
The most impatient subscribers in MTS and YOTA.
When your patience ends, you stop waiting for the “projectionist” and leave the cinema. In the same way, subscribers also arrive during regular buffering. The totality of such failures may be correlated with churn.
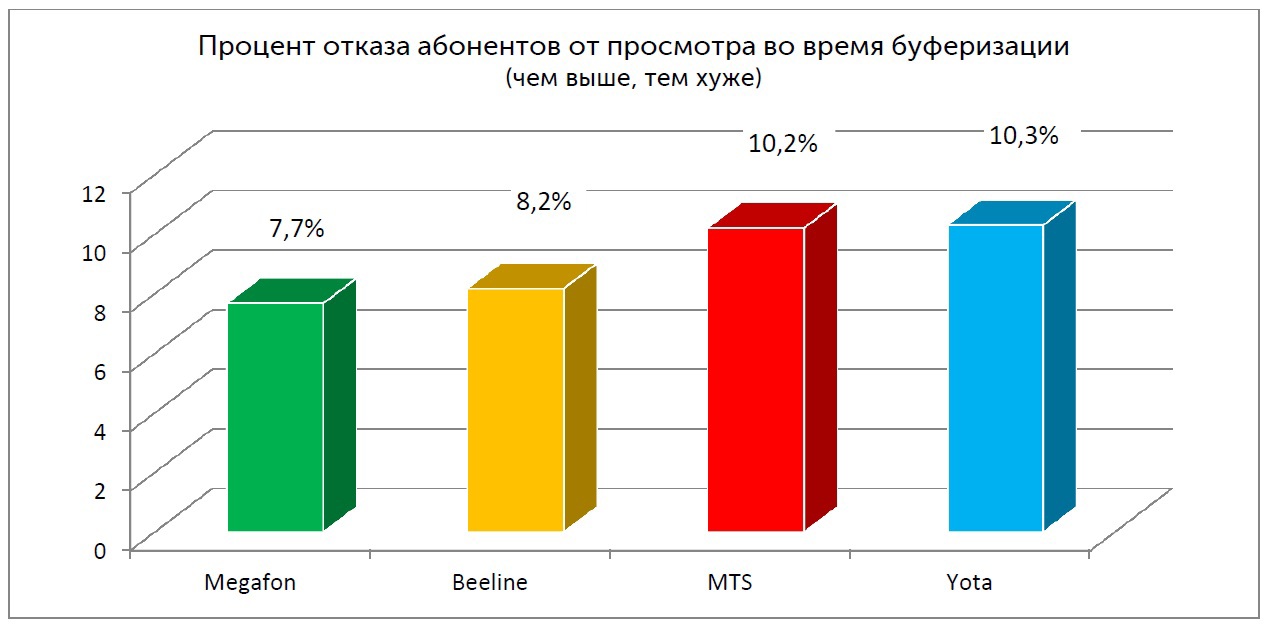
Figure 7. The percentage of failure of subscribers from viewing during buffering (Moscow)
We did not take into account such failures as the termination of viewing after N seconds after the end of the next buffering, the series of buffering with a short time interval between them, and so on.
St. Petersburg
1. Data transfer rate
At peak hours (CHNN) Beeline in first place with an average speed of video viewing - 1387 Kbps, Megaphone at the last with an average speed - 1145 Kbps.
The graphs show the average speed of video views at different times of the day.
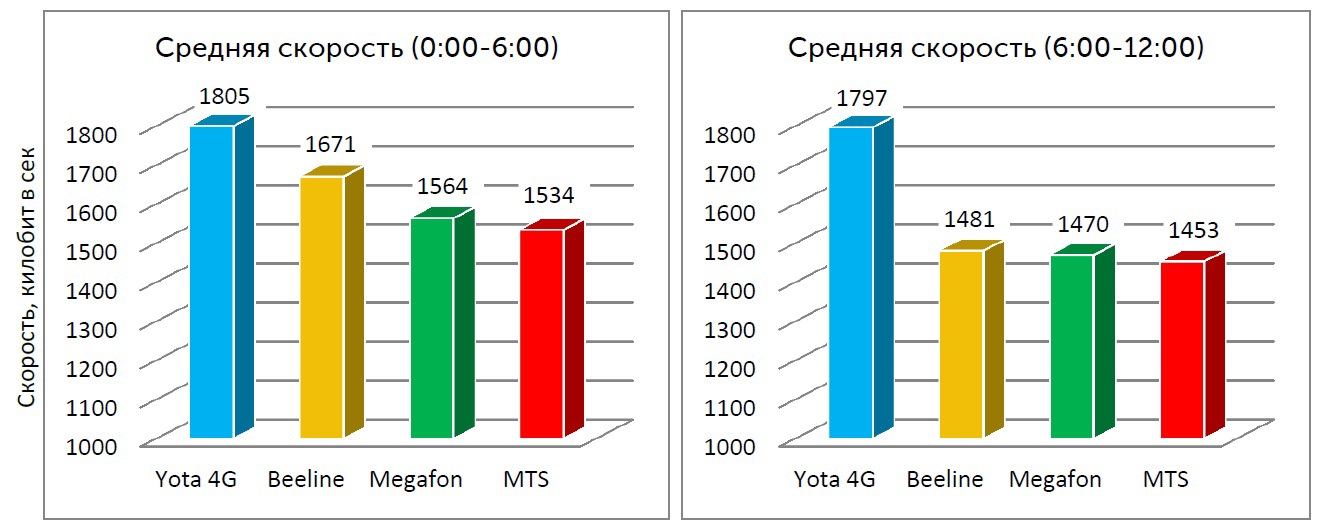
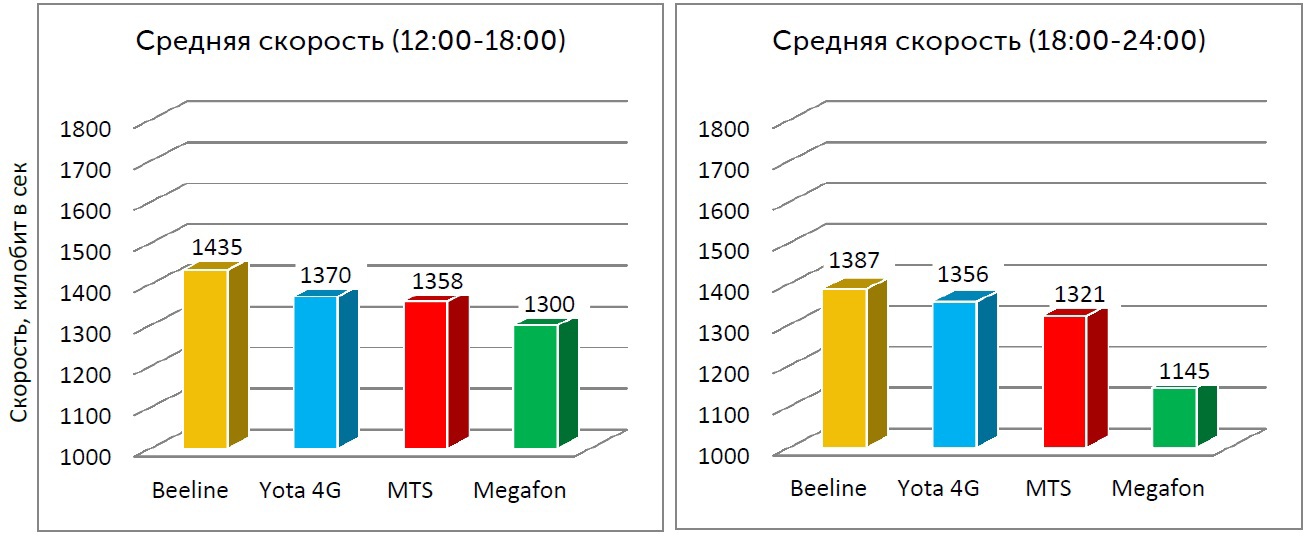
Figure 7. The average speed of video views at different times of the day (St. Petersburg)
2. Bitrate of the video being watched
Beeline has the largest share of subscribers who watch videos with good quality, and in Megaphone - with the worst.
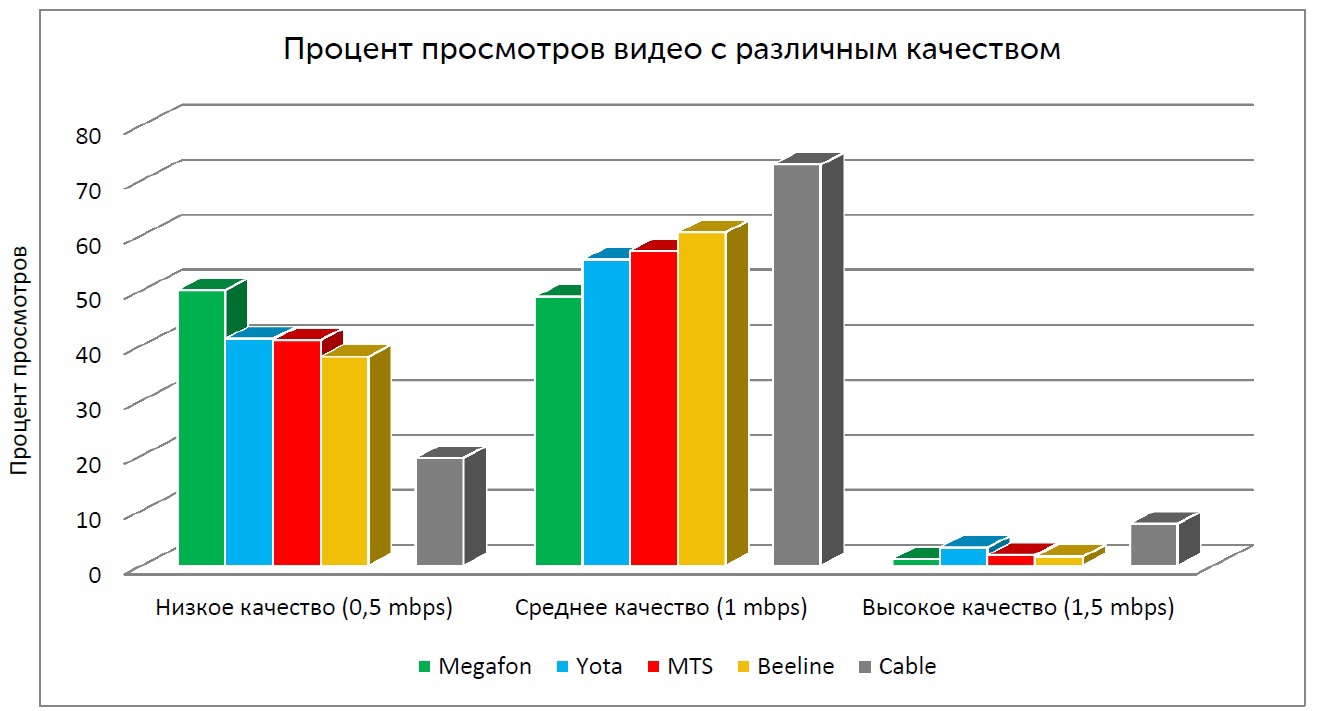
Figure 9. Distribution of views as a percentage of video with different quality and the corresponding approximate bitrate (St. Petersburg)
3. Number and duration of video buffering
MTS and Beeline subscribers are less and less likely to wait for “the projectionist to return.”
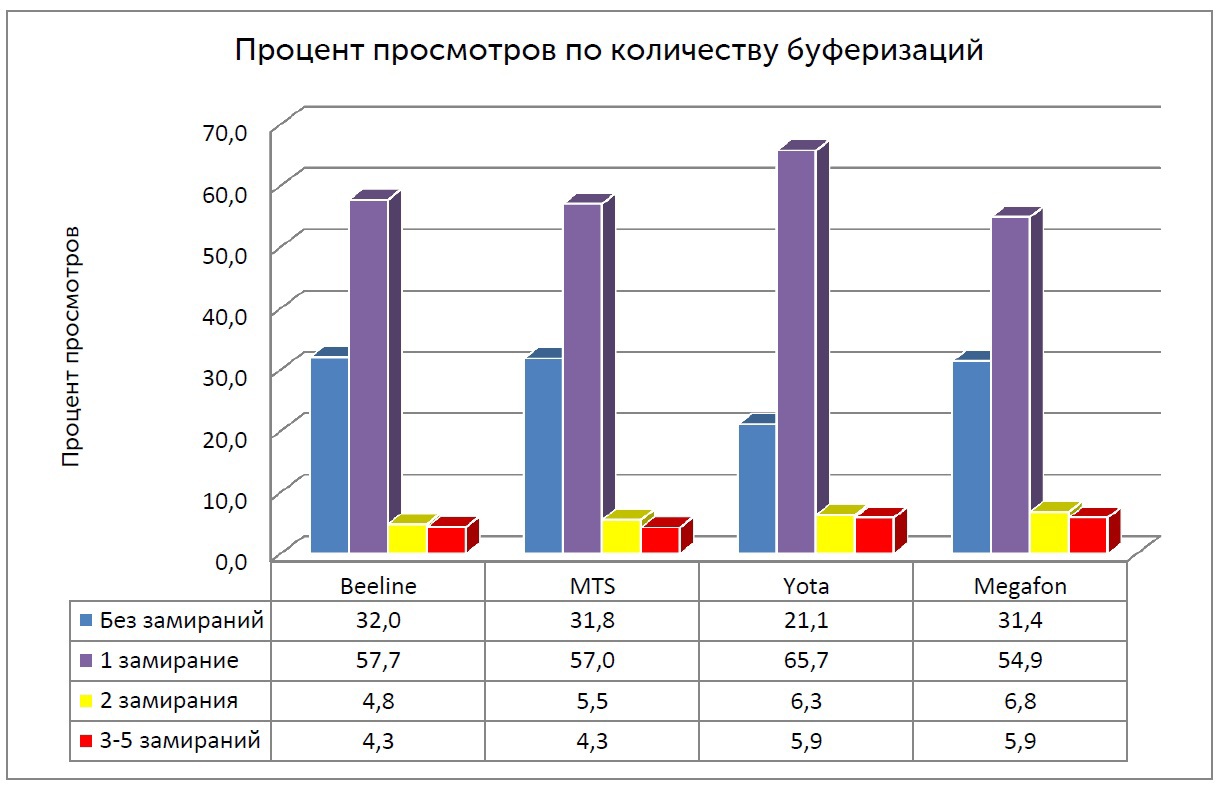
Figure 10. Distribution of the percentage of video views lasting at least 10 minutes by the number of buffers (St. Petersburg)
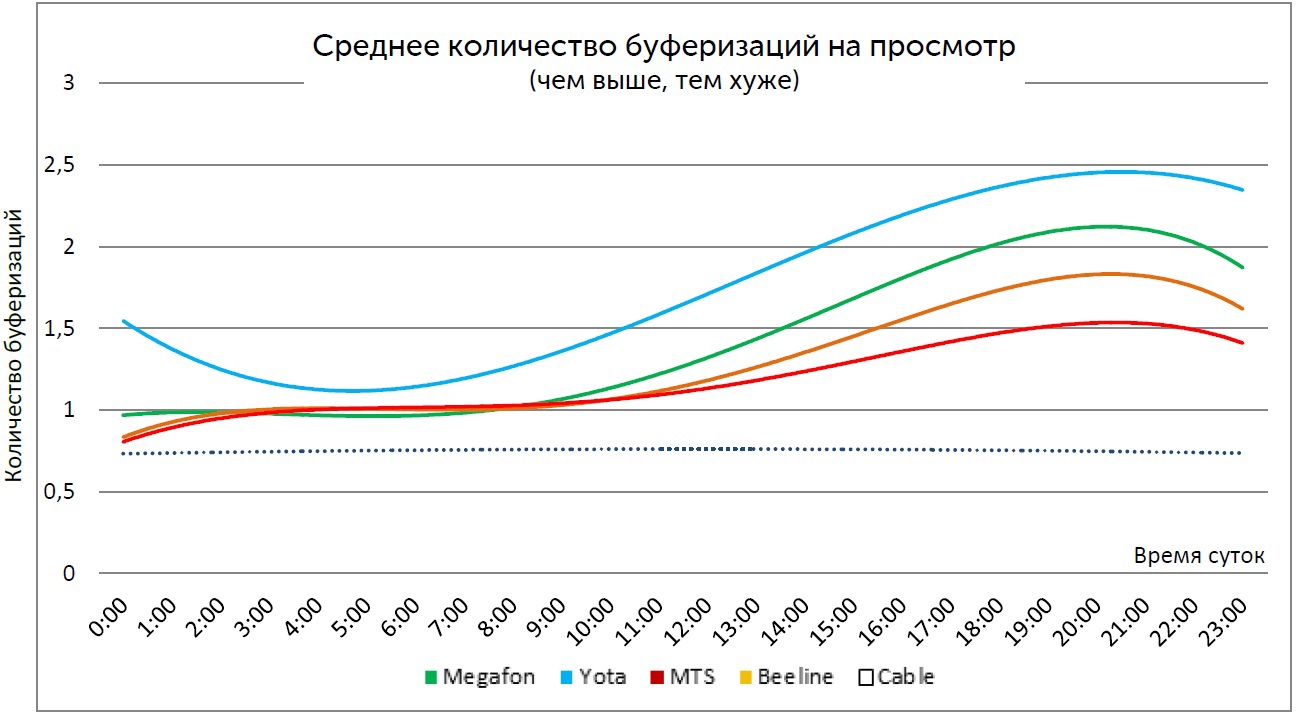
Figure 11. The average number of buffers on views with a duration of more than 10 minutes (St. Petersburg)
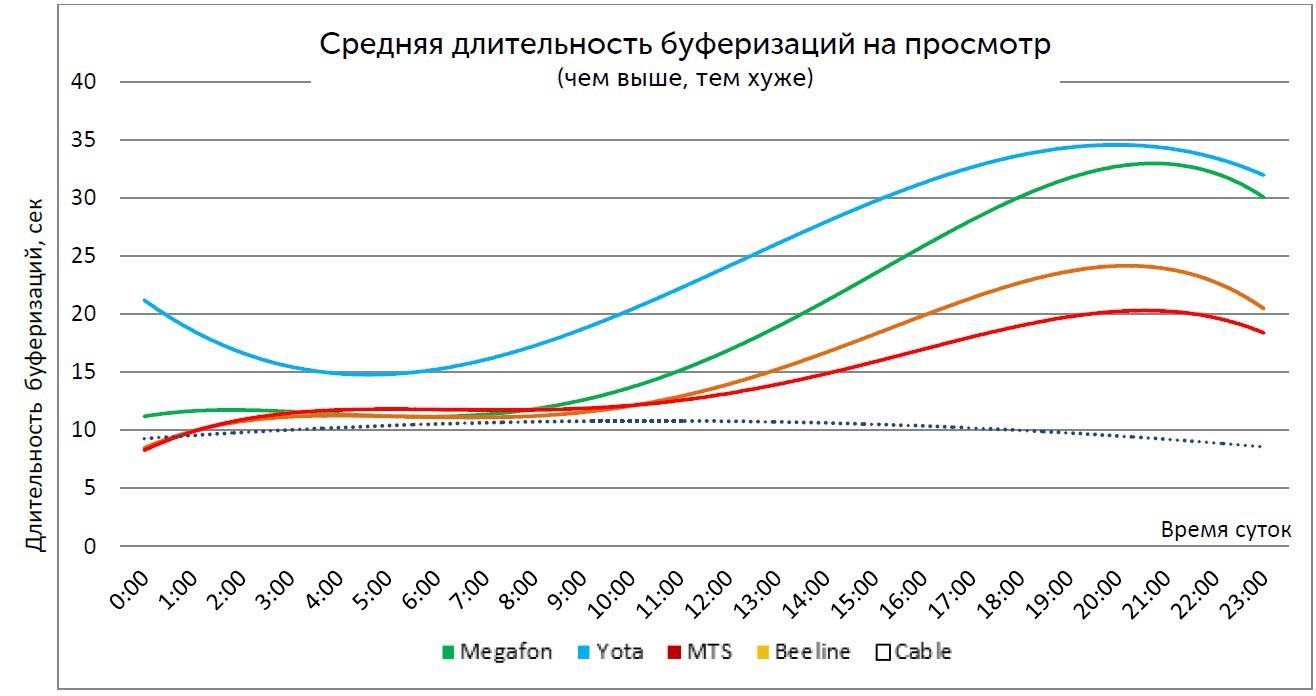
Figure 12. Average duration of buffering on views with a duration of more than 10 minutes (St. Petersburg)
4. The percentage of failure of subscribers from viewing during buffering (Subscriber Satisfaction Index)
The most impatient subscribers in YOTA.
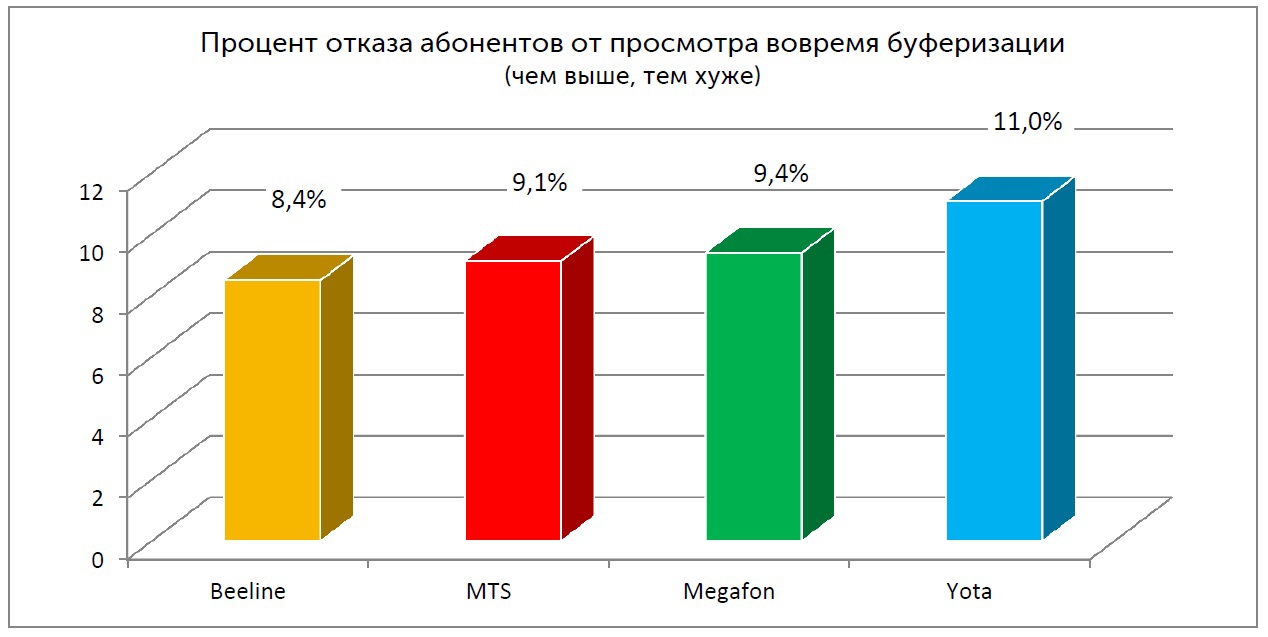
Figure 13. The percentage of failure of subscribers from viewing during buffering (St. Petersburg)
We thank you for your attention.
Yours sincerely, VIGO team.
Source: https://habr.com/ru/post/217069/
All Articles