Data mining in music. We define a musical instrument with the help of Classification Trees.
I welcome you, dear readers and writers of Habr!
It so happened that I am a music lover and programmer - and I once wanted to combine it.
I'll try to tell you what came of it.
This article will describe how I tried to create an algorithm that could determine on which instrument the melody was played.
Our raw data:
In the end, I want to get some values of attributes that would help classify musical signals and form the basis of the classification algorithm.
The strategy will be as follows:
Actually, that's about this, and it goes on.
')
At this stage, we use various methods (Fourier analysis and others) to obtain values for our 9 characteristics.
We use the method of hierarchical classification. The result of clustering by this method is shown in the figure below (clusters are marked with red circles).
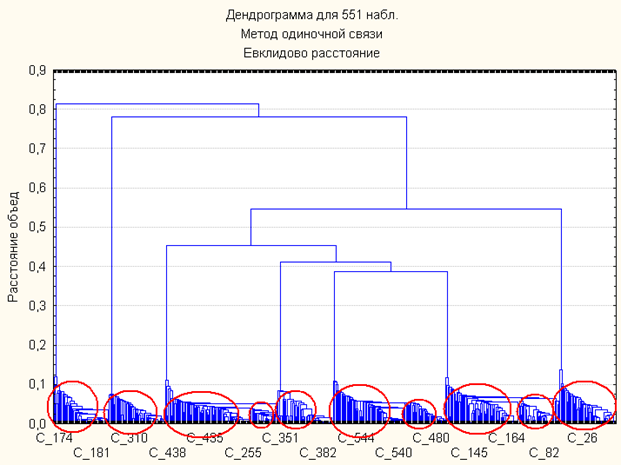
In this case, we can observe 10 clusters about which we are known a priori, thus, we still have the possibility of classification according to the existing set of input data.
The input data set at our disposal has a rather large dimension, and therefore it is not very convenient to work with it. We make an attempt to reduce the dimension of the input data, that is, to solve the problem of data reduction.
To do this, we will first use Factor analysis, as a coarser tool, and then apply the Multidimensional Scaling method to the results of Factor analysis.
We will conduct factor analysis. Since we do not know obviously how many factors will be allocated, we will spend for 9 factors. Own values are presented in the table below:
Eigenvalues Selection: Main Components
Sob. characters % total dispersion Cumulative. own value Cumulative. %
1 3,640494 40,44993 3,640494 40,4499
2 1.875795 20.84217 5.516289 61.2921
3 1,028626 11,42918 6,544915 72,7213
4 0.869353 9.65948 7.414268 82.3808
5 0.636831 7.07590 8.051100 89.4567
6 0.410692 4.56325 8.461792 94,0199
7 0.261768 2.90854 8.723560 96.9284
8 0.204545 2.27272 8.928105 99.2012
9 0.071895 0.79883 9.0000 100.0000
As we can see from this table, the total share of the explained variance does not exceed 80%, hence we can conclude that the data are non-linear, that is, the data are approximated by a non-linear model. The number of factors can be judged by the scree chart:
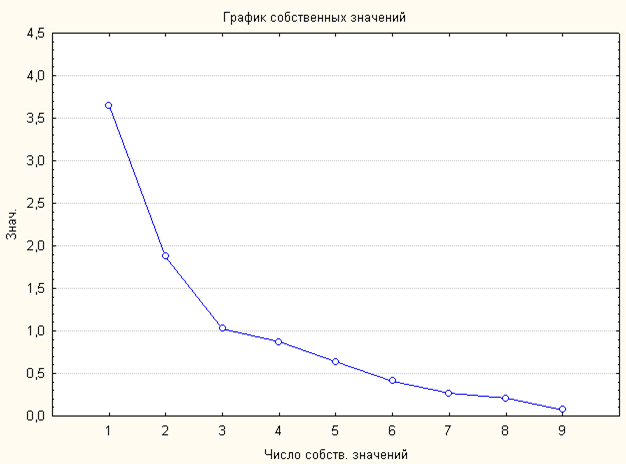
According to the schedule of scree, we see that there are 3 factors.
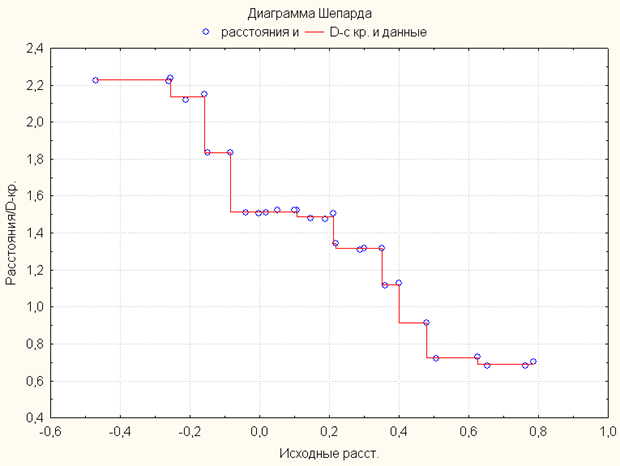
Analysis using the multidimensional scaling method did not improve the situation with data reduction. The fact that the multidimensional scaling did not produce results is indicated by the Shepard diagram, which for a successful analysis should be a direct one.
Considering that we know a priori about the existence of 10 clusters in the source data, and also that we have some evidence of their existence (that is, it is possible to classify according to the existing set of characteristics): the result of clustering according to the Hierarchical Classification method, as well as the findings of the preliminary study of input data - it was decided to apply a very "thin" tool - Classification Trees. It was also decided to apply the one-dimensional branch by the CART method, as the most accurate method for classification problems.
The algorithm built the following classification tree:
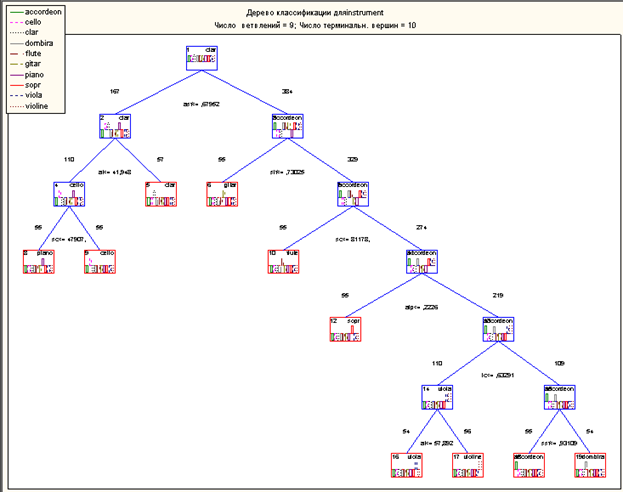
Let's make the description of the received results. As we can see, the classification tree is constructed correctly: we do not have repetitions at the terminal vertices, so a clear division into classes took place based on the values of the characteristics of the audio signal presented in the input data.
All experiments were carried out with the help of fellow musicians and the mathematical package Statistica.
As a result, the values of the signs of the audio signal were obtained, thanks to which I can recognize on which musical instrument the melody was played.
The algorithm works so far for melodies that are played on one musical instrument, but in the plans there are also multi-instrumental melodies.
It so happened that I am a music lover and programmer - and I once wanted to combine it.
I'll try to tell you what came of it.
This article will describe how I tried to create an algorithm that could determine on which instrument the melody was played.
So let's go
Our raw data:
- 550 entries of 5 minutes for 10 instruments - 55 entries per instrument.
- Musical instruments: piano, cello, dombra, flute, pipe, guitar, accordion, clarinet, viola, violin.
- 9 signs of a musical sound signal.
What do we want in the end?
In the end, I want to get some values of attributes that would help classify musical signals and form the basis of the classification algorithm.
How are we going to do
The strategy will be as follows:
- Input preparation
- Cluster analysis
- Reducing the dimension of the input data
- Analysis by Classification Trees
Actually, that's about this, and it goes on.
')
Input preparation
At this stage, we use various methods (Fourier analysis and others) to obtain values for our 9 characteristics.
Cluster analysis
We use the method of hierarchical classification. The result of clustering by this method is shown in the figure below (clusters are marked with red circles).
In this case, we can observe 10 clusters about which we are known a priori, thus, we still have the possibility of classification according to the existing set of input data.
Reducing the dimension of the input data
The input data set at our disposal has a rather large dimension, and therefore it is not very convenient to work with it. We make an attempt to reduce the dimension of the input data, that is, to solve the problem of data reduction.
To do this, we will first use Factor analysis, as a coarser tool, and then apply the Multidimensional Scaling method to the results of Factor analysis.
We will conduct factor analysis. Since we do not know obviously how many factors will be allocated, we will spend for 9 factors. Own values are presented in the table below:
Eigenvalues Selection: Main Components
Sob. characters % total dispersion Cumulative. own value Cumulative. %
1 3,640494 40,44993 3,640494 40,4499
2 1.875795 20.84217 5.516289 61.2921
3 1,028626 11,42918 6,544915 72,7213
4 0.869353 9.65948 7.414268 82.3808
5 0.636831 7.07590 8.051100 89.4567
6 0.410692 4.56325 8.461792 94,0199
7 0.261768 2.90854 8.723560 96.9284
8 0.204545 2.27272 8.928105 99.2012
9 0.071895 0.79883 9.0000 100.0000
As we can see from this table, the total share of the explained variance does not exceed 80%, hence we can conclude that the data are non-linear, that is, the data are approximated by a non-linear model. The number of factors can be judged by the scree chart:
According to the schedule of scree, we see that there are 3 factors.
Analysis using the multidimensional scaling method did not improve the situation with data reduction. The fact that the multidimensional scaling did not produce results is indicated by the Shepard diagram, which for a successful analysis should be a direct one.
Analysis by Classification Trees
Considering that we know a priori about the existence of 10 clusters in the source data, and also that we have some evidence of their existence (that is, it is possible to classify according to the existing set of characteristics): the result of clustering according to the Hierarchical Classification method, as well as the findings of the preliminary study of input data - it was decided to apply a very "thin" tool - Classification Trees. It was also decided to apply the one-dimensional branch by the CART method, as the most accurate method for classification problems.
The algorithm built the following classification tree:
Let's make the description of the received results. As we can see, the classification tree is constructed correctly: we do not have repetitions at the terminal vertices, so a clear division into classes took place based on the values of the characteristics of the audio signal presented in the input data.
Conclusion
All experiments were carried out with the help of fellow musicians and the mathematical package Statistica.
As a result, the values of the signs of the audio signal were obtained, thanks to which I can recognize on which musical instrument the melody was played.
The algorithm works so far for melodies that are played on one musical instrument, but in the plans there are also multi-instrumental melodies.
Source: https://habr.com/ru/post/216467/
All Articles