How is the infrastructure of data processing Sports.ru and Tribuna.com?
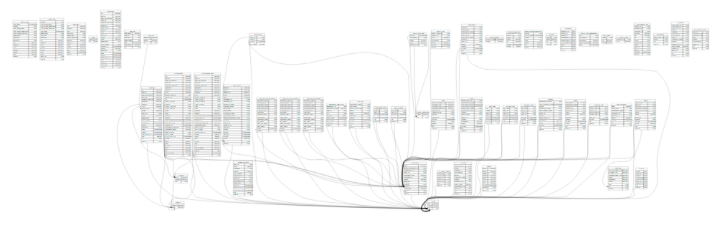
In the first post about the analytic system Sports.ru and Tribuna.com, we talked about how we use our infrastructure in everyday life: we fill with the content a recommendation system, monitor business metrics, look for diamonds among user content, find answers to the questions “How does better? ”and“ Why? ”, we cut users for mailing lists and build beautiful reports on the company's activities. We modestly hid the entire technical part of the narration behind this scheme:
Readers legitimately demanded to continue the story with funny cats , and olegbunin invited to tell about everything that was hidden in RHS ++ . Well, we will state some technical details - in the continuation of a fun post.
As Sports.ru evolved from a news site to a full-fledged social network, new data analysis services (similarweb, appanie, flurry, etc.) were added to familiar analytical tools like Google Analytics and Yandex.Metrica. In order not to be torn between a dozen different applications and have a common coordinate system for measuring metrics, we decided to collect all traffic data from all our websites, mobile applications and social streams in one repository.
')
We needed to get a single service for working with different data, which would allow journalists to monitor the popularity of texts and authors, social editorial staff to quickly respond to emerging trends, product managers to evaluate user involvement in our services, to receive experimental results when launching new functionality etc. We decided to store the collected data in such a way that it was easy to work with them, to be presented in a form convenient for various users: for journalists and for system administrators.
What did we need to count? Attendance of sites and mobile applications, the activity of registered users (comments, ratings, posts, subscriptions, registrations, etc.), the number of subscribers to our streams in social networks, the number of installations of mobile applications. As the monthly traffic volume approached 250 million hits and continued to grow, we decided not to use conventional relational DBMS, but to choose a technology that could easily scale with the growth of data. We wanted to have the simplest and most convenient access to the data, for example, in the form of SQL queries. As a result, we stopped at Redshift SaaS-storage, which was launched in the ecosystem of Amazon Web Services in early 2013.

Redshift is a distributed column DBMS with some special features, such as the lack of integrity constraints such as foreign keys or unique field values. Column DBMS stores records in such a way that queries with groupings and aggregate calculations for a large number of rows work as fast as possible. In this case, the selection of all fields of a single record by key (select * from table where id = N), as well as the operations of changing or adding one record can take longer to work than in conventional databases. More information about the device column DBMS can be read in this post .
Redshift bribed us with ease of access to data (you can work with it as with ordinary PostgreSQL), ease of scaling (as data grows, new servers are added in a couple of clicks, all data is redistributed automatically) and low implementation costs (compared to, for example, Apache Hadoop + Hive). At the very beginning, by the way, we thought about our Hadoop cluster, but we abandoned this idea, thus limiting ourselves and losing the possibility of creating personalized Realtime recommendations on our repository, using Apache Mahout, and generally launching some distributed algorithms that cannot describe in SQL.Not really wanted .
To store data about views and events on the pages, we use the client part of the Piwik open-ended counter, consisting of a javascript tracker and backend on PHP / MySQL, which we threw out as unnecessary. The counter asynchronously sends requests to servers with Nginx, where they are written to standard logs. The counter code looks like this:
Requests from the counter contain all the necessary data such as the address of the page, the User-Agent, the Referer, the source of the transition, the dates of the previous visit, the unique visitor ID from the Cookie, and so on. For each request, a user ID is added (if known), according to which we can combine data on views with data on user activity, which are accumulated in the site database (comments, posts, pros and cons). In addition, nginx writes to the logs information about the geographic location of the visitor (maxmind + ngx_http_geoip_module).
To write to Amazon Redshift, the data is converted to a CSV-like form, sent to Amazon S3 , and, if desired, broken up into several parts for fast download. Parsing the log is done by a simple script that selects the necessary data in one pass (see above) and makes simple transformations, such as translating the User-Agent into a Browser / OS pair.
Since each request from the counter contains a unique visitor ID and the time of the last visit to the site, there is no need to calculate user sessions at the data preparation stage. Moreover, data about page views from the same session can be recorded on different counter servers, therefore hits in the session are glued together already inside Redshift. Thus, we collect basic metrics like volume of impressions (inventory) or the number of unique users (audience) for any sections: site section, source, browser, etc. in our storage.
In most cases, when analyzing traffic, there is no need to learn something about a particular visitor or about one of his sessions, but it requires aggregate or averaged values like the number of unique visitors for a certain period or the average number of views per session. Therefore, it makes no sense to analyze directly the raw clickstream, which takes up a lot of space, and requests for it are not very fast.
We pack the collected data into aggregates suitable for further analysis, for example, we compose the entire user session, usually consisting of several hits, into one record, which reflects the main information about this visit: the duration and number of views per session, the source of the transition, and others visit data:
From this data, aggregators of the following level can be collected:
Working with final aggregates is much faster than with raw data: to obtain information about the inventory, you only need to take the total number of views of all sessions, and to assess the audience you will need to calculate the number of unique visitor IDs from a compressed 20 times (compared to the raw clickstream) array of data. To measure coverage in a specific section of the site, we create a separate profile (if we speak in GA terminology) in the form of a table and predict only those sessions that correspond to the sample conditions in this profile:
The grouping of clickstream hits in a session is done by a SQL query once a day and takes several seconds. In addition to aggregating data on visits, we also consider information on user activity by day, week, and month, so that such data is instantly available for relevant reports. We are storing the clickstream in Redshift over the last month so that you can make arbitrary requests for any cuts, as well as have fresh data for the last hour.
We do not sample the source data: we collect information about each page display, so we always have the opportunity to count statistics on any page in any dimension, even if such a page collected only 10 hits per month. We store the old data of the clickstream (older than a month) in backup files and can import them into Redshift at any time.
In order to be able to work simultaneously with data about page views and user actions (pluses to blog posts, comments, management of teams in fantasy tournaments, etc.), we import part of user data from the site database into Redshift. In this case, full texts of posts or news, as well as personal data (email, names, logins, passwords) are not transferred to Redshift.
User activity data is aggregated by day, week, and month so that you can quickly build engagement reports. For example, you can follow the number of new active users (who added, commented, started teams in fantasy tournaments or performed any other actions on the site) by day:
In order to receive a list of active fans of the Lesotho national team from Saratov for email, who have visited us at least twice in the last week and have visited the site for more than three weeks in a row, you can do this request:
As a result, we have the opportunity to observe the activity of users in different dimensions:
We collect data about our subscribers on Facebook, Twitter and Vkontakte once a day and, like all other statistics, add them to Redshift. To obtain data on the number of subscribers in Facebook groups, use the Graph API:
The VKontakte API also allows you to get data about groups using the groups.getById method:
Twitter, after updating its API, began to request authorization and tightened the limits on the frequency of requests, so data on our five hundred accounts began to be collected for too long, so we use several accounts and access token keys to get statistics on our threads on Twitter. We use tweepy to work with the Twitter API.
After all the imports and conversions, we get a table in Redshift with the dynamics of changes in the number of subscribers by day:
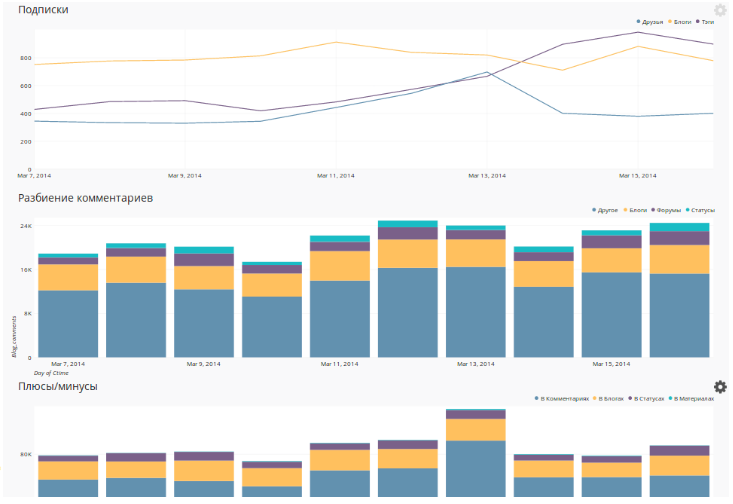
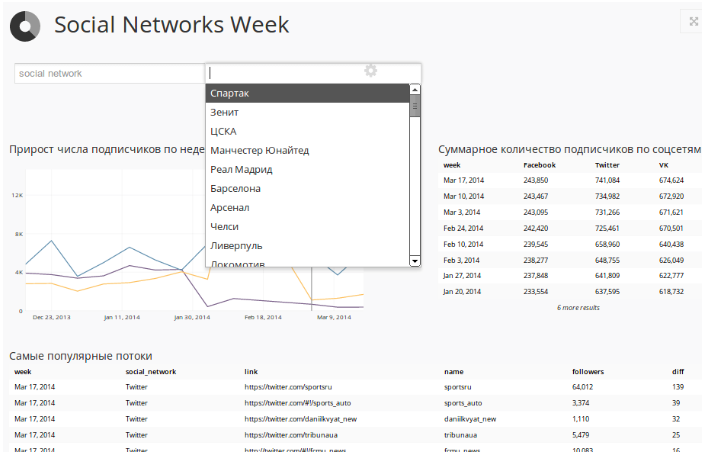
Over these data, an interactive panel is built in Chart.io, which allows you to monitor all our streams in social networks:
In order not to waste time on developing a graphical interface, we decided to use a third-party service for drawing graphs and tables Chart.io . It has ready connectors for Redshift, Google Analytics and other data sources, supports caching query results on its side. Data for a chart can be queried by a SQL query or using a convenient interface where you can select metrics, dimensions, and filters.
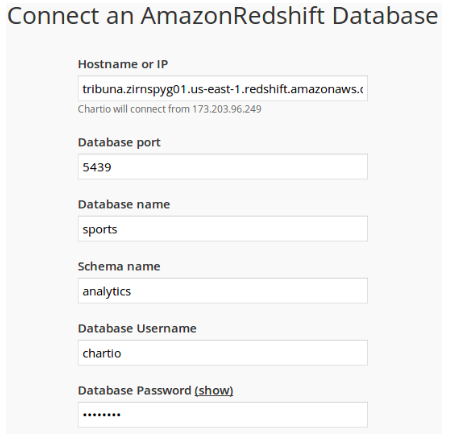
In order to connect Chartio to the database, simply specify the host, port and login with the password to connect to Redshift, and in the settings of Amazon Web Services you need to allow access to the data from the Chart.io servers:
In order to build a graph with a division of the number of comments by types of commented content and dynamics by day, it is enough to indicate the fields by which data will be grouped, and the selection conditions:
Simple mathematical functions can be applied to selected data:

After that you need to select the type of graphics:
And the interactive panel is ready for use. Actually, in this way we are overlaid with all sorts of graphs and tables on a large range of analytical data. Having spent less than 3 months on development, we were able to make arbitrary requests to data from all the right sources, not limited to standard Google Analytics dashboards.
In addition to the basic analytical tools of the company's employees, we began to build data-services for our users. For example, we with a certain accuracy calculate the visitor's interest in a particular club, athlete, tournament and use this knowledge to form a personalized menu of the site and links to frequently visited pages. We use information about the tags of materials that the visitor reads, sometimes we enrich this knowledge with other signals (transitions from the club's fan site or from the thematic ad of contextual advertising).

Talk about our data processing infrastructure is endless. We will continue a detailed conversation within our section at RIT ++ , where we will talk more about the architecture, cost of implementation and ownership, discuss user campaigning for mailing lists, realtime content recommendations, monitoring business metrics, and also searching for bots among users and formation of client profiles.
Readers legitimately demanded to continue the story with funny cats , and olegbunin invited to tell about everything that was hidden in RHS ++ . Well, we will state some technical details - in the continuation of a fun post.
Storage
As Sports.ru evolved from a news site to a full-fledged social network, new data analysis services (similarweb, appanie, flurry, etc.) were added to familiar analytical tools like Google Analytics and Yandex.Metrica. In order not to be torn between a dozen different applications and have a common coordinate system for measuring metrics, we decided to collect all traffic data from all our websites, mobile applications and social streams in one repository.
')
We needed to get a single service for working with different data, which would allow journalists to monitor the popularity of texts and authors, social editorial staff to quickly respond to emerging trends, product managers to evaluate user involvement in our services, to receive experimental results when launching new functionality etc. We decided to store the collected data in such a way that it was easy to work with them, to be presented in a form convenient for various users: for journalists and for system administrators.
What did we need to count? Attendance of sites and mobile applications, the activity of registered users (comments, ratings, posts, subscriptions, registrations, etc.), the number of subscribers to our streams in social networks, the number of installations of mobile applications. As the monthly traffic volume approached 250 million hits and continued to grow, we decided not to use conventional relational DBMS, but to choose a technology that could easily scale with the growth of data. We wanted to have the simplest and most convenient access to the data, for example, in the form of SQL queries. As a result, we stopped at Redshift SaaS-storage, which was launched in the ecosystem of Amazon Web Services in early 2013.
You can manage your Redshift cluster through the web interface. There is simply no place
Redshift is a distributed column DBMS with some special features, such as the lack of integrity constraints such as foreign keys or unique field values. Column DBMS stores records in such a way that queries with groupings and aggregate calculations for a large number of rows work as fast as possible. In this case, the selection of all fields of a single record by key (select * from table where id = N), as well as the operations of changing or adding one record can take longer to work than in conventional databases. More information about the device column DBMS can be read in this post .
Redshift bribed us with ease of access to data (you can work with it as with ordinary PostgreSQL), ease of scaling (as data grows, new servers are added in a couple of clicks, all data is redistributed automatically) and low implementation costs (compared to, for example, Apache Hadoop + Hive). At the very beginning, by the way, we thought about our Hadoop cluster, but we abandoned this idea, thus limiting ourselves and losing the possibility of creating personalized Realtime recommendations on our repository, using Apache Mahout, and generally launching some distributed algorithms that cannot describe in SQL.
Any relational data from a canonical DBMS is easily transferred to the Redshift structure.
Traffic data collection
To store data about views and events on the pages, we use the client part of the Piwik open-ended counter, consisting of a javascript tracker and backend on PHP / MySQL, which we threw out as unnecessary. The counter asynchronously sends requests to servers with Nginx, where they are written to standard logs. The counter code looks like this:
<script type="text/javascript"> var _paq = _paq || []; _paq.push(["enableLinkTracking"]); _paq.push(["setTrackerUrl", "http://stat.sports.ru/p"]); _paq.push(["setSiteId", "1"]); _paq.push(["trackPageView"]); (function(w,d,s,u,e,p){ e=d.createElement(s); e.src=u;e.async=1; p=d.getElementsByTagName(s)[0]; p.parentNode.insertBefore(e,p);})(window,document,'script', 'http://stat.sports.ru/piwik.js'); </script> Very similar to GA counter code, isn't it?
Requests from the counter contain all the necessary data such as the address of the page, the User-Agent, the Referer, the source of the transition, the dates of the previous visit, the unique visitor ID from the Cookie, and so on. For each request, a user ID is added (if known), according to which we can combine data on views with data on user activity, which are accumulated in the site database (comments, posts, pros and cons). In addition, nginx writes to the logs information about the geographic location of the visitor (maxmind + ngx_http_geoip_module).
77.0.155.47 - - [31/Mar/2014:13:00:02 +0400] "GET /p?action_name=12 Sports.ru - - - Sports.ru&idsite=1&rec=1&r=878036&h=13&m=1&s=54&url=http%3A%2F%2Fwww.sports.ru%2Ffootball%2F&_id=4cfacf46947ecc9a&_idts=1396089767&_idvc=7&_idn=0&_refts=0&_viewts=1396218890&suid=4582d0d1-0b34-4208-b154-413de9cd40ee&suida=JcHxFVM2AIp2Rdr1C6q0Ag&tsl=1396256514&pdf=1&qt=0&realp=0&wma=0&dir=0&fla=1&java=1&gears=0&ag=1&cookie=1&res=1920x1080>_ms=1072 HTTP/1.1" 200 35 "http://www.sports.ru/football/" "Mozilla/5.0 (Windows NT 6.3) AppleWebKit/537.36 (KHTML, like Gecko) Chrome/33.0.1750.154 Safari/537.36" "-" "RU" "Grozny" 188.232.174.186 - - [31/Mar/2014:13:00:02 +0400] "GET /p?action_name=_event&idsite=1&rec=1&r=109951&h=13&m=1&s=53&url=http://www.sports.ru/football/4283301.html&_id=45af8e84654389f1&_idts=1392628066&_idvc=2&_idn=0&_refts=1396256513&_viewts=1392628066&_ref=http://www.sports.ru/&suida=JcHxFVMB0V0b91OfKBpEAg&tsl=1396256513&cvar=%7B%221%22%3A%5B%22Authors-News%22%2C%22%D0%AE%D1%80%D0%B8%D0%B9%20%D0%91%D0%BE%D0%B3%D0%B4%D0%B0%D0%BD%D0%BE%D0%B2%22%5D%7D&pdf=0&qt=0&realp=0&wma=0&dir=0&fla=0&java=0&gears=0&ag=0&cookie=1&res=1280x800>_ms=117 HTTP/1.1" 200 35 "http://www.sports.ru/football/159071418.html?ext=yandex" "Mozilla/5.0 (Windows NT 6.1; WOW64; rv:27.0) Gecko/20100101 Firefox/27.0" "-" "RU" "Zhukovskiy" % 2Fwww.sports.ru% 2Ffootball% 2F & _id = 4cfacf46947ecc9a & _idts = 77.0.155.47 - - [31/Mar/2014:13:00:02 +0400] "GET /p?action_name=12 Sports.ru - - - Sports.ru&idsite=1&rec=1&r=878036&h=13&m=1&s=54&url=http%3A%2F%2Fwww.sports.ru%2Ffootball%2F&_id=4cfacf46947ecc9a&_idts=1396089767&_idvc=7&_idn=0&_refts=0&_viewts=1396218890&suid=4582d0d1-0b34-4208-b154-413de9cd40ee&suida=JcHxFVM2AIp2Rdr1C6q0Ag&tsl=1396256514&pdf=1&qt=0&realp=0&wma=0&dir=0&fla=1&java=1&gears=0&ag=1&cookie=1&res=1920x1080>_ms=1072 HTTP/1.1" 200 35 "http://www.sports.ru/football/" "Mozilla/5.0 (Windows NT 6.3) AppleWebKit/537.36 (KHTML, like Gecko) Chrome/33.0.1750.154 Safari/537.36" "-" "RU" "Grozny" 188.232.174.186 - - [31/Mar/2014:13:00:02 +0400] "GET /p?action_name=_event&idsite=1&rec=1&r=109951&h=13&m=1&s=53&url=http://www.sports.ru/football/4283301.html&_id=45af8e84654389f1&_idts=1392628066&_idvc=2&_idn=0&_refts=1396256513&_viewts=1392628066&_ref=http://www.sports.ru/&suida=JcHxFVMB0V0b91OfKBpEAg&tsl=1396256513&cvar=%7B%221%22%3A%5B%22Authors-News%22%2C%22%D0%AE%D1%80%D0%B8%D0%B9%20%D0%91%D0%BE%D0%B3%D0%B4%D0%B0%D0%BD%D0%BE%D0%B2%22%5D%7D&pdf=0&qt=0&realp=0&wma=0&dir=0&fla=0&java=0&gears=0&ag=0&cookie=1&res=1280x800>_ms=117 HTTP/1.1" 200 35 "http://www.sports.ru/football/159071418.html?ext=yandex" "Mozilla/5.0 (Windows NT 6.1; WOW64; rv:27.0) Gecko/20100101 Firefox/27.0" "-" "RU" "Zhukovskiy" = JcHxFVM2AIp2Rdr1C6q0Ag & tsl = 77.0.155.47 - - [31/Mar/2014:13:00:02 +0400] "GET /p?action_name=12 Sports.ru - - - Sports.ru&idsite=1&rec=1&r=878036&h=13&m=1&s=54&url=http%3A%2F%2Fwww.sports.ru%2Ffootball%2F&_id=4cfacf46947ecc9a&_idts=1396089767&_idvc=7&_idn=0&_refts=0&_viewts=1396218890&suid=4582d0d1-0b34-4208-b154-413de9cd40ee&suida=JcHxFVM2AIp2Rdr1C6q0Ag&tsl=1396256514&pdf=1&qt=0&realp=0&wma=0&dir=0&fla=1&java=1&gears=0&ag=1&cookie=1&res=1920x1080>_ms=1072 HTTP/1.1" 200 35 "http://www.sports.ru/football/" "Mozilla/5.0 (Windows NT 6.3) AppleWebKit/537.36 (KHTML, like Gecko) Chrome/33.0.1750.154 Safari/537.36" "-" "RU" "Grozny" 188.232.174.186 - - [31/Mar/2014:13:00:02 +0400] "GET /p?action_name=_event&idsite=1&rec=1&r=109951&h=13&m=1&s=53&url=http://www.sports.ru/football/4283301.html&_id=45af8e84654389f1&_idts=1392628066&_idvc=2&_idn=0&_refts=1396256513&_viewts=1392628066&_ref=http://www.sports.ru/&suida=JcHxFVMB0V0b91OfKBpEAg&tsl=1396256513&cvar=%7B%221%22%3A%5B%22Authors-News%22%2C%22%D0%AE%D1%80%D0%B8%D0%B9%20%D0%91%D0%BE%D0%B3%D0%B4%D0%B0%D0%BD%D0%BE%D0%B2%22%5D%7D&pdf=0&qt=0&realp=0&wma=0&dir=0&fla=0&java=0&gears=0&ag=0&cookie=1&res=1280x800>_ms=117 HTTP/1.1" 200 35 "http://www.sports.ru/football/159071418.html?ext=yandex" "Mozilla/5.0 (Windows NT 6.1; WOW64; rv:27.0) Gecko/20100101 Firefox/27.0" "-" "RU" "Zhukovskiy" From the counter on the backend there are only entries in the nginx access-log
To write to Amazon Redshift, the data is converted to a CSV-like form, sent to Amazon S3 , and, if desired, broken up into several parts for fast download. Parsing the log is done by a simple script that selects the necessary data in one pass (see above) and makes simple transformations, such as translating the User-Agent into a Browser / OS pair.
77.0.155.47|2014-03-31 13:00:02|1| , , , , , , , - Sports.ru|9cfacf46947ecc9a|8582d0d1-0b34-4208-b154-413de9cd40ee|JdHxFVM2AIp2Rdr1C6q0Ag|2014-03-29 14:42:47|7|0|||1970-01-01 04:00:00|2014-03-31 02:32:58|1970-01-01 04:00:00|||||13|1|54|0|0|RU|Grozny|Chrome|33.0.1750|Windows||Other|/football/|/football/ 233.91.249.44|2014-03-31 13:00:02|1| : « » - - Sports.ru|a3e990633872eb74||JcHxFVKB2Z0nhRhOJHMEAg|2014-03-17 07:55:17|12|0|||2014-03-31 13:01:22|2014-03-31 11:08:01|1970-01-01 04:00:00|hideme.ru/||||13|1|52|2|159076870|RO|Bucharest|Firefox|27|Windows XP||Other|/others/figure-skating/159076870.html|/others/figure-skating/159076870.html|http://alu5.ojf6lnoa.owl.e/others/ The data prepared for uploading to Redshift looks like this.
Since each request from the counter contains a unique visitor ID and the time of the last visit to the site, there is no need to calculate user sessions at the data preparation stage. Moreover, data about page views from the same session can be recorded on different counter servers, therefore hits in the session are glued together already inside Redshift. Thus, we collect basic metrics like volume of impressions (inventory) or the number of unique users (audience) for any sections: site section, source, browser, etc. in our storage.
| timestamp | uid | url | visits_count | new_visitor | last_visit_ts |
|---|---|---|---|---|---|
| 3/25/2014 17:42:00 | 108e36856acb1384 | / | 0 | one | Null |
| 3/25/2014 17:43 | 108e36856acb1385 | / football / | 0 | one | Null |
| 3/25/2014 23:42:00 | 108e36856acb1384 | / cska / | one | 0 | 3/25/2014 17:42:00 |
Raw data (clickstream) is added to Redshift into similar structures.
In most cases, when analyzing traffic, there is no need to learn something about a particular visitor or about one of his sessions, but it requires aggregate or averaged values like the number of unique visitors for a certain period or the average number of views per session. Therefore, it makes no sense to analyze directly the raw clickstream, which takes up a lot of space, and requests for it are not very fast.
We pack the collected data into aggregates suitable for further analysis, for example, we compose the entire user session, usually consisting of several hits, into one record, which reflects the main information about this visit: the duration and number of views per session, the source of the transition, and others visit data:
| start | end | uid | last_visit_ts | pageviews |
|---|---|---|---|---|
| 3/25/2014 17:42:00 | 3/25/2014 17:43 | 108e36856acb1384 | Null | 2 |
| 3/25/2014 23:42:00 | 3/25/2014 23:53:00 | 108e36856acb1385 | 3/25/2014 17:42:00 | four |
| 3/26/2014 0:42:00 | 3/25/2014 0:43 | 108e36856acb1385 | 3/25/2014 23:42:00 | 2 |
In this form, aggregated data is presented for the sessions.
From this data, aggregators of the following level can be collected:
| date | uid | pageviews | sessions |
|---|---|---|---|
| 3/25/2014 | 108e36856acb1384 | 6 | 2 |
| 3/25/2014 | 108e36856acb1385 | 2 | one |
| 3/25/2014 | a3e990633872eb74 | 12 | 3 |
Aggregated Visitor Data
Working with final aggregates is much faster than with raw data: to obtain information about the inventory, you only need to take the total number of views of all sessions, and to assess the audience you will need to calculate the number of unique visitor IDs from a compressed 20 times (compared to the raw clickstream) array of data. To measure coverage in a specific section of the site, we create a separate profile (if we speak in GA terminology) in the form of a table and predict only those sessions that correspond to the sample conditions in this profile:
INSERT INTO sessions (uid,last_visit_ts, start, end, pageviews) SELECT uid, last_visit_ts, min(ts), max(ts), count(uid) FROM clickstream WHERE timestamp > date_trunc('hour', NOW()) - interval '24 hours' GROUP BY uid, last_visit_ts The grouping of clickstream hits in a session is done by a SQL query once a day and takes several seconds. In addition to aggregating data on visits, we also consider information on user activity by day, week, and month, so that such data is instantly available for relevant reports. We are storing the clickstream in Redshift over the last month so that you can make arbitrary requests for any cuts, as well as have fresh data for the last hour.
We do not sample the source data: we collect information about each page display, so we always have the opportunity to count statistics on any page in any dimension, even if such a page collected only 10 hits per month. We store the old data of the clickstream (older than a month) in backup files and can import them into Redshift at any time.
User data collection
In order to be able to work simultaneously with data about page views and user actions (pluses to blog posts, comments, management of teams in fantasy tournaments, etc.), we import part of user data from the site database into Redshift. In this case, full texts of posts or news, as well as personal data (email, names, logins, passwords) are not transferred to Redshift.
User activity data is aggregated by day, week, and month so that you can quickly build engagement reports. For example, you can follow the number of new active users (who added, commented, started teams in fantasy tournaments or performed any other actions on the site) by day:
SELECT day, new_users, new_active_users FROM user_activities_day ORDER BY day LIMIT 7 day new_users new_active_users 2014-02-15 2051 508 2014-02-16 1608 366 2014-02-17 1052 419 2014-02-18 2131 603 2014-02-19 2374 547 2014-02-20 1340 508 2014-02-21 966 340 In order to receive a list of active fans of the Lesotho national team from Saratov for email, who have visited us at least twice in the last week and have visited the site for more than three weeks in a row, you can do this request:
SELECT ul.user_id FROM user_log ul INNER JOIN user_tags ut ON ut.user_id = ul.user_id WHERE ul.last_week_sessions > 2 -- - 7 AND ul.weeks > 3 -- - AND ul.city = '' AND ut.tag = ' ' As a result, we have the opportunity to observe the activity of users in different dimensions:
Integration with social networking API
We collect data about our subscribers on Facebook, Twitter and Vkontakte once a day and, like all other statistics, add them to Redshift. To obtain data on the number of subscribers in Facebook groups, use the Graph API:
$ curl http://graph.facebook.com/sportsru?fields=likes { "likes": 238845, "id": "110179310119" } The VKontakte API also allows you to get data about groups using the groups.getById method:
$ curl https://api.vk.com/method/groups.getById?gid=sportsru&fields=members_count { "response": [ { ... "screen_name": "sportsru", "members_count": 280548, ... } ] } Twitter, after updating its API, began to request authorization and tightened the limits on the frequency of requests, so data on our five hundred accounts began to be collected for too long, so we use several accounts and access token keys to get statistics on our threads on Twitter. We use tweepy to work with the Twitter API.
After all the imports and conversions, we get a table in Redshift with the dynamics of changes in the number of subscribers by day:
| date | social network id | tag | followers |
|---|---|---|---|
| 2014-03-26 | CSKA | 10315 | |
| 2014-03-26 | VK | Premier League (England) | 133427 |
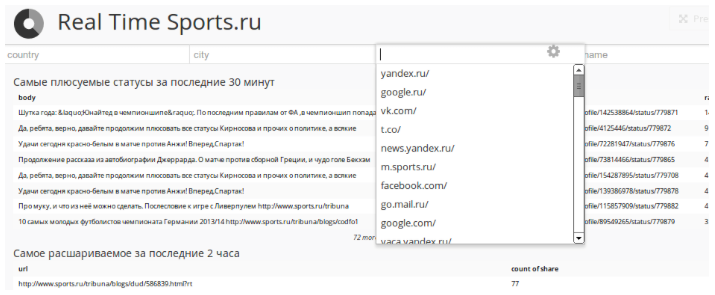
Over these data, an interactive panel is built in Chart.io, which allows you to monitor all our streams in social networks:
Data visualization
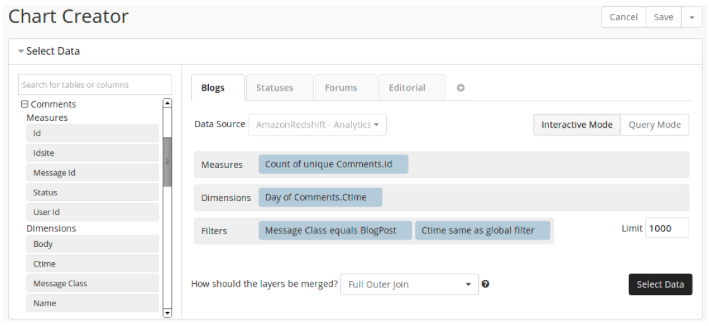
In order not to waste time on developing a graphical interface, we decided to use a third-party service for drawing graphs and tables Chart.io . It has ready connectors for Redshift, Google Analytics and other data sources, supports caching query results on its side. Data for a chart can be queried by a SQL query or using a convenient interface where you can select metrics, dimensions, and filters.
In order to connect Chartio to the database, simply specify the host, port and login with the password to connect to Redshift, and in the settings of Amazon Web Services you need to allow access to the data from the Chart.io servers:
In order to build a graph with a division of the number of comments by types of commented content and dynamics by day, it is enough to indicate the fields by which data will be grouped, and the selection conditions:
Simple mathematical functions can be applied to selected data:
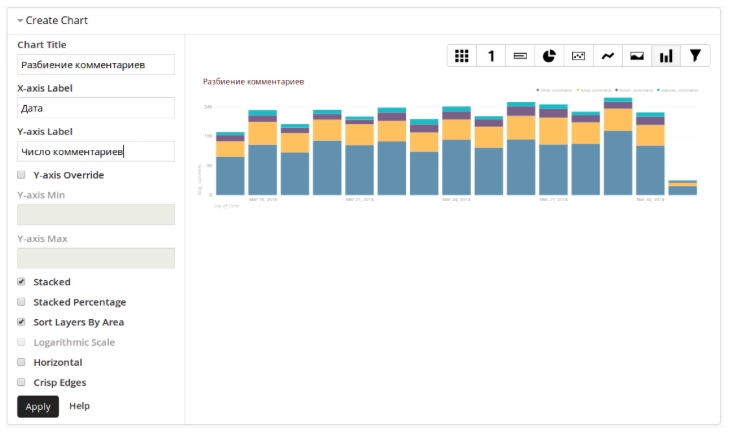
After that you need to select the type of graphics:
And the interactive panel is ready for use. Actually, in this way we are overlaid with all sorts of graphs and tables on a large range of analytical data. Having spent less than 3 months on development, we were able to make arbitrary requests to data from all the right sources, not limited to standard Google Analytics dashboards.
What else?
In addition to the basic analytical tools of the company's employees, we began to build data-services for our users. For example, we with a certain accuracy calculate the visitor's interest in a particular club, athlete, tournament and use this knowledge to form a personalized menu of the site and links to frequently visited pages. We use information about the tags of materials that the visitor reads, sometimes we enrich this knowledge with other signals (transitions from the club's fan site or from the thematic ad of contextual advertising).
Talk about our data processing infrastructure is endless. We will continue a detailed conversation within our section at RIT ++ , where we will talk more about the architecture, cost of implementation and ownership, discuss user campaigning for mailing lists, realtime content recommendations, monitoring business metrics, and also searching for bots among users and formation of client profiles.
Source: https://habr.com/ru/post/216229/
All Articles