Network detectives: looking for the causes of traffic surges and load
Suppose we have this picture of the loading channel of communication:

What caused the surge in traffic? What happened in the communication channel?
The action takes place in a large data center, for example, a bank. And in the channel there can be anything from test services, or one of a dozen business services, and also - with equal success - a backup of the database.
')
If the admin is not completely Krivorukov, and the situation is not very tricky, then in 10 minutes it will be possible to identify specific causes that create problems, and another 15-20 minutes to analyze the problem. If the situation is more complicated (we will consider another example below), then you can look for anomalies in the behavior of traffic for days. With the toolkit for detecting such anomalies, it will take 1 minute to find the problem in this example.
Here is a simple example. There was a surge in traffic in the communication channel, because of which there were brakes for applications from users.
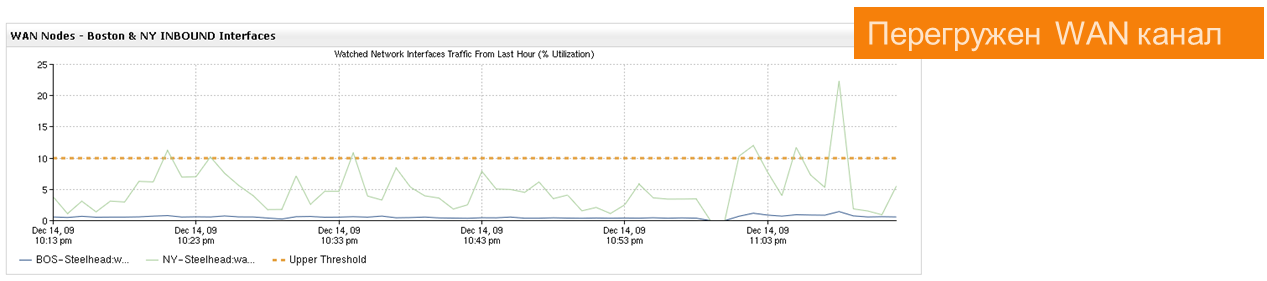
We want to understand: the traffic of which applications / services is transmitted in the communication channel and what caused the surge?

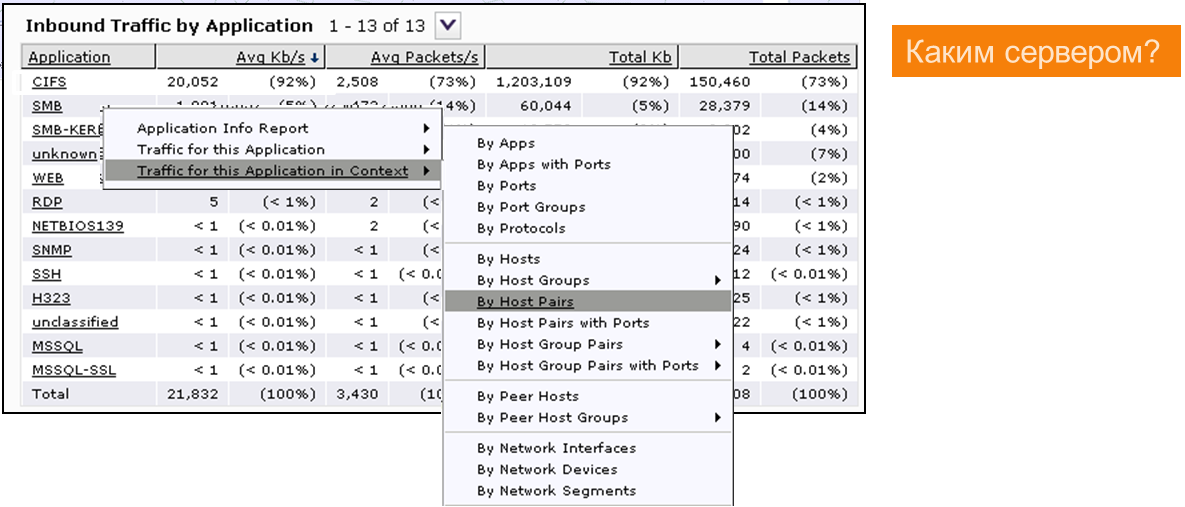
Yeah, I see ... CIFS - 92% of the total traffic.

We find out who worked there (which hosts and users).
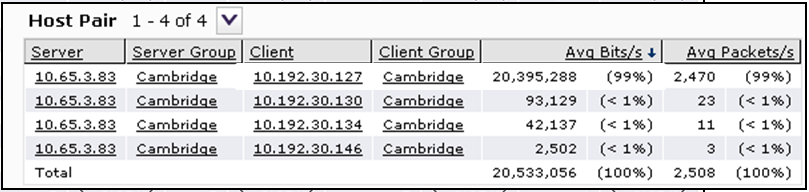
The first pair of client - server loaded communication channel at 99% via CIFS.
If we have diagnostic system integration with Active Directory, we can find out who it is. We try.
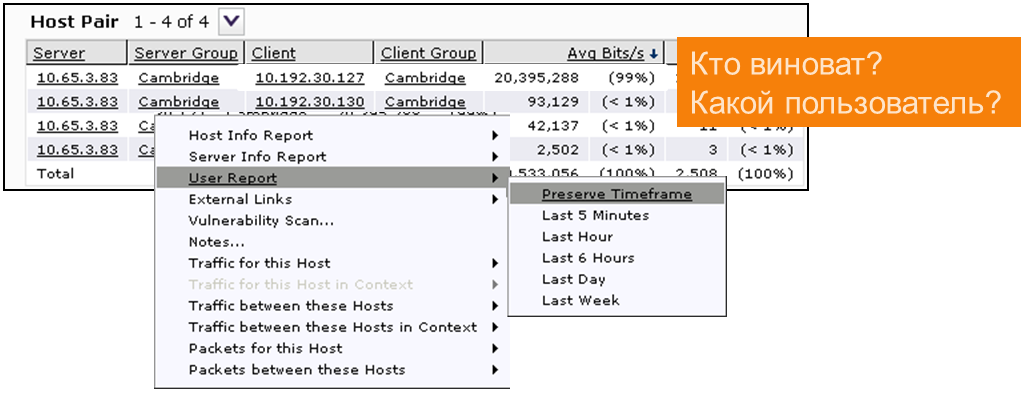
We have a certain John Smith. The problem has a surname. And all this in 1 minute.

I want to add that all transitions between the reports created in the example are performed by clicking the right mouse button and selecting a report from the context menu that appears.
Now let's see an example more difficult when the whole ERP-system slows down.
So, there is such a picture:
ERP slows down, users complain. Why? Where to look? Where to see?
Of course, you can search for reasons manually. This is interesting, but if there are several dozen problems, it is tiring and long. Plus, you need to use a lot of your own or third-party modules to analyze traffic, its collection and evaluation. Fortunately, we have a tool that allows you to get all the data at once and in one place. This is Riverbed Cascade.
Suppose this is not just one problem, but a whole bunch of different tasks analyzing the degradation of business services. In a normal network with "intelligence" we need to understand:
The complete solution consists of three and a half parts:

Example for a specific data center: all three modules are installed. Shark Sensor receives mirrored data from the server farm switch, Virtual Shark analyzes the interactions between virtual machines — Gateway receives flow from routers and optimizers. Then all the statistics goes to the profiler. Pilot works with a copy of the traffic stored on the Shark Sensor
We return to the ERP problem.
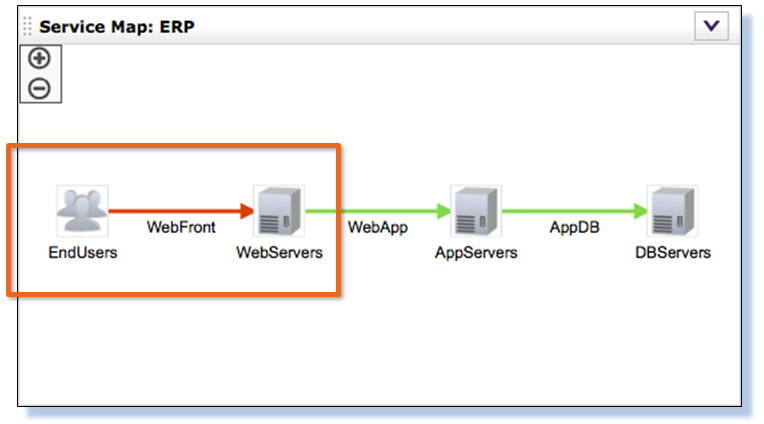
We begin to understand what happened on the segment between end users and Web servers, why the system signaled this.
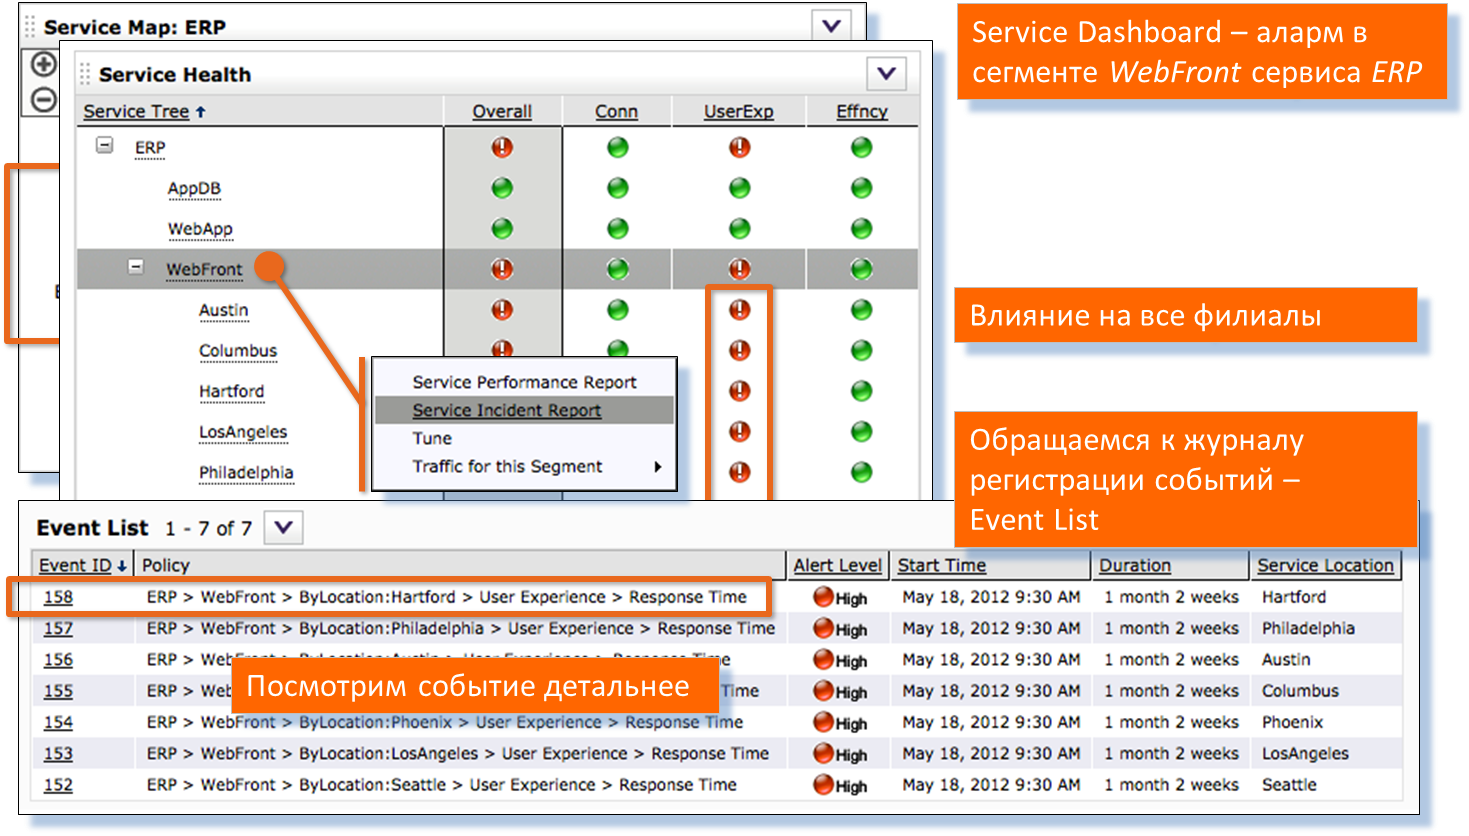
Go to the semaphore system on the desktop. It is seen that the problem is for all remote branches of the company. We look incidents on this problem. We proceed to a detailed analysis - it is clear that we have increased the response time from the server. The graphs and tables below are created in a single report.
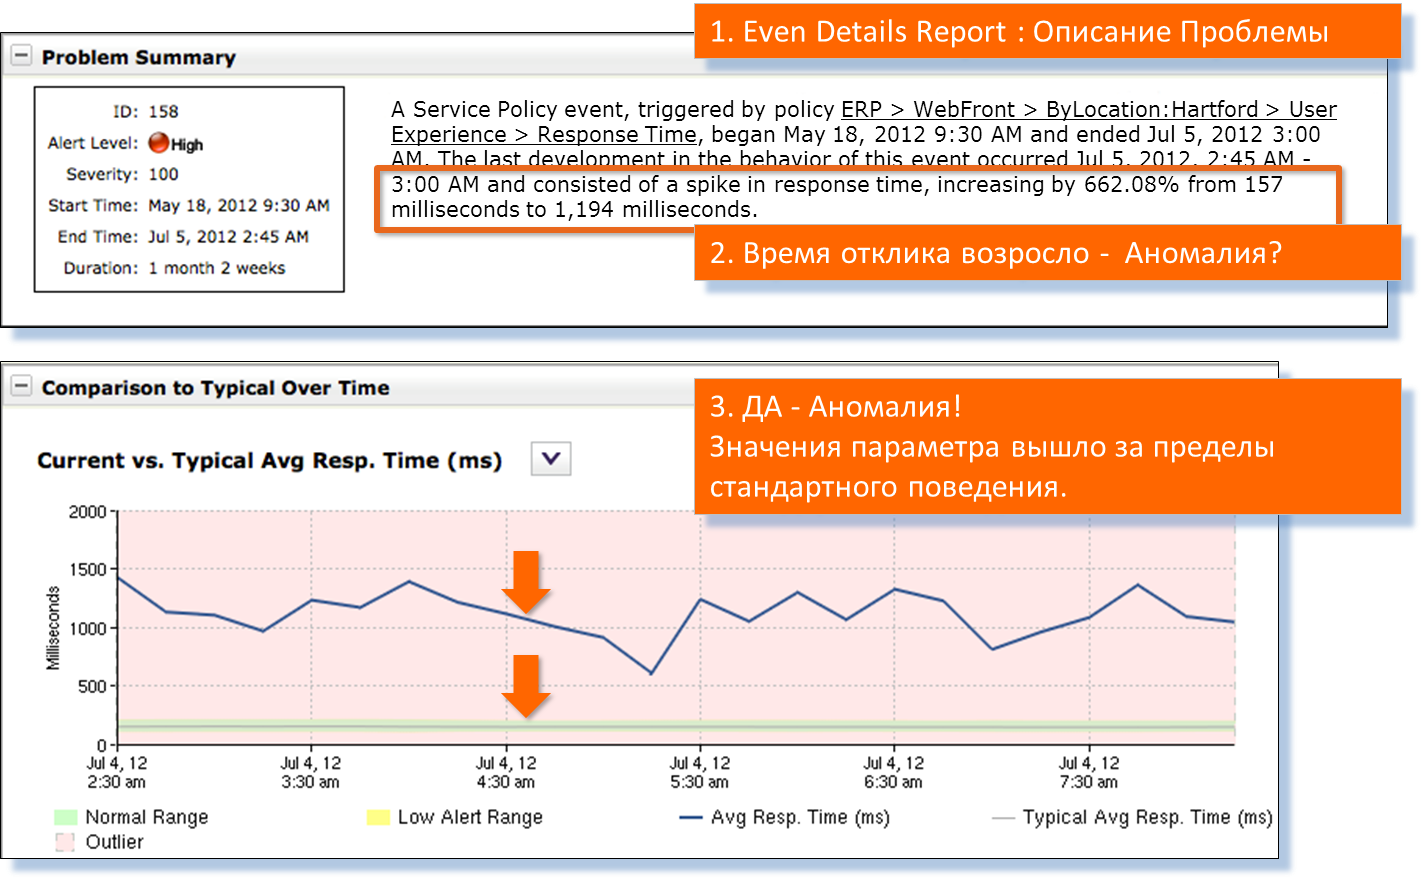
The green bar at the bottom of the chart is the normal profile of the server. This should be a stable server.
On the graph, the actual response time of the server is shown in blue. Scroll the report below.

We look at the interaction of clients and servers. It is seen that all customers have problems to one degree or another. At the same time, only one server has a problem from the server cluster.
Consider the statistics of the problem server.

We see the MAC address of the server, the IP address of the switch and the port of the switch where the server is connected. Consider the transactions of the problem server in the GUI to Wireshark - Pilot Console.
On the server response time report by objects, it can be seen that the time to provide only one object is increased.

Here he is: complex.psp
We are checking. Build a transaction interaction diagram. Checking:
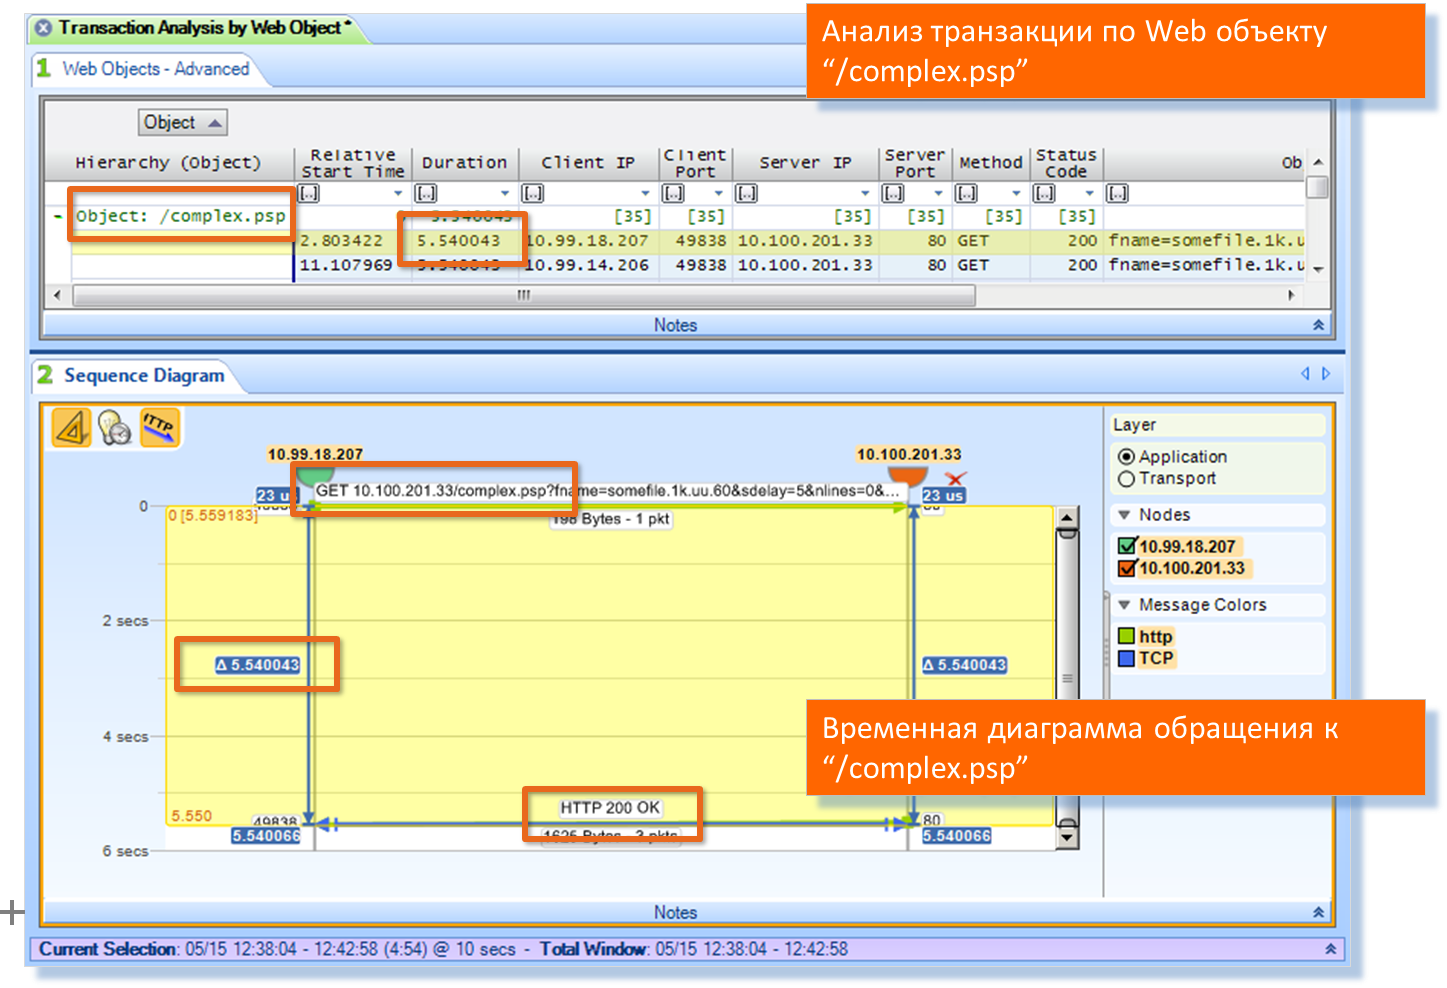
Yes that's it.
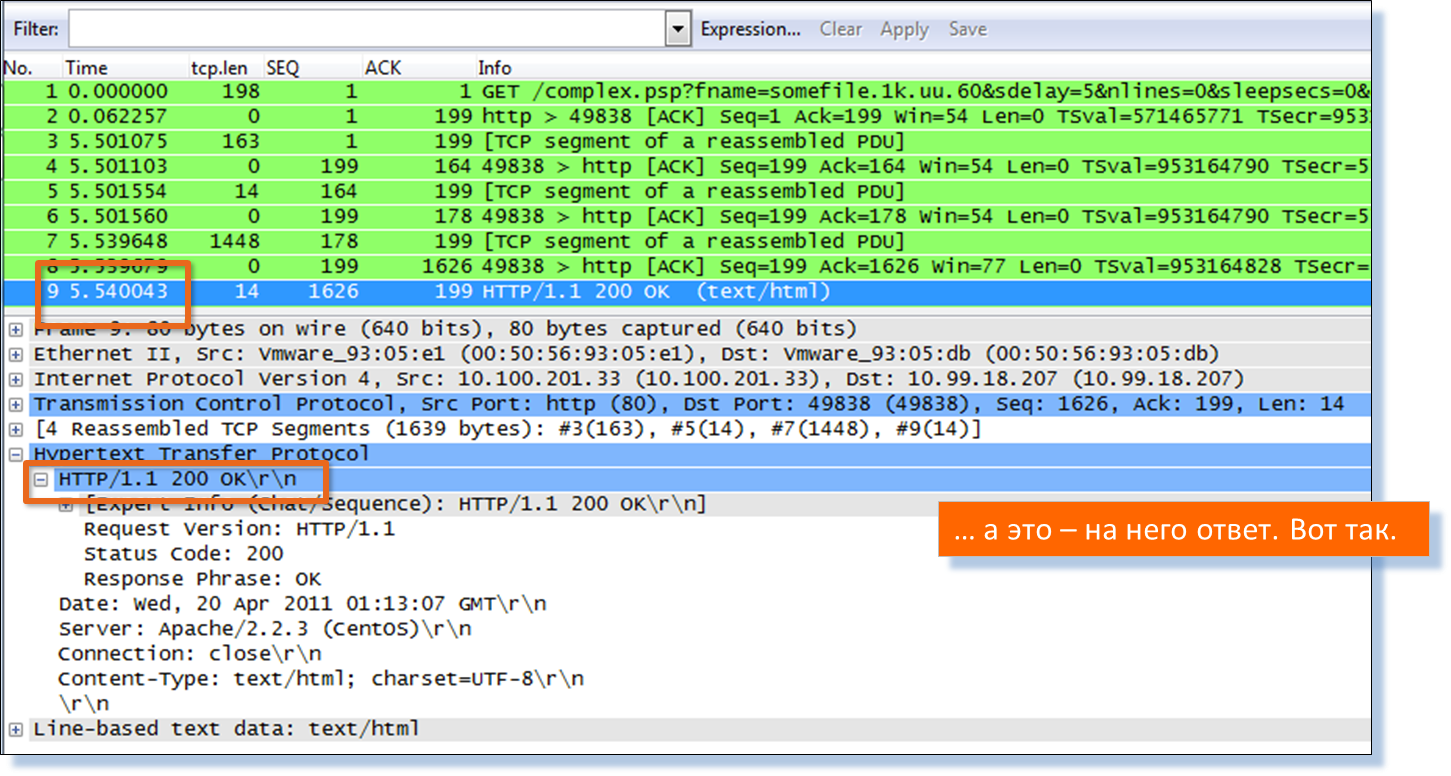
If anyone does not believe, let him check - go to manual batch analysis in Wireshark of the same transaction.

So, we have just received a comprehensive picture of the interaction of users with the Web servers of the ERP service, which made it possible to find a failed Web server, or even more precisely, a failed object on the server.
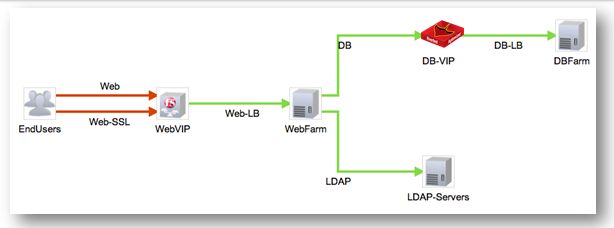
We see a picture of a multi-level application showing all components, including traffic load balancers. The system visually immediately makes it clear which segment needs to analyze the degradation of the service as a whole: the end-user segment is marked in red when accessing the VIP address of the traffic balancer. Then you can proceed to a detailed analysis of traffic on this segment and analyze the performance of the traffic balancer. There is no need to analyze each segment of a multi-level application manually and understand how the components of this application interact with each other: when you first look at the map of the interaction of the application components, everything becomes clear visually.
In a previous post, I already wrote about traffic optimizer devices that can perfectly compress data channels and are often used by banks, telecom operators and other large companies, as well as medium-sized and large businesses seeking to make better use of a communication channel and speed up application performance. So, since optimizers are a product of the same manufacturer, network statistics from them can be collected using the Riverbed Cascade monitoring system. Two solutions are excellent (and cheap, which is important) are combined, which comprehensively solves the problems of the productivity of applications of companies.
These indicators of traffic optimization are collected just Riverbed Cascade:

Ratio of LAN traffic (blue graph) and WAN traffic (green graph) with optimization. It is clearly seen how the volume of traffic in the communication channel has decreased.
Traffic Optimization by Application and Percentage of Reduced Bandwidth Usage of Each
The solution is used, of course, not only to localize problems and anomalies in the behavior of application traffic. It is very convenient to build reports, for example, for planning infrastructure development. For example, a report on traffic volumes and its types by branches allows you to find a city that leads on Citrix traffic, and evaluate the benefits of optimizing this direction.
You can look for problems both in historical section and in real time by the fact of their occurrence (and here you will be damn glad that there is such a powerful assistant).
Riverbed's solution has another great function — behavioral analytics. As you know, one of the most important tasks is timely informing interested parties about the degradation of business services. Typically, systems only allow fixed thresholds for application performance metrics. They must come up with the administrator himself.
Here Riverbed Cascade bypasses all competitors: it removes dozens of metrics and builds profiles of the normal behavior of each metric. Threshold values should not be set, the system will collect historical statistics, and on its basis threshold values will be generated. And in case of deviation from the norm, the system will inform the administrator or his manager.
In addition to analytics of application performance, the system includes security analytics functionality. Namely: the system will warn the administrator in the event that:
And even if the installed anti-virus systems do not see the spread of a new virus on the network, Riverbed Cascade will detect the spread of a “worm” in the anomalous traffic that has appeared.
We implemented this solution (complete with traffic optimization) for a gold mining company, for a geographically distributed bank, a logistics company, we completed a project for an energy company and dozens of smaller projects. Such a thing is needed in each data center, I think. In general, if you have questions, ask at AVrublevsky@croc.ru or in the comments. Prices for your infrastructure can also be called in the mail.
What caused the surge in traffic? What happened in the communication channel?
The action takes place in a large data center, for example, a bank. And in the channel there can be anything from test services, or one of a dozen business services, and also - with equal success - a backup of the database.
')
If the admin is not completely Krivorukov, and the situation is not very tricky, then in 10 minutes it will be possible to identify specific causes that create problems, and another 15-20 minutes to analyze the problem. If the situation is more complicated (we will consider another example below), then you can look for anomalies in the behavior of traffic for days. With the toolkit for detecting such anomalies, it will take 1 minute to find the problem in this example.
Here is a simple example. There was a surge in traffic in the communication channel, because of which there were brakes for applications from users.
We want to understand: the traffic of which applications / services is transmitted in the communication channel and what caused the surge?
Yeah, I see ... CIFS - 92% of the total traffic.
We find out who worked there (which hosts and users).
The first pair of client - server loaded communication channel at 99% via CIFS.
If we have diagnostic system integration with Active Directory, we can find out who it is. We try.
We have a certain John Smith. The problem has a surname. And all this in 1 minute.
I want to add that all transitions between the reports created in the example are performed by clicking the right mouse button and selecting a report from the context menu that appears.
Now let's see an example more difficult when the whole ERP-system slows down.
So, there is such a picture:
ERP slows down, users complain. Why? Where to look? Where to see?
Of course, you can search for reasons manually. This is interesting, but if there are several dozen problems, it is tiring and long. Plus, you need to use a lot of your own or third-party modules to analyze traffic, its collection and evaluation. Fortunately, we have a tool that allows you to get all the data at once and in one place. This is Riverbed Cascade.
Common task
Suppose this is not just one problem, but a whole bunch of different tasks analyzing the degradation of business services. In a normal network with "intelligence" we need to understand:
- How long does the server respond to user requests?
- How fast are the packets going through the network?
- What data go where?
- What is the nature of traffic exchange (for example, many small frequent requests or large ones, up-down loading profile, potential deduplication or placement in fast cache)?
- What and where are network and server latencies created?
- How is this traffic tagged (correct?)
- How do the servers interact with each other?
- How are application modules connected?
Use Riverbed Cascade
The complete solution consists of three and a half parts:
- Profiler responsible for data analysis. An add-on for the Pilot Console workstation is an assistant profiler for fast processing and analyzing a copy of packets (TCP Dump) recorded on sensors. In simple terms, Pilot is a graphical interface to all known Wireshark.
- Gateway - collecting data from primary sources such as switches, routers, and so on. Gateway accepts all types of flow, data is deduplicated and sent to Profiler for analysis.
- Sensors that monitor the mirrored data, measuring delays. Sensors also store the collected packages in their historical analysis of the problems encountered. Statistics are sent to Profiler for analysis.
Example for a specific data center: all three modules are installed. Shark Sensor receives mirrored data from the server farm switch, Virtual Shark analyzes the interactions between virtual machines — Gateway receives flow from routers and optimizers. Then all the statistics goes to the profiler. Pilot works with a copy of the traffic stored on the Shark Sensor
Pensive server
We return to the ERP problem.
We begin to understand what happened on the segment between end users and Web servers, why the system signaled this.
Go to the semaphore system on the desktop. It is seen that the problem is for all remote branches of the company. We look incidents on this problem. We proceed to a detailed analysis - it is clear that we have increased the response time from the server. The graphs and tables below are created in a single report.
The green bar at the bottom of the chart is the normal profile of the server. This should be a stable server.
On the graph, the actual response time of the server is shown in blue. Scroll the report below.
We look at the interaction of clients and servers. It is seen that all customers have problems to one degree or another. At the same time, only one server has a problem from the server cluster.
Consider the statistics of the problem server.
We see the MAC address of the server, the IP address of the switch and the port of the switch where the server is connected. Consider the transactions of the problem server in the GUI to Wireshark - Pilot Console.
On the server response time report by objects, it can be seen that the time to provide only one object is increased.
Here he is: complex.psp
We are checking. Build a transaction interaction diagram. Checking:
Yes that's it.
If anyone does not believe, let him check - go to manual batch analysis in Wireshark of the same transaction.
So, we have just received a comprehensive picture of the interaction of users with the Web servers of the ERP service, which made it possible to find a failed Web server, or even more precisely, a failed object on the server.
Localization of problems with multi-tier applications
We see a picture of a multi-level application showing all components, including traffic load balancers. The system visually immediately makes it clear which segment needs to analyze the degradation of the service as a whole: the end-user segment is marked in red when accessing the VIP address of the traffic balancer. Then you can proceed to a detailed analysis of traffic on this segment and analyze the performance of the traffic balancer. There is no need to analyze each segment of a multi-level application manually and understand how the components of this application interact with each other: when you first look at the map of the interaction of the application components, everything becomes clear visually.
Compatibility with traffic optimizers
In a previous post, I already wrote about traffic optimizer devices that can perfectly compress data channels and are often used by banks, telecom operators and other large companies, as well as medium-sized and large businesses seeking to make better use of a communication channel and speed up application performance. So, since optimizers are a product of the same manufacturer, network statistics from them can be collected using the Riverbed Cascade monitoring system. Two solutions are excellent (and cheap, which is important) are combined, which comprehensively solves the problems of the productivity of applications of companies.
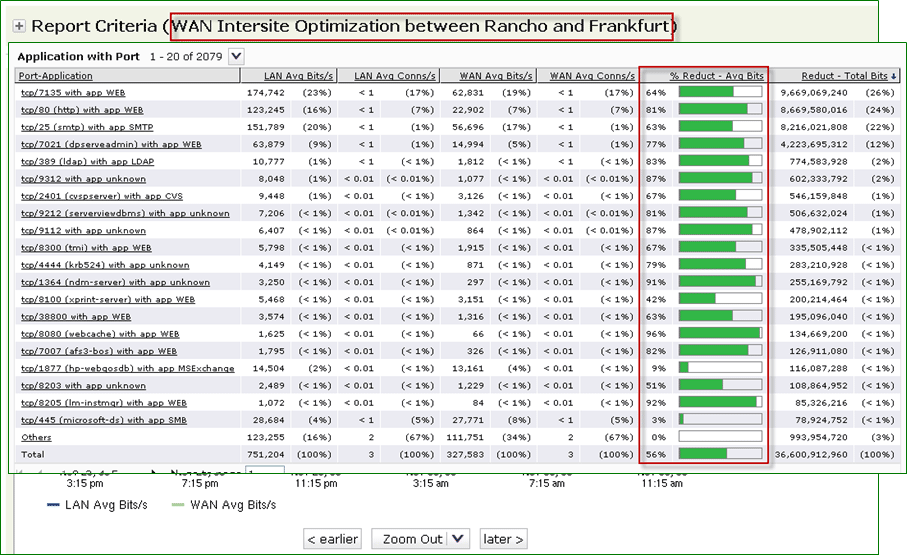
These indicators of traffic optimization are collected just Riverbed Cascade:
Ratio of LAN traffic (blue graph) and WAN traffic (green graph) with optimization. It is clearly seen how the volume of traffic in the communication channel has decreased.
Traffic Optimization by Application and Percentage of Reduced Bandwidth Usage of Each
Reports
The solution is used, of course, not only to localize problems and anomalies in the behavior of application traffic. It is very convenient to build reports, for example, for planning infrastructure development. For example, a report on traffic volumes and its types by branches allows you to find a city that leads on Citrix traffic, and evaluate the benefits of optimizing this direction.
You can look for problems both in historical section and in real time by the fact of their occurrence (and here you will be damn glad that there is such a powerful assistant).
Expert Systems
Riverbed's solution has another great function — behavioral analytics. As you know, one of the most important tasks is timely informing interested parties about the degradation of business services. Typically, systems only allow fixed thresholds for application performance metrics. They must come up with the administrator himself.
Here Riverbed Cascade bypasses all competitors: it removes dozens of metrics and builds profiles of the normal behavior of each metric. Threshold values should not be set, the system will collect historical statistics, and on its basis threshold values will be generated. And in case of deviation from the norm, the system will inform the administrator or his manager.
In addition to analytics of application performance, the system includes security analytics functionality. Namely: the system will warn the administrator in the event that:
- The user is scanning the network.
- User scans open ports.
- A new host appears on the network.
- The host is using a new port.
And even if the installed anti-virus systems do not see the spread of a new virus on the network, Riverbed Cascade will detect the spread of a “worm” in the anomalous traffic that has appeared.
Questions
We implemented this solution (complete with traffic optimization) for a gold mining company, for a geographically distributed bank, a logistics company, we completed a project for an energy company and dozens of smaller projects. Such a thing is needed in each data center, I think. In general, if you have questions, ask at AVrublevsky@croc.ru or in the comments. Prices for your infrastructure can also be called in the mail.
Source: https://habr.com/ru/post/215585/
All Articles