5 ways to compare two byte arrays. Comparative Testing
 As a result of profiling my software, I concluded that it is necessary to optimize the buffer comparison function.
Since The CLR does not provide a standard way to compare two pieces of memory, then the function was quickly written on its own (if only it worked).
Googling the phrase “Best Way to Compare Byte Arrays in .Net”, I was confused: in most cases people suggested using either LINQ or Enumerable.SequenceEqual (), which is practically the same thing. Even on StackOverflow, this was the most popular answer. Those. catastrophic popular delusion of the form:
“Compiler \ run-time environment will not be worrying about performance.” From here.
It was the first time that led me to write this post.
I conducted a comparative test of five ways to compare buffers available from C #, and based on the test results, I gave recommendations on how to choose one.
In addition, I decompiled some functions, and analyzed the code generated by the JIT compiler for the x86 configuration, and also compared the machine code generated by the JIT compiler with the machine code of the CRT function of a similar purpose.
')
Prehistory
Having written another utility and having achieved its efficiency, I launched the profiler and saw that a huge percentage of the time it takes to compare byte arrays.
The CompareByteArrays () function was on a critical path, and we had to do something about it.
I did not see the algorithmic solution to the performance problem: the algorithms were chosen in advance, and I didn’t have any ideas on how to reduce the final complexity.
The search results on the World Wide Web were not very pleased: there were no comparisons of the speed of the methods, but how these figures were obtained, what data and under what conditions no one bothered to write.
I had my own assumptions about who and under what conditions would be faster. I decided to check.
The results were interesting, so the thought of posting here has finally matured.
What and what I tested
the main thing
The code was compiled and run on a Windows 7 x64 machine with all the latest updates for .Net 4.0 Client Profile, i.e. with Microsoft Visual Studion 2010 default settings, and only for x86 configuration, i.e. This is a 32-bit code. Firstly, because most of the code I come across is written for 32-bit systems. Secondly, I believe that for .Net, performance in this configuration is extremely important. In particular, because a huge amount of existing components is written for 32-bit, and no one will rewrite them, and you need to interact with them, i.e. they will determine the configuration of the final application. Secondly, an extremely small number of applications really need 64 bits - the required bit depth is determined primarily by memory requirements and the target platform. Modern 64-bit x86-compatible processors hardware support 32-bit tasks [1] [2]. It is logical that Windows x64 uses this feature by executing 32-bit code directly [3]. Compiling a 32-bit application into 64 bits multiplies the memory necessary for it and decreases its performance, because the compiler options do not change the processor’s TLB size, the first level cache does the same, and the pointer size doubles, which in turn also aligns the data modifies [4].
Data size
In my original task, it was necessary to compare byte arrays with a size of 16 bytes and sizes from 1 to 4 * 1024 bytes. 16 bytes - the size of the MD5, 4 Kb - the size of the standard memory page in Windows, so it was chosen for the I / O buffer.
However, I tested the comparison on blocks from 1 byte to 1/2 megabyte, for the simple reason that hashes are not only 16 bytes in size, but also 4, and even 2 bytes (CRC16, CRC32), and memory pages are not only 4 kilobytes, but also 2 MB [2] and even 4 MB. The results shown on the 1/2 MB blocks turned out to be sufficient to draw a conclusion about working with large blocks, besides my time is not infinite (in the process of testing the computer is better not to touch, so as not to take time from the described process).
Based on the results of the first runs, I found it sufficient to compare methods on 25 different sizes of test data. To do this, I built a testing cycle so that the first test set consisted of 1-byte arrays, and at each next step the size of the test arrays multiplied by the same factor.
Parameters were set by constants in the code:
private const int CountArrays = 128; // private const int StartArraySize = 1; // private const int MaxArraySize = 512 * 1024; // private const int StepsCount = 25; // private const int MeasurementsCount = 10; // The main testing cycle looked like this:
double sizeMultiplier = 1; DoInvestigationStep(sizeMultiplier); const int MaxMultiplier = MaxArraySize / StartArraySize; var stepMmltiplier = Math.Pow( MaxMultiplier, 1 / (double)StepsCount ); for (var step = 1; step <= StepsCount; step++) { sizeMultiplier = Math.Pow(stepMmltiplier, (double) step); DoInvestigationStep(sizeMultiplier); } The size of the array at each step was calculated like this:
var arraySize = (int) (StartArraySize * p_SizeMultiplier); Tested methods
Using the System.Collections.IStructuralEquatable Interface
This is a relatively new way for C #, it appeared only in .NET 4, so it was of particular interest to me: I was curious how slow it was.
private static bool ByteArrayCompareWithIStructuralEquatable(byte[] p_BytesLeft, byte[] p_BytesRight) { IStructuralEquatable eqa1 = p_BytesLeft; return eqa1.Equals(p_BytesRight, StructuralComparisons.StructuralEqualityComparer); } LINQ, more specifically, Enumerable. SequenceEqual ()
This is one of the simplest methods, the easiest to implement. In addition, it is the most popular method.
private static bool ByteArrayCompareWithSequenceEqual(byte[] p_BytesLeft, byte[] p_BytesRight) { return p_BytesLeft.SequenceEqual(p_BytesRight); } PInvoke, for CRT memcmp () function
Theoretically, this should be the fastest way, but it turned out that this is not always the case: the overhead of interacting with the platform eats quite a long time, and this method in some cases loses its appeal.
Here I bring it in the form as I found it on SO. It was in this form that I tested it.
On PInvoke.net, it looks a little different.
[DllImport("msvcrt.dll", CallingConvention = CallingConvention.Cdecl)] private static extern int memcmp(byte[] p_BytesLeft, byte[] p_BytesRight, long p_Count); private static bool ByteArrayCompareWithPInvoke(byte[] p_BytesLeft, byte[] p_BytesRight) { // Validate buffers are the same length. // This also ensures that the count does not exceed the length of either buffer. return p_BytesLeft.Length == p_BytesRight.Length && memcmp(p_BytesLeft, p_BytesRight, p_BytesLeft.Length) == 0; } Head-on. Those. direct comparison of bytes in the for (;;) loop
This is the most obvious way to compare two arrays, which is why it is of interest.
Initially, the method did not seem too fast, but it turned out that for many situations it is quite acceptable.
By the way, one of the variations of this method of comparison was used in the article from the CLR Manufacturers themselves, moreover in the text in which I needed it.
Apparently, their users dokanali such issues.
private static bool ByteArrayCompareWithSimplest(byte[] p_BytesLeft, byte[] p_BytesRight) { if (p_BytesLeft.Length != p_BytesRight.Length) return false; var length = p_BytesLeft.Length; for (int i = 0; i < length; i++) { if (p_BytesLeft[i] != p_BytesRight[i]) return false; } return true; } Optimized unsafe-method from Khafor Stefanson
The author of the method claims that this optimized method makes the comparison by blocks of 64 bits for the largest possible part of the array, assuming that the beginning of the array is aligned with the QWORD boundary. It will also work if there is no QWORD alignment, but at a lower speed.
However, in a 32-bit comparison environment, blocks of 64 bits can be achieved only with the help of an assembler: 32-bit general-purpose registers, and the compiler uses them when generating machine code.
So, how this method works efficiently depends on how it is compiled. In my case - not exactly 64 bits.
// Copyright (c) 2008-2013 Hafthor Stefansson // Distributed under the MIT/X11 software license // Ref: http://www.opensource.org/licenses/mit-license.php. private static unsafe bool UnsafeCompare(byte[] a1, byte[] a2) { if (a1 == null || a2 == null || a1.Length != a2.Length) return false; fixed (byte* p1 = a1, p2 = a2) { byte* x1 = p1, x2 = p2; int l = a1.Length; for (int i = 0; i < l / 8; i++, x1 += 8, x2 += 8) if (*((long*) x1) != *((long*) x2)) return false; if ((l & 4) != 0) { if (*((int*) x1) != *((int*) x2)) return false; x1 += 4; x2 += 4; } if ((l & 2) != 0) { if (*((short*) x1) != *((short*) x2)) return false; x1 += 2; x2 += 2; } if ((l & 1) != 0) if (*((byte*) x1) != *((byte*) x2)) return false; return true; } } Testing method
Test set
In order to bring the testing conditions as close as possible to the combat ones and to exclude the “jam” of the test data in the processor cache (as much as possible with memory), it was decided to generate a lot of test arrays and compare them with each other, i.e. each array with each.
A “jagged” array was selected as the test set (in the original documentation - “Jagged Array”). There were several alternatives, for example,
List<byte[]> and LinkedList<byte[]> , but the alternatives did not suit the access time to the element, although the array in .NET does not shine here: the CLR in any case checks the index for the output beyond the array boundaries , even if it is an array with zero base.The test data was generated in such a way that all the arrays were different, and the different element of the array was exactly in the middle.
Test data generation
private static void PrepareTestData(int p_ArraySize) { for (int i = 0; i < CountArrays; i++) { var byteArray = new byte[p_ArraySize]; byteArray[p_ArraySize / 2] = (byte) (i & 0x000000ff); s_arrays[i] = byteArray; } } Making comparisons
Since all arrays were supposed to be compared with all, the general view of the method, the execution time of which was measured, is two nested loops over all the arrays of the set, and the test method is called inside them. The essence of what is happening can be expressed by the code:
for (int i = 0; i < CountArrays; i++) for (int j = 0; j < CountArrays; j++) Compare( s_arrays[i], s_arrays[j] ); However, there is one “but”: if you do not use the result of “calculations” in any way, then the CLR has the full right to not “calculate” itself. I came across this before when I experimented with C ++. With the included optimization “-O3” it was very difficult to measure anything, because time after time it turned out to be zero. Therefore, it was decided to exclude such a scenario from the very beginning, so that the result of the comparison function “accumulated” and returned, and was analyzed at the topmost level.
Comparison without ignoring the result
var result = true; for (int i = 0; i < CountArrays; i++) for (int j = 0; j < CountArrays; j++) { var tmp = Compare( s_arrays[i], s_arrays[j] ); result = result && tmp; } return result; Analysis of the comparison result
var stubLocalVar = p_omparisonMethod(); if (stubLocalVar) throw new InvalidOperationException(); Since the comparison methods are 5, and the template described above is common, it seems logical to define a common, “template” method and pass the comparison method to it. In this way:
Wrong function call method
private static bool CompareArraysWithExternalMethod(Func<byte[], byte[], bool> p_Method) { var result = true; for (int i = 0; i < CountArrays; i++) for (int j = 0; j < CountArrays; j++) { var tmp = p_Method( s_arrays[i], s_arrays[j] ); result = result && tmp; } return result; } This method, of course, eliminates copying / pasting and reduces the likelihood of error, but at the same time creates unnecessary call indirectness and eliminates inlining, which, in turn, leads to loss of measurement accuracy, especially considering that there are many calls. That is why I had to create five practically identical methods:
private static bool CompareArraysWithUnsafeMethod(); private static bool CompareArraysWithSimplestMethod(); private static bool CompareArraysWithSequenceEqualMethod(); private static bool CompareArraysWithPInvokeMethod(); private static bool CompareArraysWithIStructuralEquatableMethod(); However, a higher level, I could already apply the template method.
From the code below, it can be seen that the MeasureComparisonTime () function, in which the execution time of the comparison method is measured, takes as a parameter a delegate of type Func. Its execution time is measured.
Measurement Functions
private static long GetMinimalMesuredValue(int p_MeasurementNumber, long p_PreviousValue, long p_MeasuredValue) { var result = p_MeasurementNumber == 0 ? p_MeasuredValue : Math.Min(p_PreviousValue, p_MeasuredValue); return result; } private static long MeasureComparisonTime(Func<bool> p_Method, long p_PreviousTime, int p_MeasurementNumber) { GC.Collect(); GC.Collect(); s_stopwatch.Start(); var stubLocalVar = p_Method(); s_stopwatch.Stop(); if (stubLocalVar) throw new InvalidOperationException(); var result = GetMinimalMesuredValue(p_MeasurementNumber, p_PreviousTime, s_stopwatch.ElapsedTicks); s_stopwatch.Reset(); return result; } Measurement Technique
The time was measured using a standard stopwatch ( System.Diagnostics.Stopwatch class ), which is based on QueryPerformanceCounter () . Naturally, they were interested not in milliseconds, but in ticks: in the case of tiny arrays, all measurements in milliseconds would be zero. There was also an idea to use my “bicycle” based on RDTSC [6], but, first, the first few runs showed that the current methodology is quite accurate, and second, a warning about the need to use ProcessThread.ProcessorAffinity , which appeared in recent documentation, suggests that the basis of the work of this class is the above-mentioned CPU clock counter. All measurements were repeated 10 times, and the best time was taken. The number 10 was chosen experimentally, as giving fairly accurate results with minimal time.
All-measurement function
private static MeasurementsResults DoMeasurements() { MeasurementsResults result; result.SimplestTime = 0; result.SequenceEqualTime = 0; result.PInvokeTime = 0; result.IStructuralEquatableTime = 0; result.UnsafeTime = 0; for (int measurementNumber = 0; measurementNumber < MeasurementsCount; measurementNumber++) { Console.WriteLine(" {0}", measurementNumber); result.SimplestTime = MeasureComparisonTime(CompareArraysWithSimplestMethod, result.SimplestTime, measurementNumber); result.SequenceEqualTime = MeasureComparisonTime(CompareArraysWithSequenceEqualMethod, result.SequenceEqualTime, measurementNumber); result.PInvokeTime = MeasureComparisonTime(CompareArraysWithPInvokeMethod, result.PInvokeTime, measurementNumber); result.IStructuralEquatableTime = MeasureComparisonTime(CompareArraysWithIStructuralEquatableMethod, result.IStructuralEquatableTime, measurementNumber); result.UnsafeTime = MeasureComparisonTime(CompareArraysWithUnsafeMethod, result.UnsafeTime, measurementNumber); } return result; } Measurement results and first conclusions
Before the start of the experiment, I had some idea what method would be the winner, and which the outsider, but the results still surprised me. My predictions were not entirely correct.
| Best time (tiki) | Array size (bytes) | unsafe | Head-on | PInvoke | SequenceEqual | Istructuralequatable |
|---|---|---|---|---|---|---|
| 276 | one | 1.7 | one | 6 | 10.5 | 55 |
| 276 | one | 1.7 | one | 6.3 | 10.1 | 55.7 |
| 325 | 2 | 1,3 | one | 5.3 | eleven | 95.2 |
| 374 | four | 1.1 | one | 4.8 | 11.4 | 121.3 |
| 413 | eight | one | 1,3 | five | 14.1 | 181.2 |
| 412 | 13 | one | 1.7 | 4.7 | 17.5 | 252.5 |
| 490 | 23 | one | 2.3 | 3.7 | 22.1 | 364.8 |
| 554 | 39 | one | 3.4 | 3.5 | 30.1 | 535.9 |
| 691 | 67 | one | 4.3 | 2.9 | 39.1 | 727.5 |
| 887 | 114 | one | 5.6 | 2.4 | 50.3 | 964.1 |
| 1212 | 194 | one | 4.6 | 2.1 | 61.5 | 1190.9 |
| 1875 | 328 | one | 4.8 | 1.8 | 65,8 | 1295.8 |
| 2897 | 556 | one | five | 1.6 | 71.5 | 1416.9 |
| 4565 | 942 | one | 5.3 | 1.4 | 76.3 | 1521.1 |
| 7711 | 1595 | one | 5.2 | 1,3 | 76.2 | 1521.2 |
| 12482 | 2702 | one | 5.4 | 1,3 | 79.4 | 1593,6 |
| 20692 | 4576 | one | 5.5 | 1.2 | 81.2 | 1626.2 |
| 34369 | 7750 | one | 5.6 | 1.2 | 82,8 | 1657.1 |
| 58048 | 13124 | one | 5.6 | 1.2 | 82.9 | 1661.9 |
| 97511 | 22226 | one | 5.6 | 1.2 | 83.6 | 1677.3 |
| 173805 | 37640 | one | 5.4 | 1.1 | 79.5 | 1585.7 |
| 295989 | 63743 | one | 5.3 | 1.1 | 79.3 | 1574.9 |
| 588797 | 107949 | one | 4.6 | 1.1 | 67.5 | 1340.9 |
| 1010768 | 182811 | one | 4.6 | 1.1 | 67 | 1340.4 |
| 1705668 | 309590 | one | 4.6 | 1.1 | 67.3 | 1334.1 |
| 2885452 | 524287 | one | 4.6 | 1.1 | 67.3 | 1329.1 |
The results surprised by the following:
First: the CRT function simply has to be well optimized, and I expected that at a certain stage (the size of the test array) its speed would override the overhead of the platform call, but this did not happen. Later I repeated the tests with much larger arrays, but even on 1.5 megabytes the unsafe code was faster.
Second: I guessed that IStructuralEquatable would be slow, but the numbers just struck me: I definitely did not expect this.
Diazassemblirovanie and analysis of individual functions
Such a serious difference between unsafe and Simplest on large arrays (I expected no more than two or three times overweight) suggests that with optimization of cycles and references to array elements in .Net, not everything is as smooth as the .Net supporters say. Accordingly, I did not deny myself the pleasure to look at the results of the work of JIT'er, i.e. directly generated machine code.
Analysis of the CompareArraysWithSimplestMethod () function
For this, Thread.Sleep (60 * 1000) was inserted at the beginning of the method; after launching the release build, I hooked up to the OllyDebug process. Such a cunning move was needed in order not to ruin the optimization of the CLR by any means - to see the picture as it is.
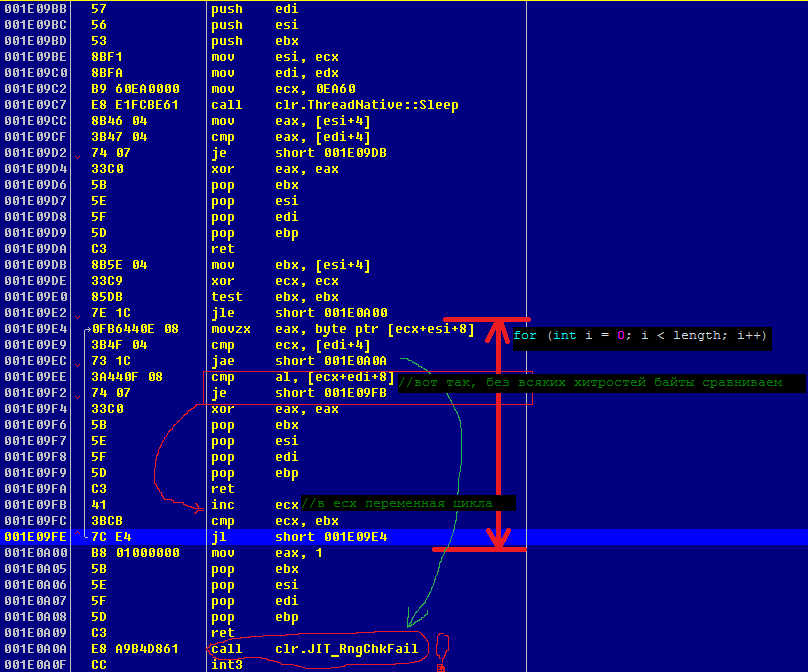
Going down the call stack from ntdll.NtDelayExecution () and SleepEx (), I found my function and, after studying it carefully, was once again unpleasantly surprised. What I really did not like here:
- Instead of a single RngChkFail check (for the entire cycle at once), the CLR does this check for each index !!!
- The cycle remained in the form in which I wrote it: the compiler did not “unroll” it.
- Therefore, the comparison remained single byte, although the CLR was quite capable of optimizing it, for example, by making a comparison of 4 bytes each (register size).
- Instead of a single return with a single epilogue and clearing the stack, the CLR copied them three times, making the code “swelled”. In fact, the machine code repeats the C # code almost one to one. In this regard, the question arises: did he even optimize the code? Can he do this?
- Probably due to the previous item (swollen code), the function was not inline.
UnsafeCompare () function analysis
The result of the decompilation of this function kindled my curiosity and suggested an idea about the other functions. I decided to compare the CRT function and the unsafe option. At first I decided to look at the unsafe option. To do this, I did the same operations as for the first function, except that Thread.Sleep () inserted not into the function itself, but before calling it. This could hardly affect the essence of what is happening, but somewhat simplified decompilation: the unsafe-function is clearly more complicated than the first.
Place insert Thread.Sleep ()
private static bool CompareArraysWithUnsafeMethod() { var result = true; for (int i = 0; i < CountArrays; i++) for (int j = 0; j < CountArrays; j++) { Thread.Sleep( 60 * 1000 ); var tmp = UnsafeCompare(s_arrays[i], s_arrays[j]); Of interest is also the first half of this function, i. until the call to UnsafeCompare (). It, as well as the first one, demonstrates that any reference to an element of an array causes an index check to occur in the array boundaries. I highlighted this in the listing.
CPU Disasm CompareArraysWithUnsafeMethod
;Address Hex dump Command Comments 001B0B88 55 push ebp ; 001B0B89 8BEC mov ebp, esp 001B0B8B 57 push edi 001B0B8C 56 push esi 001B0B8D 53 push ebx 001B0B8E BF 01000000 mov edi, 1 ; result = true; 001B0B93 33DB xor ebx, ebx ; for (int i = 0; 001B0B95 33F6 xor esi, esi ; for (int j = 0; 001B0B97 B9 60EA0000 mov ecx, 0EA60 ; Thread.Sleep( 60 * 1000 ); 001B0B9C E8 0CFBC161 call clr.ThreadNative::Sleep 001B0BA1 8B15 A8337A03 mov edx, [s_arrays] ; EDX <-- s_arrays 001B0BA7 3B5A 04 cmp ebx, [edx+4] ; Compare(s_arrays.Length, ) (1) !!! 001B0BAA 73 31 jae short stub_CLR.JIT_RngChkFail 001B0BAC 8B4C9A 0C mov ecx, [ebx*4+edx+0C] ; ECX <-- s_arrays[i] 001B0BB0 3B72 04 cmp esi, [edx+4] ; Compare(s_arrays.Length, ) (2) !!! 001B0BB3 73 28 jae short stub_CLR.JIT_RngChkFail 001B0BB5 8B54B2 0C mov edx, [esi*4+edx+0C] ; EDX <-- s_arrays[j] 001B0BB9 FF15 F0381400 call near UnsafeCompare The result of the function decompilation turned out to be quite large and did not fit on one screen, so I did not give a screenshot of the debager window. Since it is tedious and unproductive to read a large, solid listing, here I bring it in logically unified chunks, accompanying each piece with a brief comment.
UnsafeCompare (). ParametersChecking
;a1 ========> ECX ;a2 ========> EDX ;Address Hex dump Command Comments 001B0BF8 55 push ebp ; 001B0BF9 8BEC mov ebp, esp 001B0BFB 57 push edi ; , , , 001B0BFC 56 push esi ; 001B0BFD 53 push ebx ; 001B0BFE 83EC 0C sub esp, 0C ; 3*sizeof(DWORD), .. 3 001B0C01 33C0 xor eax, eax ; (!) 001B0C03 8945 F0 mov [ebp-10], eax ; var1 <-- 0 (!) 001B0C06 8945 EC mov [ebp-14], eax ; var2 <-- 0 (!) 001B0C09 85C9 test ecx, ecx ; Compare(a1, null) 001B0C0B 74 0C je short return1 001B0C0D 85D2 test edx, edx ; Compare(a2, null) 001B0C0F 74 08 je short return1 001B0C11 8B41 04 mov eax, [ecx+4] ; eax <-- a1.Length 001B0C14 3B42 04 cmp eax, [edx+4] ; Compare(eax, a2.Length) 001B0C17 74 0A je short argsIsValid return1: 001B0C19 33C0 xor eax, eax ; result <-- 0 001B0C1B 8D65 F4 lea esp, [ebp-0C] 001B0C1E 5B pop ebx 001B0C1F 5E pop esi 001B0C20 5F pop edi 001B0C21 5D pop ebp 001B0C22 C3 ret argsIsValid: ; In accordance with the fastcall calling convention, which follows the .NET Framework [7] [8], the first and second parameters are in the ecx and edx registers, in order from left to right. In the above listing, the sequential check of input parameters is clearly visible, it almost uniquely corresponds to the code in C #
if (a1 == null || a2 == null || a1.Length != a2.Length) return false; However, the highlighted lines deserve special attention: their purpose is unclear and they confuse. To understand what it is and why it might be needed, I had to run another experiment, during which I wrote the simplest unsafe function in C #, which uses the fixed clause and the pointer call, and carried out similar actions with it.
private static unsafe int func1(byte[] param1) { fixed (byte* p = param1) { return *p; } } Dizasm simplest unsafe function
;param1 ========> ECX Address Hex dump Command Comments $ ==> 55 push ebp ; $+1 8BEC mov ebp, esp $+3 50 push eax ; (!) $+4 33C0 xor eax, eax ; (!) $+6 8945 FC mov [ebp-4], eax ; var1 <-- 0 (!) $+9 85C9 test ecx, ecx ; Compare(param1, null) $+B 74 06 je short param_is_null $+D 8379 04 00 cmp dword ptr [ecx+4], 0 ; Compare(param1.Length, 0) $+11 75 07 jne short not_zero_len param_is_null: $+13 33D2 xor edx, edx $+15 8955 FC mov [ebp-4], edx ; var1 <-- 0 $+18 EB 0C jmp short ret_1 not_zero_len: $+1A 8379 04 00 cmp dword ptr [ecx+4], 0 $+1E 76 10 jbe short call.JIT_RngChkFail $+20 8D49 08 lea ecx, [ecx+8] ; ecx <-- param1.BufferPointer $+23 894D FC mov [ebp-4], ecx ; var1 <-- ecx ret_1: $+26 8B45 FC mov eax, [ebp-4] ; eax <-- var1 $+29 0FB600 movzx eax, byte ptr [eax] ; eax <-- *eax $+2C 8BE5 mov esp, ebp ; $+2E 5D pop ebp $+2F C3 ret call.JIT_RngChkFail: $+30 E8 B3BDC861 call clr.JIT_RngChkFail $+35 CC int3 From the above listing, it becomes clear that as a result of JIT compilation, the variable in the fixed statement must be pushed onto the stack, regardless of the availability of general-purpose registers. This is well seen from the fact that the eax register was saved on the stack, was not used in the future and, therefore, was free and available for operations (up to offset 0x26 from the beginning of the function), but the stack variable by offset was used for storing temporary data [ ebp-4] (let's call it var1). The variable is immediately initialized by zero, despite the fact that later this value is not used, but simply erased. For example, at offset 0x15, zero is entered again in var1, despite the fact that zero is already stored there by this time.
Thus, it becomes clear that the selected lines in the listing UnsafeCompare.CPU Disasm.ParametersChecking do not carry any special meaning; this is just a side effect of the compilation. It also becomes apparent from the above listing that the array is checked in the fixed expression in three stages: first, the array is checked for null equality, then its length is checked for equality to zero (the jne command analyzes only ZF), and only then for equality to zero and the negative value ( jbe checks both ZF and CF). From my point of view, it is very strange that the last two actions were not merged into one, and all the more strange that the cmp command is executed twice, because the conditional transition does not reset the flags. Among other things, I am sincerely grateful to those of you who read this line, because it means that I did not try in vain, and my excavation in assembly listings was not in vain.
The experiment greatly simplifies further code analysis.
The fixed sentence from the CompareArraysWithUnsafeMethod () function
argsIsValid: 001B0C23 8379 04 00 cmp dword ptr [ecx+4], 0 ; Compare(a1.Length, 0) 001B0C27 75 07 jne short a1Len_NonZero ; 001B0C29 33C0 xor eax, eax 001B0C2B 8945 F0 mov [ebp-10], eax ; var1 <-- 0 001B0C2E EB 10 jmp short a1Len_Zero a1Len_NonZero: 001B0C30 8379 04 00 cmp dword ptr [ecx+4], 0 ; Compare(a1.Length, 0) () 001B0C34 0F86 B5000000 jbe call.JIT_RngChkFail ; 001B0C3A 8D41 08 lea eax, [ecx+8] ; eax <-- a1.BufferPointer 001B0C3D 8945 F0 mov [ebp-10], eax ; var1 <-- eax a1Len_Zero: 001B0C40 837A 04 00 cmp dword ptr [edx+4], 0 ; Compare(a2.Length, 0) 001B0C44 75 07 jne short a2Len_NonZero ; 001B0C46 33D2 xor edx, edx 001B0C48 8955 EC mov [ebp-14], edx ; var2 <-- 0 001B0C4B EB 10 jmp short part3 a2Len_NonZero: 001B0C4D 837A 04 00 cmp dword ptr [edx+4], 0 ; Compare(a2.Length, 0) () 001B0C51 0F86 98000000 jbe call.JIT_RngChkFail ; 001B0C57 8D52 08 lea edx, [edx+8] ; edx <-- a2.BufferPointer 001B0C5A 8955 EC mov [ebp-14], edx ; var2 <-- edx The compiler did not present any surprises here, i.e. compilation algorithm gives easily predictable results. For example, variables initialized in the fixed clause are in any case placed on the stack.
Initializing variables inside a fixed block:
part3: ; ECX <======= a1 ; EDX <======= a2.BufferPointer ; var1 <======= a1.BufferPointer ; var2 <======= a2.BufferPointer 001B0C5D 8B45 F0 mov eax, [ebp-10] ; eax <-- var1 001B0C60 8BF0 mov esi, eax ; esi <-- eax 001B0C62 8B45 EC mov eax, [ebp-14] ; eax <-- var2 001B0C65 8BF8 mov edi, eax ; edi <-- eax 001B0C67 8B41 04 mov eax, [ecx+4] ; eax <-- a1.Length 001B0C6A 8945 E8 mov [ebp-18], eax ; var3 <-- eax Initialization of variables inside the fixed block is curious because it well demonstrates the principle by which the JIT compiler generates code. It is clearly seen here that instead of direct transfer of values from stack variables to index registers, values are first placed in a battery register. Maybe this is some secret magical meaning, but it looks like (sending to eax) just as an extra action.
8 byte loop
001B0C6D 33C9 xor ecx, ecx ; <-- 0 001B0C6F 8BD8 mov ebx, eax ; ebx <-- a1.Length 001B0C71 85DB test ebx, ebx 001B0C73 79 03 jns short ebx_greaterZero 001B0C75 83C3 07 add ebx, 7 ; , 7 ebx_greaterZero: 001B0C78 C1FB 03 sar ebx, 3 ; ebx <-- a1.Length / 8 001B0C7B 85DB test ebx, ebx 001B0C7D 7E 1D jle short fourBytesComparing for8_body: 001B0C7F 8B06 mov eax, [esi] 001B0C81 8B56 04 mov edx, [esi+4] 001B0C84 3B57 04 cmp edx, [edi+4] 001B0C87 75 04 jne short setResult_jumpReturn 001B0C89 3B07 cmp eax, [edi] 001B0C8B 74 04 je short for8_increment setResult_jumpReturn: 001B0C8D 33C0 xor eax, eax ; result <-- 0 001B0C8F EB 56 jmp short return2 ; goto return for8_increment: 001B0C91 41 inc ecx 001B0C92 83C6 08 add esi, 8 001B0C95 83C7 08 add edi, 8 for8_expression: 001B0C98 3BD9 cmp ebx, ecx 001B0C9A ^ 7F E3 jg short for8_body The loop structure is rather trivial, for example, the loop counter is traditionally located in ecx, the limit value of the counter is located in ebx, which is also traditional. What is remarkable here is that the first check of the condition of the loop is located immediately after the initialization and looks different from the main condition of the loop. It is also obvious that miracles do not happen, and the REX prefix is not available either in Protected Mode or Compatible Mode, i.e. Comparison of QWORD blocks is impossible, therefore blocks of DWORD size are compared. However, it is clear from the code that, before performing comparisons, the corresponding parts of the first array are loaded into the eax and edx registers, i.e. The JIT compiler attempted to produce machine code as closely as possible with the source code.
What is striking is that the compiler here did not use the CMPSD string instruction, namely, its “short” form, which compares DWORD blocks placed at the addresses esi and edi, setting the corresponding flags. In this case, the size of the machine code would be several times smaller: the mov command here is 2 and 3 bytes in size, the cmp command is 2 and 3 bytes, and the size of each CMPSD command (in short form) would be only 1 byte, i.e. . for two teams only 2 bytes. This suggests that the JIT compiler does not want to optimize the code.
From the listed listings it is obvious that a couple of commands, the first of which is transfer to eax, is a pattern that the compiler follows strictly.
An attempt to compare blocks with the size of DWORD, is performed, if such a volume remains:
fourBytesComparing: 001B0C9C F745 E8 0400000 test dword ptr [ebp-18], 00000004 ; ZF <-- (var3 & 4) == 0 001B0CA3 74 10 je short length_lowerThenFour 001B0CA5 8B06 mov eax, [esi] 001B0CA7 3B07 cmp eax, [edi] 001B0CA9 74 04 je short dwords_equals ; , 001B0CAB 33C0 xor eax, eax 001B0CAD EB 38 jmp short return2 dwords_equals: 001B0CAF 83C6 04 add esi, 4 001B0CB2 83C7 04 add edi, 4 An attempt to compare blocks the size of WORD, is performed, if such a volume remains:
length_lowerThenFour: 001B0CB5 F745 E8 0200000 test dword ptr [ebp-18], 00000002 ; ZF <-- (var3 & 2) == 0 001B0CBC 74 10 je short length_lowerThenTwo 001B0CBE 0FBF06 movsx eax, word ptr [esi] 001B0CC1 66:3B07 cmp ax, [edi] 001B0CC4 74 04 je short words_equals ; , 001B0CC6 33C0 xor eax, eax 001B0CC8 EB 1D jmp short return2 words_equals: 001B0CCA 46 inc esi 001B0CCB 46 inc esi 001B0CCC 47 inc edi 001B0CCD 47 inc edi An attempt to compare blocks of size BYTE, is performed if such a volume remains:
length_lowerThenTwo: 001B0CCE F745 E8 0100000 test dword ptr [ebp-18], 00000001 ; ZF <-- (var3 & 1) == 0 001B0CD5 74 0B je short 001B0CE2 001B0CD7 0FB606 movzx eax, byte ptr [esi] 001B0CDA 3A07 cmp al, [edi] 001B0CDC 74 04 je short 001B0CE2 ; , 001B0CDE 33C0 xor eax, eax 001B0CE0 EB 05 jmp short return2 001B0CE2 B8 01000000 mov eax, 1 Return result and throw exception:
return2: 001B0CE7 8D65 F4 lea esp, [ebp-0C] 001B0CEA 5B pop ebx 001B0CEB 5E pop esi 001B0CEC 5F pop edi 001B0CED 5D pop ebp 001B0CEE C3 ret JIT_RngChkFail: 001B0CEF E8 C4B1DB61 call clr.JIT_RngChkFail 001B0CF4 CC int3 CRT analysis of memcmp () function
This function is also of interest because it does not simply compare two buffers, but clarifies the relationship between them, which means that it is more complicated than those previously considered.
After hooking up the debager, I found out that C: \ Windows \ SysWOW64 \ msvcrt.dll version 7.0.7601.17744 was loaded into the memory of the process at the base address 0x76C20000.
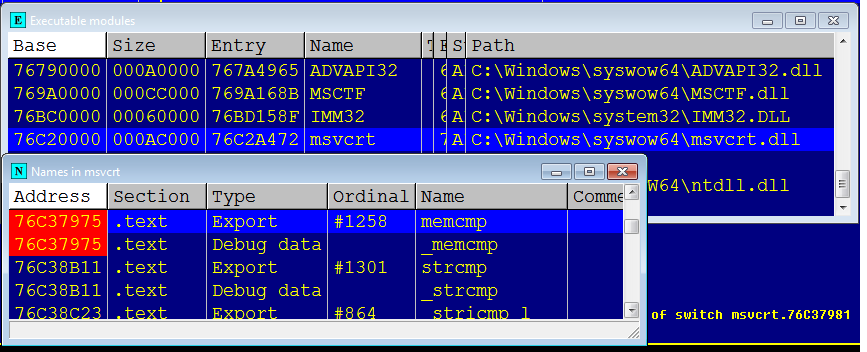
This is an important clarification, since the code of different versions of libraries can be very different, since they can be compiled with different compiler options, and even more so, different compilers.
The first glance at the dissected function confused me a little: firstly, before the standard prologue, at the very beginning of the function, there was a strange instruction, and secondly, the size of this function is amazing. The presence of “long” jumps was striking, besides, the switch with 32 cases is frightening.
Strange instruction:
76C37975 . 8BFF mov edi, edi ; <--(!) INT msvcrt.memcmp(buf1,buf2,count) 76C37977 . 55 push ebp 76C37978 . 8BEC mov ebp, esp It copies the register to itself without updating any flags, i.e. the result of its execution is zero, just like nop, but 2 bytes in size. Having run through the code in the debugger window, I found that many other functions started in the same way. Thanks to Raymond Chen's blog, an explanation was found quickly. This is really an analogue of nop.
It's a hot-patch point.
The MOV EDI, EDI instruction is a NOP, it can be updated on the fly. It will be replaced by the JMP $ -5 instruction. If you want to go through the address space.
blogs.msdn.com/b/oldnewthing/archive/2011/09/21/10214405.aspx
Long jumps and a very large switch
Address Hex dump Command Comments 75A9797C . 8B7D 10 mov edi, [ebp+10] ; edi <-- length 75A9797F . 8BC7 mov eax, edi 75A97981 . 83E8 00 sub eax, 0 ; 75A97984 . 0F84 E7070100 je msvcrt.zeroResult_GoReturn ; (length == 0)=> {result <-- 0, goto return;} (!) ; ; 75A979BC . 83FF 1F cmp edi, 1F ; Switch (cases 1..1F, 32. exits) 75A979BF . 77 5B ja short msvcrt.75A97A1C 75A979C1 . FF24BD 1F8AA975 jmp near [edi*4+msvcrt.75A98A1F] ; (!) (!) ; ; 75A98A1F . 1C7AA975 dd msvcrt.75A97A1C ; (00) , jump 75A98A23 . E88AA975 dd msvcrt.75A98AE8 ; (01) 75A98A27 . CA8AA975 dd msvcrt.75A98ACA ; (02) 75A98A2B . 8C8BA975 dd msvcrt.75A98B8C ; (03) 75A98A2F . 0A7AA975 dd msvcrt.75A97A0A ; (04) 75A98A33 . 088FA975 dd msvcrt.75A98F08 ; (05) 75A98A37 . B88AA975 dd msvcrt.75A98AB8 ; (06) 75A98A3B . 758BA975 dd msvcrt.75A98B75 ; (07) 75A98A3F . F479A975 dd msvcrt.75A979F4 ; (08) 75A98A43 . 238FA975 dd msvcrt.75A98F23 ; (09) 75A98A47 . 9F8AA975 dd msvcrt.75A98A9F ; (0A) 75A98A4B . A18BA975 dd msvcrt.75A98BA1 ; (0B) 75A98A4F . DE79A975 dd msvcrt.75A979DE ; (0C) 75A98A53 . 3A8FA975 dd msvcrt.75A98F3A ; (0D) 75A98A57 . FD8AA975 dd msvcrt.75A98AFD ; (0E) 75A98A5B . ED8EA975 dd msvcrt.75A98EED ; (0F) 75A98A5F . C879A975 dd msvcrt.75A979C8 ; (10) 75A98A63 . 518FA975 dd msvcrt.75A98F51 ; (11) 75A98A67 . BA8EA975 dd msvcrt.75A98EBA ; (12) 75A98A6B . 6A98A975 dd msvcrt.75A9986A ; (13) 75A98A6F . 8990A975 dd msvcrt.75A99089 ; (14) 75A98A73 . CD98A975 dd msvcrt.75A998CD ; (15) 75A98A77 . D58EA975 dd msvcrt.75A98ED5 ; (16) 75A98A7B . 8598A975 dd msvcrt.75A99885 ; (17) 75A98A7F . 1899A975 dd msvcrt.75A99918 ; (18) 75A98A83 . E898A975 dd msvcrt.75A998E8 ; (19) 75A98A87 . 698FA975 dd msvcrt.75A98F69 ; (1A) 75A98A8B . 9D98A975 dd msvcrt.75A9989D ; (1B) 75A98A8F . 3399A975 dd msvcrt.75A99933 ; (1C) 75A98A93 . 0099A975 dd msvcrt.75A99900 ; (1D) 75A98A97 . 848FA975 dd msvcrt.75A98F84 ; (1E) 75A98A9B . B598A975 dd msvcrt.75A998B5 ; (1F) Due to the large laboriousness of analyzing the entire function, it was decided not to disassemble it completely, besides, two things were of interest:
- (overhead) «» (PInvoke)
- .
To estimate the overhead of a function call, it was decided to trace the code from the managed code to the beginning of the function itself. To do this, a breakpoint was set at the beginning of the function, and after returning from Thread.Sleep () a trace was started. However, the result of the first tracing attempt was unsuccessful: the trace log was too large (about 100 thousand lines), which probably indicated that DllMain () was executed, there was also a possibility that some CLR code was captured, JIT compiler code. What exactly was performed there, I did not clarify: it was not of interest, because Such a start code is executed only once and almost does not affect the overall picture. To exclude this code, I inserted another memcmp () call before calling Thread.Sleep () and re-traced it.As a result, he received a little more than a hundred lines.
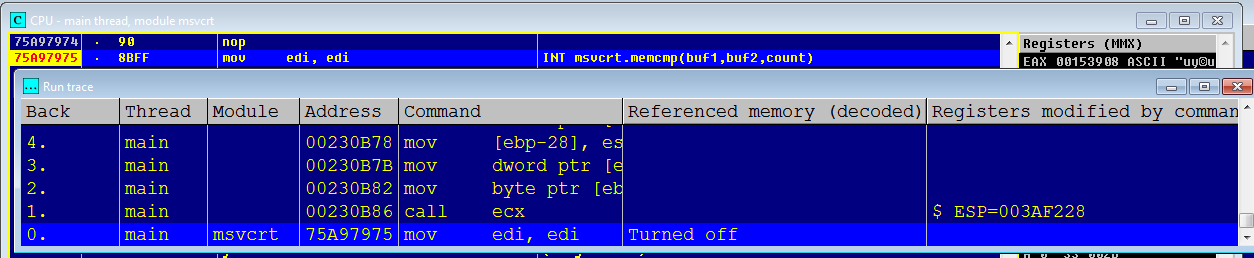
Part of the trace log:
main 00480AEA call 0031C19C ESP=0016F368 ; main clr.628C3B5F call near [eax+14] ESP=0016F248 ; (1) ; main 00480B87 mov eax, [ebp-1C] EAX=00313880 main 00480B8A mov eax, [eax+14] EAX=0031391C main 00480B8D mov ecx, [eax] ECX=75A97975 ; (2) main 00480B8F push dword ptr [ebp+0C] ESP=0016F328 main 00480B92 push dword ptr [ebp+8] ESP=0016F324 main 00480B95 push edi ESP=0016F320 main 00480B96 push dword ptr [ebp-10] ESP=0016F31C main 00480B99 mov dword ptr [ebp-2C], 0 main 00480BA0 mov [ebp-28], esp main 00480BA3 mov dword ptr [ebp-24], 480BB0 main 00480BAA mov byte ptr [ebx+8], 0 main 00480BAE call ecx ESP=0016F318 ; (3) main msvcrt.memcmp mov edi, edi -------- Logging stopped From the above log, it is clear that, firstly, at least one indirect call occurs on the way to the function, and secondly, the CLR retrieves the address of the final function from some data structure, i.e. the challenge has considerable indirectness and leaves the transition prediction block no hope of fulfilling its mission. This makes senseless the removal of such functions beyond the limits of the managed code in the event that they do not process large portions of data at a time and do not require a large computation time.
Evaluation of the main function code
In the best, least resource-intensive case, the function will detect the difference in the first byte and return the result. In this case, the function will spend the least time. In the worst case, the function compares the whole arrays and does not detect differences. Obviously, in the second case, the data will be compared by blocks in a loop.
Since disassembling and analyzing the function as a whole in a reasonable time is not possible, to evaluate the executed code, it was decided to make two traces, and to evaluate both these cases using the trace log. To analyze the best case, first, the test data generation function was modified so that all arrays differed from the first byte, and second, the function that compared all arrays was modified, so that in the first iteration of the loop different arrays were compared .
Modified array comparison function
private static bool CompareArraysWithPInvokeMethod() { var result = true; for (int i = CountArrays - 1; i >= 0; i--) // for (int j = 0; j < CountArrays; j++) { var tmp = ByteArrayCompareWithPInvoke(s_arrays[i], s_arrays[j]); result = result && tmp; } return result; } First tracing (best case)
main msvcrt.memcmp mov edi, edi main msvcrt.75A97977 push ebp ESP=0041EC74 main msvcrt.75A97978 mov ebp, esp EBP=0041EC74 main msvcrt.75A9797A push esi ESP=0041EC70 main msvcrt.75A9797B push edi ESP=0041EC6C main msvcrt.75A9797C mov edi, [ebp+10] EDI=00080000 ; edi <-- count main msvcrt.75A9797F mov eax, edi EAX=00080000 ; eax <-- edi main msvcrt.75A97981 sub eax, 0 ; if (eax == 0) {result <-- 0; return;} main msvcrt.75A97984 je msvcrt.zeroResult_GoReturn main msvcrt.75A9798A dec eax EAX=0007FFFF main msvcrt.75A9798B je msvcrt.75A98C10 main msvcrt.75A97991 dec eax EAX=0007FFFE main msvcrt.75A97992 je msvcrt.75A9E610 main msvcrt.75A97998 dec eax EAX=0007FFFD main msvcrt.75A97999 je msvcrt.75A9E5DF main msvcrt.75A9799F dec eax EAX=0007FFFC main msvcrt.75A979A0 je msvcrt.75A98BD2 main msvcrt.75A979A6 mov ecx, [ebp+0C] ECX=034C53B8 ; ecx <-- buf1 main msvcrt.75A979A9 mov eax, [ebp+8] EAX=05C41038 ; eax <-- buf2 main msvcrt.75A979AC push ebx ESP=0041EC68 main msvcrt.75A979AD push 20 ESP=0041EC64 ; main msvcrt.75A979AF pop edx EDX=00000020, ESP=0041EC68 ;-------------------------------- main msvcrt.75A979B0 cmp edi, edx main msvcrt.75A979B2 jae msvcrt.75A993A7 main msvcrt.75A993A7 mov esi, [eax] ESI=4241403F main msvcrt.75A993A9 cmp esi, [ecx] main msvcrt.75A993AB jne msvcrt.75AA80E7 ; main msvcrt.75AA80E7 movzx esi, byte ptr [eax] ESI=0000003F main msvcrt.75AA80EA movzx ebx, byte ptr [ecx] EBX=00000001 main msvcrt.75AA80ED sub esi, ebx ESI=0000003E ; DWORD' main msvcrt.75AA80EF jne msvcrt.75AA8178 main msvcrt.75AA8178 xor ebx, ebx EBX=00000000 ; ebx main msvcrt.75AA817A test esi, esi main msvcrt.75AA817C setg bl EBX=00000001 main msvcrt.75AA817F lea ebx, [ebx+ebx-1] main msvcrt.75AA8183 mov esi, ebx ESI=00000001 main msvcrt.75AA8185 test esi, esi main msvcrt.75AA8187 jne msvcrt.75A98AB1 main msvcrt.75A98AB1 mov eax, esi EAX=00000001 main msvcrt.75A98AB3 jmp msvcrt.75A97A1E main msvcrt.75A97A1E pop ebx EBX=00852AE0, ESP=0041EC6C main msvcrt.return1 pop edi ESP=0041EC70, EDI=034C53B8 main msvcrt.75A97A20 pop esi ESP=0041EC74, ESI=034C53B0 main msvcrt.75A97A21 pop ebp ESP=0041EC78, EBP=0041ECC4 main msvcrt.75A97A22 ret ESP=0041EC7C The first thing that catches your eye here is that the handling of special cases, i.e. cases when the count parameter is within [0..4], made quite unusual. It remains to be seen whether this is the result of the compilation of the switch clause or whether a local variable was actually created there, which was decremented at each step of the check. However, the debug information asserts that it was a switch after all. From the point of view of optimization, this is quite a reasonable action, since The loop does not initialize.
The second thing that immediately caught my eye was a very unusual way of putting the number 0x20 in the edx register (via the stack). This is very similar to a compilation artifact, and clearly indicates that the function was not written in assembler. A man would not have written this, because this makes no sense: the stack is in memory, and calls to it are always slower than to registers. I would venture to suggest that this is an inline artifact.
After detecting the difference of double words in the buffers, a transition is made to the address 0x75AA8178, where the first bytes from the source buffers are loaded into the esi and ebx registers at the addresses where the difference was detected. This is followed by the calculation of the difference between these bytes, and, if no differences are found, the next bytes are loaded, and so on for the whole double word. It is noteworthy that the result does not depend on the number of the byte in which the difference is found. This is evident from the fact that the code for generating the result for the last byte in the DWORD is completely identical to the code for a similar purpose for the first byte given above in the first trace trace.
Sequential comparison of double word bytes
;Address Hex dump Command Comments 75AA80E7 > 0FB630 movzx esi, byte ptr [eax] 75AA80EA . 0FB619 movzx ebx, byte ptr [ecx] 75AA80ED . 2BF3 sub esi, ebx ; DWORD' 75AA80EF .- 0F85 83000000 jne msvcrt.75AA8178 ; ebx 75AA80F5 > 0FB670 01 movzx esi, byte ptr [eax+1] 75AA80F9 . 0FB659 01 movzx ebx, byte ptr [ecx+1] 75AA80FD . 2BF3 sub esi, ebx 75AA80FF .- 0F84 1EF9FEFF je msvcrt.75A97A23 ; 75A97A23 > 0FB670 02 movzx esi, byte ptr [eax+2] 75A97A27 . 0FB659 02 movzx ebx, byte ptr [ecx+2] 75A97A2B . 2BF3 sub esi, ebx 75A97A2D .- 74 15 je short msvcrt.75A97A44 ; 75A97A44 > 0FB670 03 movzx esi, byte ptr [eax+3] 75A97A48 . 0FB659 03 movzx ebx, byte ptr [ecx+3] 75A97A4C . 2BF3 sub esi, ebx 75A97A4E .- 0F84 5F190000 je msvcrt.75A993B3 ; - 75A97A54 . 33DB xor ebx, ebx ; ebx 75A97A56 . 85F6 test esi, esi 75A97A58 . 0F9FC3 setg bl 75A97A5B . 8D5C1B FF lea ebx, [ebx+ebx-1] 75A97A5F . 8BF3 mov esi, ebx 75A97A61 .- E9 4D190000 jmp msvcrt.75A993B3 ; 75A993B1 . |33F6 xor esi, esi 75A993B3 > |85F6 test esi, esi 75A993B5 .-|0F85 F6F6FFFF jne msvcrt.75A98AB1 Duplication of the code is not good, but not terrible, but a consistent comparison of bytes is not the best way to compare double words, especially since the byte number does not affect the result. Thus, it is already clear that this code is somewhat strange, perhaps because the source code is even more strange.
First look at the second trace log: 8 double words are compared in one iteration of the cycle, and this is good: it is clear that the cycle has been expanded, and on the other hand, after each comparison, absolutely identical useless code goes: register esi is entered 0 and the contents of register esi are analyzed . I have no assumptions about why this was done, however, there is an assumption about how this could happen: firstly, it is very similar to the result of the work of some macro that formed the assembler code, and secondly, it seems that the Microsoft C compiler is not as good as I thought about it before.
Second trace (loop only)
;-------------------------------- main msvcrt.75A979B0 cmp edi, edx main msvcrt.75A979B2 jae msvcrt.75A993A7 main msvcrt.75A993A7 mov esi, [eax] ESI=00000000 main msvcrt.75A993A9 cmp esi, [ecx] main msvcrt.75A993AB jne msvcrt.75AA80E7 main msvcrt.75A993B1 xor esi, esi main msvcrt.75A993B3 test esi, esi main msvcrt.75A993B5 jne msvcrt.75A98AB1 main msvcrt.75A993BB mov esi, [eax+4] main msvcrt.75A993BE cmp esi, [ecx+4] main msvcrt.75A993C1 jne msvcrt.75AA811F main msvcrt.75A993C7 xor esi, esi main msvcrt.75A993C9 test esi, esi main msvcrt.75A?993CB jne msvcrt.75A98AB1 main msvcrt.75A993D1 mov esi, [eax+8] main msvcrt.75A993D4 cmp esi, [ecx+8] main msvcrt.75A993D7 jne msvcrt.75A97A9A main msvcrt.75A993DD xor esi, esi main msvcrt.75A993DF test esi, esi main msvcrt.75A993E1 jne msvcrt.75A98AB1 main msvcrt.75A993E7 mov esi, [eax+0C] main msvcrt.75A993EA cmp esi, [ecx+0C] main msvcrt.75A993ED jne msvcrt.75A97B1F main msvcrt.75A993F3 xor esi, esi main msvcrt.75A993F5 test esi, esi main msvcrt.75A993F7 jne msvcrt.75A98AB1 main msvcrt.75A993FD mov esi, [eax+10] main msvcrt.75A99400 cmp esi, [ecx+10] main msvcrt.75A99403 jne msvcrt.75A97BA4 main msvcrt.75A99409 xor esi, esi main msvcrt.75A9940B test esi, esi main msvcrt.75A9940D jne msvcrt.75A98AB1 main msvcrt.75A99413 mov esi, [eax+14] main msvcrt.75A99416 cmp esi, [ecx+14] main msvcrt.75A99419 jne msvcrt.75A97C29 main msvcrt.75A9941F xor esi, esi main msvcrt.75A99421 test esi, esi main msvcrt.75A99423 jne msvcrt.75A98AB1 main msvcrt.75A99429 mov esi, [eax+18] main msvcrt.75A9942C cmp esi, [ecx+18] main msvcrt.75A9942F jne msvcrt.75AA1172 main msvcrt.75A99435 xor esi, esi main msvcrt.75A99437 test esi, esi main msvcrt.75A99439 jne msvcrt.75A98AB1 main msvcrt.75A9943F mov esi, [eax+1C] main msvcrt.75A99442 cmp esi, [ecx+1C] main msvcrt.75A99445 jne msvcrt.75A97CFC main msvcrt.75A9944B xor esi, esi main msvcrt.75A9944D test esi, esi main msvcrt.75A9944F jne msvcrt.75A98AB1 main msvcrt.75A99455 add eax, edx EAX=031353B8 main msvcrt.75A99457 add ecx, edx ECX=031353B8 main msvcrt.75A99459 sub edi, edx EDI=0007FFE0 main msvcrt.75A9945B jmp msvcrt.75A979B0 It is noteworthy that on large volumes of test data, this code showed a result ~ 10% worse than the code using unsafe. It is clear that most of the time when comparing data arrays is spent on reading operations from memory, which is much slower than the processor cache and, especially, the registers. But such a serious difference, which was given only by operations with the registers of the processor, says that compiler optimizations are extremely important. I would venture to suggest that testing on a weaker processor, for example, on a processor with a lower clock frequency, would make a much more significant difference.
findings
- If you need to quickly compare small (7 bytes or less) arrays, we take the most obvious way (byte-by-byte comparison in the loop), the large ones are unsafe, and everything else is from the evil one.
- .Net CLR . , JIT- , , CLR «» . It is not true. JIT- , . — C++- Intel, , (AMD Intel) .
- C-RunTime , , C- – MS VC. « » (http://rsdn.ru/article/optimization/optimization.xml): « , , ».
Bibliography
- Intel® 64 and IA-32 Architectures Software Developer Manuals .CHAPTER 2. Intel ® 64 Architecture
- AMD64 Architecture Programmer's Manual Volume 1 : Application Programming CHAPTER 1 Long Mode
- Intel® 64 and IA-32 Architectures Optimization Reference Manual . CHAPTER 3. Alignment
- Windows Internals, Sixth Edition, Part 1, CHAPTER 5 Processes, Threads, and Jobs
- Windows Internals, Sixth Edition, Part 2, CHAPTER 10. Memory Management
- Intel® 64 and IA-32 Architectures Software Developer Manuals. CHAPTER 17. TIME-STAMP COUNTER
- MSDN Magazine 2005, May: Drill Into .NET Framework Internals to See How the CLR Creates Runtime Objects
- Joe Duffy, Professional .NET Framework 2.0 (Programmer to Programmer). Chapter 3: Inside the CLR, Just-In-Time (JIT) Compilation
21.03.2014 4:37
- , «CRL».
- ( ), MSDN.
- .
Last time I posted incorrect source codes in the comments. The fact is that in the process of experiments, about which I did not write, or wrote partially, the sources were not suitable for obtaining the results from the article. For example:
- Some calls in the method were commented out
DoMeasurements().result.SequenceEqualTime = result.IStructuralEquatableTime = result.PInvokeTime; - The method
PrepareTestData(int p_ArraySize)generated arrays that differ from the first byte. - Constants were set so that the starting array size was 512 * 1024, and the array was only 64.
- The method was
CompareArraysWithPInvokeMethod()also modified so that the different arrays are compared first. Although this, in theory, should not have a strong impact on the final data.
As a result, this led to the fact that those who downloaded and launched them could not repeat the results from the article.
I put the corrected sorts here.
While I was working on correcting typos and errors, Saladin corrected and put the sorts on GitHub , so you can not download, but just watch.
Updated on 3/25/2014 6:37
By popular demand, I researched
RtlCompareMemory().Before studying the function code, I tested it by first setting the SuppressUnmanagedCodeSecurity attribute for the function
memcmp()and it is RtlCompareMemory()curious that the system function that can be called from both user-mode and kernel-mode turned out to be slower than the function from the CRT set.
If both blocks of memory are resident. Callers of RtlCompareMemory can be running at any IRQL
Results under the cut
Unsafe MemCMP RtlCompareMemory 1 279 1 : 001,7 1 : 003,2 1 : 008,8 1 : 001,0 1 278 1 : 001,8 1 : 003,2 1 : 008,9 1 : 001,0 2 325 1 : 001,3 1 : 002,9 1 : 006,1 1 : 001,0 4 374 1 : 001,1 1 : 002,6 1 : 009,0 1 : 001,0 7 422 1 : 001,0 1 : 002,5 1 : 007,0 1 : 001,1 12 426 1 : 001,0 1 : 002,5 1 : 006,9 1 : 001,7 19 490 1 : 001,0 1 : 002,2 1 : 006,0 1 : 001,9 32 560 1 : 001,0 1 : 002,0 1 : 005,3 1 : 002,7 54 622 1 : 001,0 1 : 002,0 1 : 005,4 1 : 003,8 89 802 1 : 001,0 1 : 001,7 1 : 004,3 1 : 004,7 147 1092 1 : 001,0 1 : 001,5 1 : 003,7 1 : 004,0 242 1571 1 : 001,0 1 : 001,4 1 : 003,0 1 : 004,2 398 2328 1 : 001,0 1 : 001,4 1 : 002,7 1 : 004,5 657 3664 1 : 001,0 1 : 001,2 1 : 002,2 1 : 004,6 1082 5519 1 : 001,0 1 : 001,2 1 : 002,1 1 : 005,0 1782 8554 1 : 001,0 1 : 001,2 1 : 002,1 1 : 005,3 2936 13520 1 : 001,0 1 : 001,2 1 : 002,0 1 : 005,5 4837 21771 1 : 001,0 1 : 001,2 1 : 002,0 1 : 005,6 7967 35464 1 : 001,0 1 : 001,2 1 : 001,9 1 : 005,7 13124 58073 1 : 001,0 1 : 001,2 1 : 001,9 1 : 005,7 21618 96457 1 : 001,0 1 : 001,2 1 : 001,9 1 : 005,7 35610 167952 1 : 001,0 1 : 001,1 1 : 001,8 1 : 005,4 58656 285282 1 : 001,0 1 : 001,1 1 : 001,8 1 : 005,3 96617 534712 1 : 001,0 1 : 001,1 1 : 001,6 1 : 004,7 159146 924569 1 : 001,0 1 : 001,1 1 : 001,6 1 : 004,5 262143 1520968 1 : 001,0 1 : 001,1 1 : 001,6 1 : 004,5 In the screenshot with the debugger windows, the library version

The function turned out to be surprisingly small, it is all here, under the cut. The function actively uses string comparison operations with the repetition prefix (
cmps*). Memory comparison is in direct order. This is determined by the DF flag, which is reset by the command cld. The size and simplicity of this function suggests that it was written in assembler, although I am not sure about that.The algorithm for the operation of string comparison operations is extremely simple, for example, comparison of DWORDs in the forward direction, given by this command:
repe cmpsd ; ecx DWORD'; on JAVA can be represented as follows:
while ( ( 0 != ecx ) & ( 0 == Compare( (DWORD) RAM[esi], (DWORD) RAM[edi] ) ) ) { --ecx; edi += 4; esi += 4; } Almost the same can be represented by the alignment of words and bytes.
Dizasm with comments under the cut
push esi ; push edi cld ; DF <-- 0 mov esi, [esp+0C] ; esi <-- Source1 mov edi, [esp+10] ; edi <-- Source2 mov ecx, [esp+14] ; ecx <-- SIZE_T shr ecx, 2 ; ecx <-- (ecx >> 2) ( 4) jz short smaller_4 ; repe cmpsd ; ecx DWORD'; jne short not_zero ; if ( !ZF ) goto not_zero; smaller_4: mov ecx, [esp+14] ; ecx <-- SIZE_T and ecx, 00000003 ; ecx &= 3 jz short return_SIZE_T ; if ( ZF ) goto return_SIZE_T; repe cmpsb ; jne short found_difference return_SIZE_T: mov eax, [esp+14] ; eax <-- SIZE_T pop edi ; pop esi ret 0C ; return eax not_zero: sub esi, 4 ; esi -= 4 sub edi, 4 ; edi -= 4 mov ecx, 4 ; ecx -= 4 repe cmpsb ; found_difference: dec esi ; --esi sub esi, [esp+0C] ; esi <-- (esi - Source1) mov eax, esi ; eax <-- esi pop edi ; pop esi ret 0C ; return eax Source: https://habr.com/ru/post/214841/
All Articles