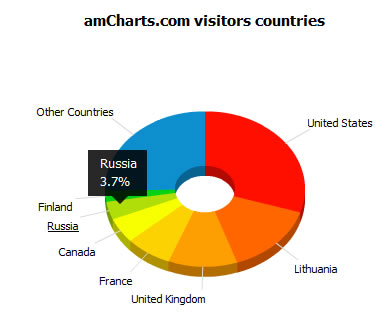
11 flash components for graphing for rich web
If you are developing interfaces, you are probably faced with the need to place on your project’s pages a chart or a chart of one or another content and type: in one case it could be a daily drop-down schedule for spam messages, in the other a live chart showing the number of comments to your article.
A couple of years ago there were not many solutions on the surface that allowed to solve the problem, and the developer, as a rule, was forced to sit down at the GD, ImageMagick or other library, which allowed to draw gif-files using a favorite scripting language. Interactivity in such solutions was not very much, while the complexity of writing a good plotter could easily make you think about the feasibility of the entire project.
However, the situation is changing for the better, which I decided to write about. So, flash-tools for building graphs, charts and diagrams for the web. They have a single, really quite noticeable flaw - if the visitor has flash disabled, he will not see anything. If you want to make sure - it would be nice to check the presence of the included flash and give either static graphics or a warning that you need to enable the display of flash.

')
More >>
A couple of years ago there were not many solutions on the surface that allowed to solve the problem, and the developer, as a rule, was forced to sit down at the GD, ImageMagick or other library, which allowed to draw gif-files using a favorite scripting language. Interactivity in such solutions was not very much, while the complexity of writing a good plotter could easily make you think about the feasibility of the entire project.
However, the situation is changing for the better, which I decided to write about. So, flash-tools for building graphs, charts and diagrams for the web. They have a single, really quite noticeable flaw - if the visitor has flash disabled, he will not see anything. If you want to make sure - it would be nice to check the presence of the included flash and give either static graphics or a warning that you need to enable the display of flash.

')
More >>
Source: https://habr.com/ru/post/21482/
All Articles