As we Russian firms investigated

What do you do if you have a few dozen gigabytes of data? We first of all try to draw this data in some way - it seems that links that were not directly visible can appear in the visual display.
This is exactly what we did with the data on more than 20 million legal entities officially registered in Russia. The Uniform State Register of Legal Entities provides such information to everyone (and Kontur based on it even made its Kontur.Focus service). For each company and individual entrepreneur, we know a whole mountain of information: the date of registration, the founders (including foreign ones), their shares in preparing the initial capital, several types of names (full, abbreviated, English), addresses, telephones ...
')
The most interesting thing that we found in this heap of unstructured data is a different kind of communication between firms. To begin with, we admired connections showing who organized whom. This seemed to us a little, and we tied the company, having the same person in the directors. We seriously hooked on this case, and a week later we already had connections between firms with the same legal address or the same phone number.
Immediately the question arose: how best to study firms and their relationships with others? How to find companies that have the same address with those established by Gazprom (and there are more than a hundred “children”)? Of course, draw! Since firms with connections between them form a graph, we first paid attention to graph visualizers.
If you have ever engaged in visualization of graphs, then you know the limitations of the corresponding algorithms and tools. At best, we are talking about tens of thousands of vertices, a maximum of about a hundred, and then this is likely to be completely not in real time. And we had tens of millions of peaks, even more edges, and even meta-information about the types of connections! We had to do something, and we decided to realize the opportunity to look at our graph in small pieces, because at each moment we are only interested in the neighborhood of a particular company.
We took Gephi (this is a program for drawing graphs and not only, details can be found on their website ) and wrote a plugin for it that allows us to view certain parts of our large graph “under a magnifying glass”. On the way, we also made a pull request with fix bugs in the plugin for Gephi, which did not allow us to transfer Russian company names over the network. At each moment of time, we looked only at a small piece, while having the opportunity to add to the consideration of some company or even everyone with whom it is connected by connections.
Having played with the plugin, we realized that this was not enough - it was inconvenient to solve the problems of research of firms and their surroundings, using it. Then we carefully consulted and decided that it would be most convenient to work with such a graph on touch devices. Just imagine - an elegant tap on the screen, and you are already studying the firms associated with the chosen one. Zoom in and out with standard gestures. Dynamic addition of new companies and links to the screen in real time. And all this on the tablet, so that the discovered interesting things can be shown on the road or at a meeting.
So, we decided to develop an application for Aipad, which will pick up information about the neighborhood of companies from the server, place it on the tablet screen and provide the user with a convenient interface for working with this data.
Immediately, many interesting problems arose. We will tell about all in order.
Task 1. Server
The server part of our application is simple and complex at the same time. It is simple, because it does not need to do almost anything, just store and give information about firms adjacent to a given one, and also give various meta-information about companies and connections, such as the founders of the company, creation date, addresses, phone numbers and other other, other. Difficult, because this simple task needs to be done quickly and efficiently, because you want to process a lot of clients in real time, and do it at the cost of a small amount of resources.
We decided to abandon the use of large and monstrous databases, and write something of our own - small and fast. We took C ++, added some Python, and here we have what we needed - a fast and easily scalable server for storing companies and the relationships between them. All data is actually stored on disk, only indexes are loaded into RAM for quick access, which makes it possible, if necessary, to start the server on a regular machine of any developer or user.
Since in our heads all the time there existed the idea of a variety of clients for different platforms, we chose HTTP as the transport, and JSON as the format of the transmitted data. This slows down the speed of data transmission and processing, but makes it much more convenient to work with the service on different clients.
Task 2. Convenient interface
Few people decide to make an application that shows only a graph on the screen. Of the similar tablet applications we found, Wikiweb and Solyaris turned out to be the most similar. But none of them solved problems similar to those that confronted us. How to show a mountain of textual information about a particular company at the request of the user? What to do with the environment, if it has more than five hundred firms? And if more than a thousand?
We tried several different interface solutions. Some of us were discarded at once, some were given to ordinary people. The key feature that we have identified for ourselves at these stages is the minimization of textual information on the main screen, which contains a graph directly with companies. Unnecessary in most cases, detailed information should be hidden by default, and all controls should be made visual and visual.
We decided to do the following with the problem of a large number of neighboring firms: in the case of an attempt to show an exorbitantly large neighborhood, we will display a user-friendly search in which all neighboring firms are divided into groups according to some “importance” of the firm. The “importance” in this case was the size of the firms, the number of connections known to it.
After drawing different versions of the interfaces, something like this came out:

Task 3. Client application
There were several requirements for the application that would draw a picture with links between firms. But one of them was crucial - the application should fly. In every sense of the word - it should work quickly, and all changes in the displayed structure should occur smoothly. Therefore, when developing an application for iPad, we used only native code written in Objective-C and C ++. Cocos2D is responsible for drawing, he copes with it well, so there is nothing interesting here.
The most interesting thing is, as always, under the hood. As we have already discussed, what is displayed on the screen at any given moment in time is nothing but an ordinary graph, with its vertices and edges. In order for the user of the application to have at least something clear among the tens and hundreds of vertices currently displayed, it is necessary to solve the problem of a good graph image on a plane . It is clear that it is impossible to achieve an ideal in solving this problem (it simply does not exist), but we tried :)
To solve the problem of graph layout on the plane, it was decided to use the Force Atlas family of algorithms and, in particular, its modifications developed by the French scientist Mathieu Jacomy. The idea of the Force Atlas algorithms is that in place of each vertex of our graph, we place a small weight of a corresponding weight, and replace all the edges of the graph with springs with a certain coefficient of elasticity. The whole system comes into action, and after a while it stops. The resulting process is recorded and can be shown in a somewhat slow form for beautiful animation of the gradual change in the position of the vertices in the image.
We found implementations of similar algorithms in Java and JavaScript, but we needed a really very fast code. A Java implementation port in C ++ was also found, but the number of dependencies in it was incredibly large and scared us. The iPad doesn’t have much power, especially compared to desktop computers, so we needed something really lightweight.
By adding a week to C ++, mixing it all with Objective-C, we got our implementation of Force Atlas, which suited us for speed and flexibility. She remained flexibly customizable, but at the same time she managed to display hundreds of vertices on the screen of the tablet in real time.
Here are some screenshots of what we got (on click - full-size versions):
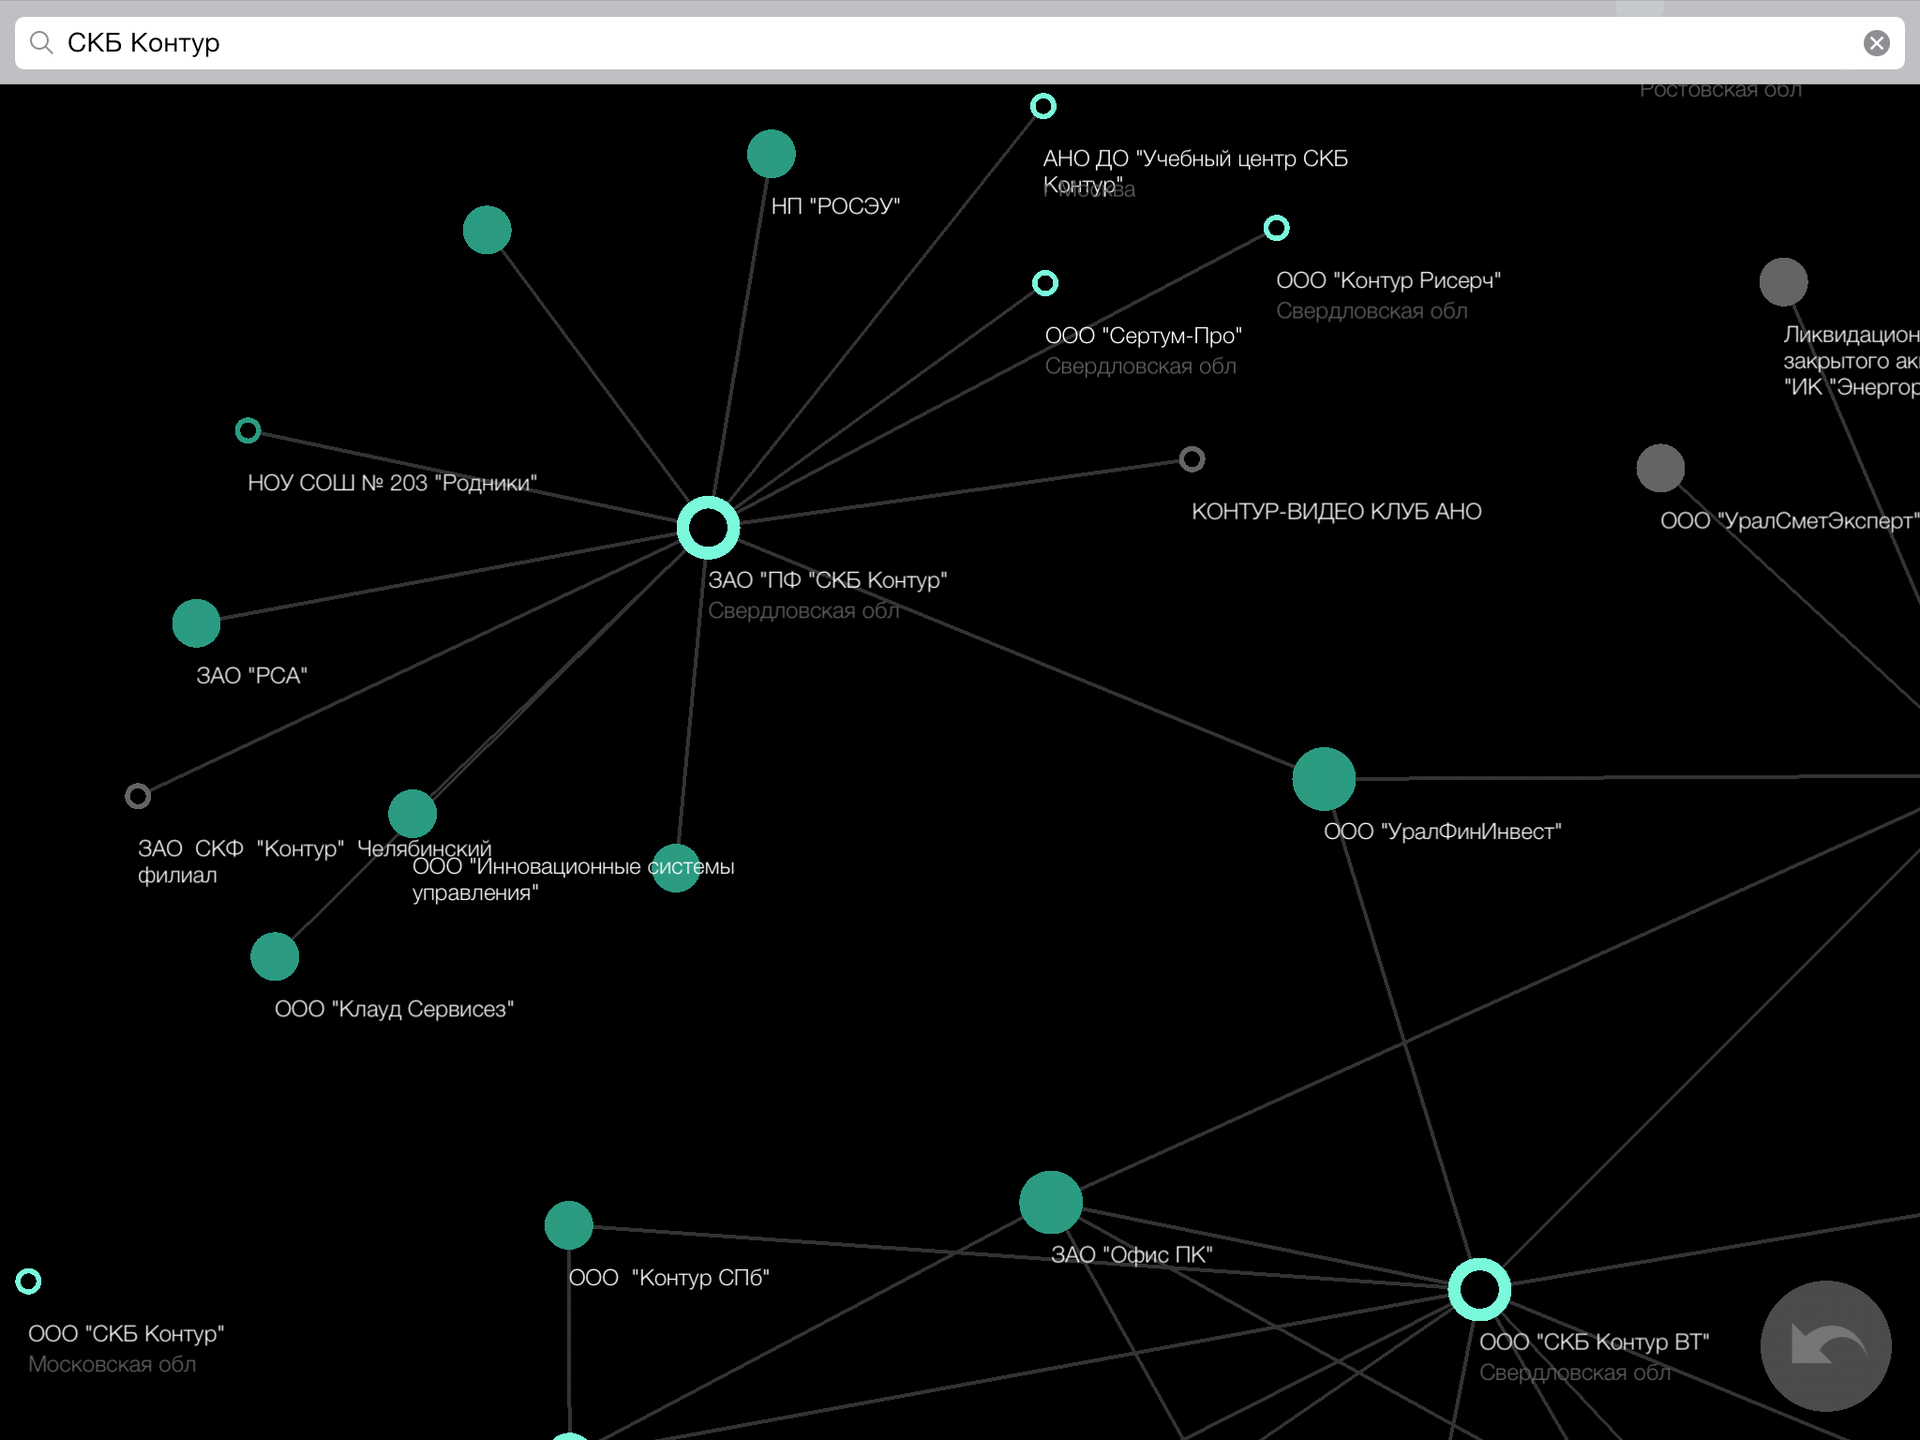
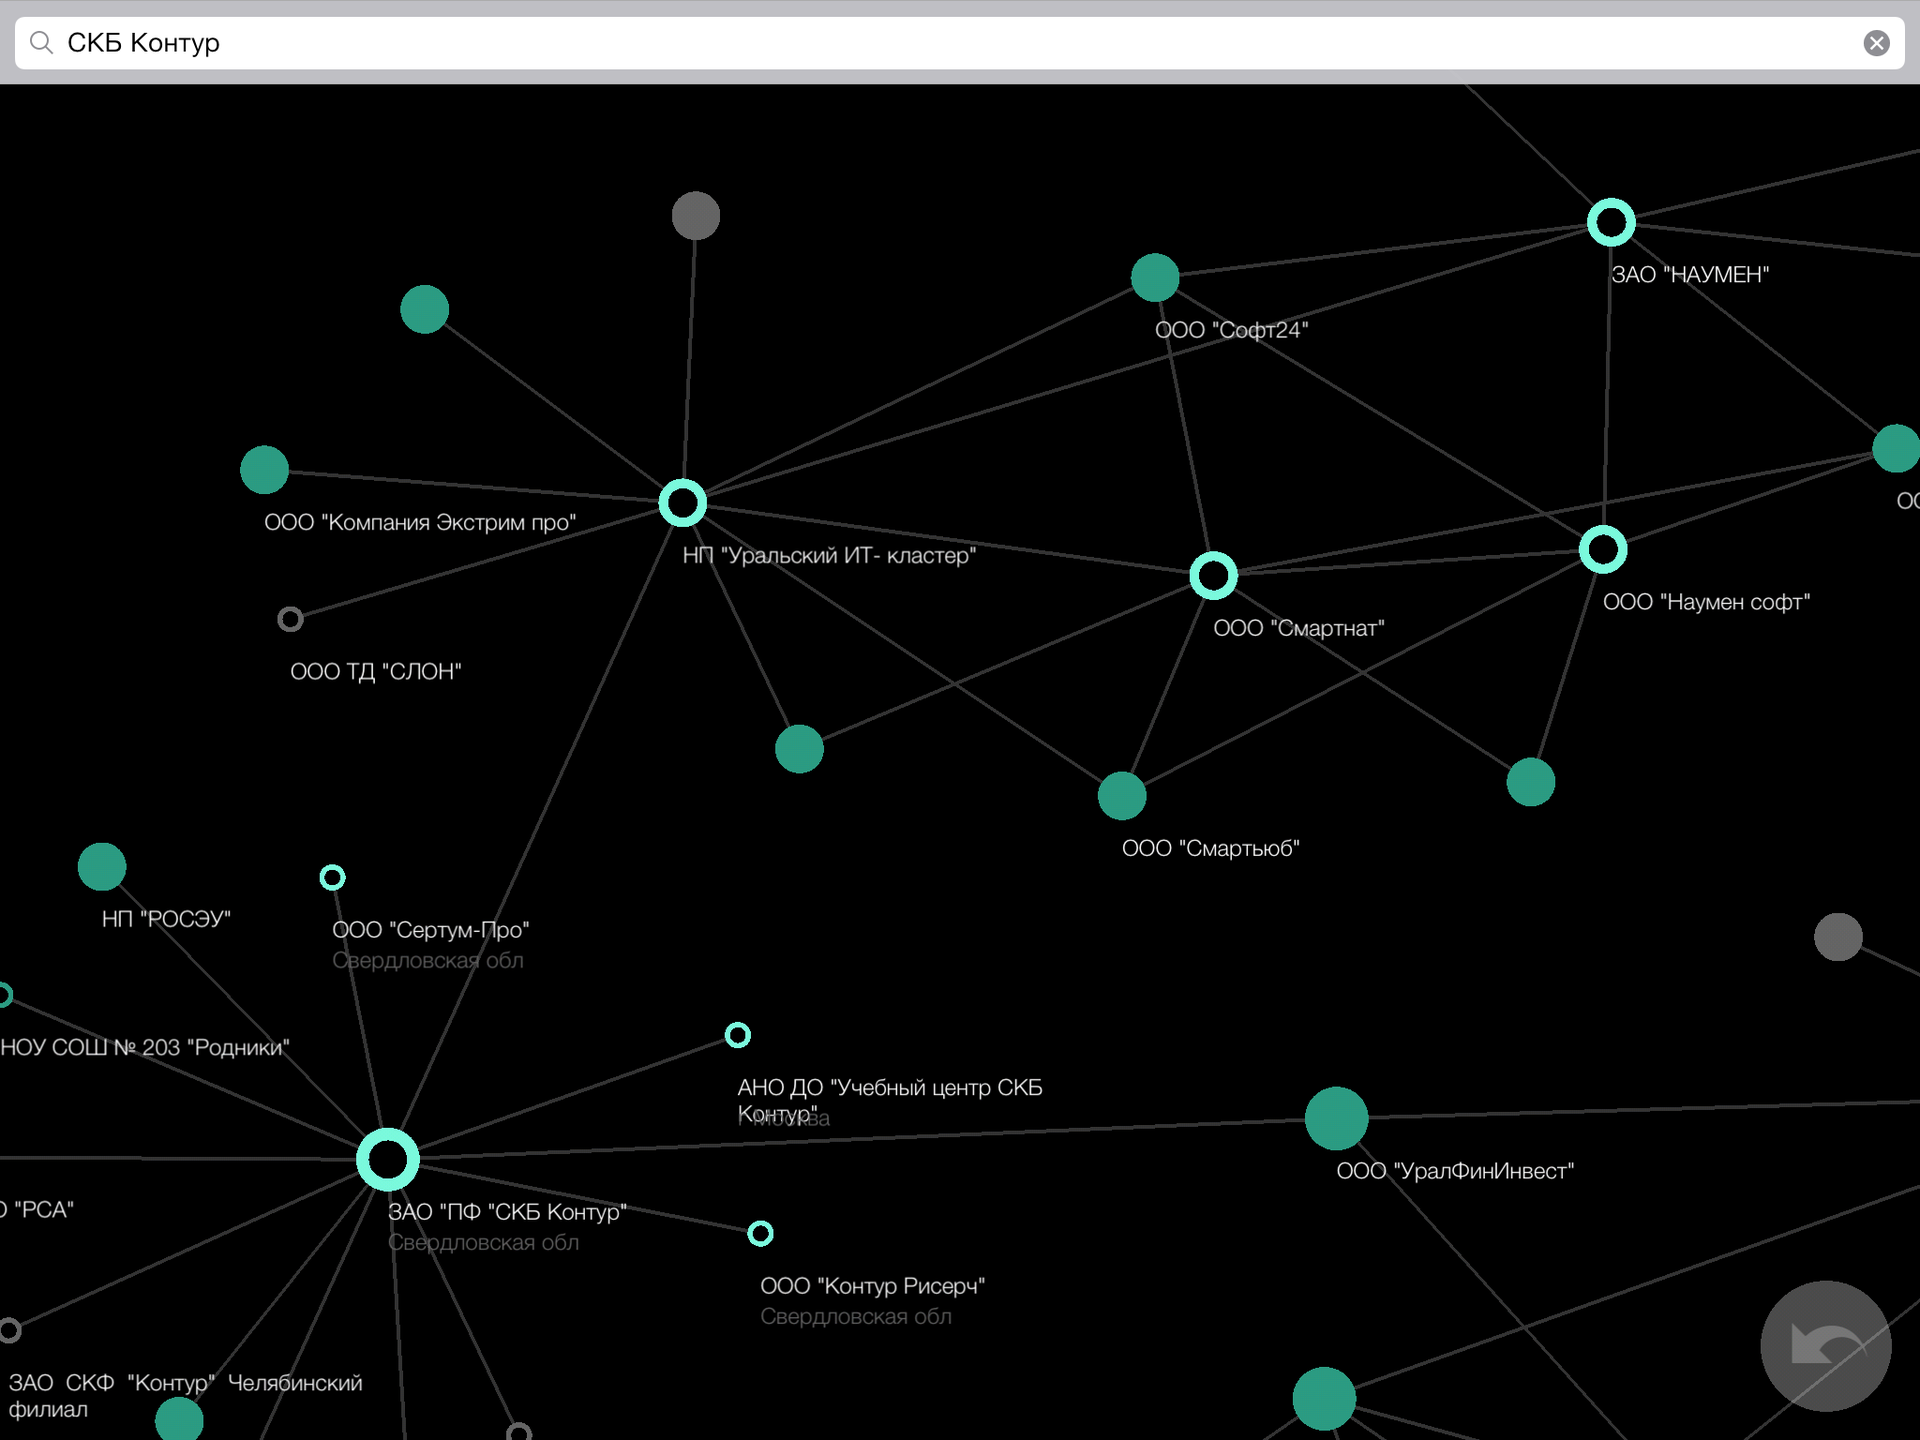

What have we got?
We would very much like to show the public the final version of the application. But, unfortunately, we cannot do this, since the data used for it constitute the commercial idea of Contour. Focus. In order to show the beauty of the dynamic layout of the graph on a plane, we sketched an application on our knees, operating with data about actors and movies. We took these data from the well-known IMDB database by downloading them from one of their FTP servers .
Actors and films became the tops of the count, we laid a rib if the actor played in this film. In order not to clutter up the data (as well as to get rid of films for adults), we threw out from the base all the films with a rating strictly below 7. You can download the resulting app for the iPad.
For a snack, a video of the process of studying the graph on the tablet, recorded from the emulator, with the disclosure of the surroundings and the dynamic loading of new firms. Watch, of course, in the best quality.
We will be very glad to any feedback of all interested readers :-)
Source: https://habr.com/ru/post/214653/
All Articles