ElasticSearch 1.0 - new analytics features
Many have heard about the high-level search server ElasticSearch , but not everyone knows that many people use it for quite different purposes. This is a real-time analytics of various structured and not very data.
This article is also overdue due to the fact that many large Internet-based projects of Runet in 2014 received letters from Google Analytics with an offer to pay $ 150,000 for the opportunity to use their product. I personally think that there is nothing wrong with paying for the work of programmers and administrators. But at the same time, these are quite serious investments, and, maybe, investments in our own infrastructure and specialists will give greater flexibility in the future.
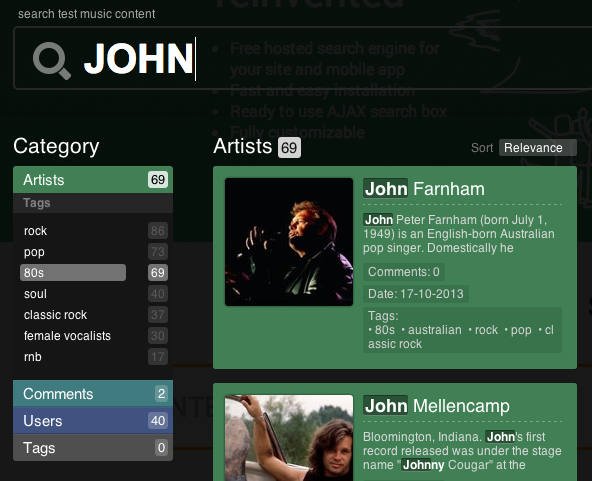
Analytics in ElasticSearch is based on full-text search and facets. Facets in the search - this is some kind of aggregation on a certain basis. You have often come across facet filters in online stores: in the left or right column there are specifying ticks. Below is an example of a test facet search on our home page http://indexisto.com/ .
')
Just a week ago, a stable version of the search server ElasticSearch 1.0 was released, in which the developers worked so hard on the facets that they even called them Aggregation.
Since the topic has not yet been covered in Habré, I want to tell you what aggregations in ElasticSearch are, what opportunities open up and whether there is life without Hadoop.
First, I would like to give statistics from Google Trends , which clearly shows how great interest in ElasticSearch is:

The point here, of course, is not that it is a search server with morphology and other goodies. The main thing is easy scalability on large amounts of data. The data itself is dispersed by shards (logical index splitting), and shards by nodes (servers). Then shards are also replicated to other nodes in order to survive the server crash and for query performance. It is necessary to think, mainly, during the elaboration of the index scheme.
The query is executed on the cluster in parallel, on those shards in which the index of interest lies. Shards are, in fact, good old Lucene indices. All that ElasticSearch does is accept the request, determine the nodes where the shards of the index to which the request came are, send the request to these shards, the shards count and send the results to the initiator node. The initiating node already does the convolution and sends it to the client. On data streams, this is similar to a reduce map, when Lucene indices are mappers, and the initiating node is a reducer.
Some requests can be executed in one pass, some in several. For example, to calculate the standard text relevance tf / idf, based on the frequency of the term in the document (tf) and in the collection of documents (idf), obviously, you must first get idf with all shards (the first request to shards), and then make the main request (second). Although for speed idf can be counted locally on the shard.
Let's make a faceted query “How many errors were in the logs by year”. This query searches for ERROR in log documents, and makes facets by year.
This is how data flows look like:

The node to which the request came, executed it itself (since it has one of the shards of the required index) and sent it to other nodes that contain other index shards. Each shard performs approximately the following sequence in the index:
A quick reference to Lucene. Range queries on "numbers" in textual representation are very effective. NumericRangeQuery :
Since now we’ll just see what can be aggregated into ElasticSearch, we will not chase after volumes, but we’ll add habr index and add 20 posts to it.
Posts will be like this structure:
I created 10 posts about Android and 10 posts about iPhone.
Posts can have one or more tags from the set
Years of posts from 2011 to 2014 . Rating from 0 to 100 . Number of comments is similar.
Here is what we have in the index as a result:

Tag allocation in posts about Android
Immediately in practice, we will show what can be analyzed by combining full-text search and facets. Make a android search query to the Title field and a faceted query on the tags field:
In response, we get:
Well, for comparison, the same thing, but if we are looking for posts about the iPhone :
As can be seen from analysts, iPhones more often explode, and androids are updated.
Histogram of the distribution of posts about the iPhone by year
Another example in which we consider how the interest in iPhones has changed over time. IPhone request, postDate facets :
Answer:
As you can see, a surge of interest occurred in 2012 (in response to the timestamps).
It’s pretty clear how this works. Main types of facets in ElasticSearch
Combining facets and full-text queries, you can get many different samples.
As you noticed, facets in ES to version 1.0 just returned the number of documents. Requests were rather flat (no nesting). But what if we want to get posts about the iPhone over the years, and then calculate the average rating of these posts?
In ES 1.0, this became possible thanks to the Aggregation framework.
There are two types of aggergation:
Bucket - which count the number of documents found, as well as add the id of the found documents into the “basket”. For example, the above facet requests like term, range, histogram are Bucket-aggregates. Now they do not just count the number of documents, for example, by terms in the tag field, but also give out lists of these documents: 7 documents with the “bug” tag, these documents id 2,5,6,10,17,19,20
Calc - which count only a number. For example, the average value of a numerical field, minima, maxima, sums.
Bucket-units knowingly return the id of the found documents. The fact is that now you can build a chain of aggregates. For example, the first unit we break all the documents by year, then we find the distribution of tags by year.
In order not to beat around the bush, back to our test data. Let's find the most boring tag posts about iPhone broken down by year. In other words, we’ll find all the articles about Iphone, split the sample by years, and see which tags are in the articles with the lowest rating. Then we forbid authors to write articles on this topic. Request such:
Answer:
As you can see, in 2011 and 2012, people got posts about iPhone explosions, in 2013 about new applications, and in 2014 about bugs.
The standard task of an online store is to calculate the effectiveness of an advertising campaign or analyze the behavior of a group of users. Imagine that you push all the logs of your http-server in ElasticSearch, while adding to the document some more of your data that you have stored, for example, in Bitrix
At the same time the scheme of the document is not fixed. There is an order on this page - they added an orderPrice , no - they did not.
With just such logs, you can already have a lot of things that Google Anallytics can do.
Example 1: To make a cohort analysis, for example, split users by registration date and see how many orders were made by them 2 months after registration, calculate the average amount of the order. Here is how a logical query to ElasticSearch looks like:
Example 2: Track goals and conversions by channel by date. For example, the goal is to visit the URL / purchase / confirmed
Request:
The combination of full-text search and chains of aggregations (facets), flexible document layout, automatic scalability and ease of setup and launch make ElasticSearch a serious player in the market for analytical systems.
I also add that the threshold of entry is very low. Installation in 5 minutes, then you can play even with curl, even though a plugin for Chrome that can generate http requests. We have http://indexisto.com/ now a cluster of 7 cars shows itself surprisingly stable.
All possibilities of aggregation are described here https://github.com/elasticsearch/elasticsearch/issues/3300
This article is also overdue due to the fact that many large Internet-based projects of Runet in 2014 received letters from Google Analytics with an offer to pay $ 150,000 for the opportunity to use their product. I personally think that there is nothing wrong with paying for the work of programmers and administrators. But at the same time, these are quite serious investments, and, maybe, investments in our own infrastructure and specialists will give greater flexibility in the future.
Analytics in ElasticSearch is based on full-text search and facets. Facets in the search - this is some kind of aggregation on a certain basis. You have often come across facet filters in online stores: in the left or right column there are specifying ticks. Below is an example of a test facet search on our home page http://indexisto.com/ .
')
Just a week ago, a stable version of the search server ElasticSearch 1.0 was released, in which the developers worked so hard on the facets that they even called them Aggregation.
Since the topic has not yet been covered in Habré, I want to tell you what aggregations in ElasticSearch are, what opportunities open up and whether there is life without Hadoop.
First, I would like to give statistics from Google Trends , which clearly shows how great interest in ElasticSearch is:
The point here, of course, is not that it is a search server with morphology and other goodies. The main thing is easy scalability on large amounts of data. The data itself is dispersed by shards (logical index splitting), and shards by nodes (servers). Then shards are also replicated to other nodes in order to survive the server crash and for query performance. It is necessary to think, mainly, during the elaboration of the index scheme.
Distributed computing
The query is executed on the cluster in parallel, on those shards in which the index of interest lies. Shards are, in fact, good old Lucene indices. All that ElasticSearch does is accept the request, determine the nodes where the shards of the index to which the request came are, send the request to these shards, the shards count and send the results to the initiator node. The initiating node already does the convolution and sends it to the client. On data streams, this is similar to a reduce map, when Lucene indices are mappers, and the initiating node is a reducer.
Some requests can be executed in one pass, some in several. For example, to calculate the standard text relevance tf / idf, based on the frequency of the term in the document (tf) and in the collection of documents (idf), obviously, you must first get idf with all shards (the first request to shards), and then make the main request (second). Although for speed idf can be counted locally on the shard.
Let's make a faceted query “How many errors were in the logs by year”. This query searches for ERROR in log documents, and makes facets by year.
This is how data flows look like:
The node to which the request came, executed it itself (since it has one of the shards of the required index) and sent it to other nodes that contain other index shards. Each shard performs approximately the following sequence in the index:
- define the maximum and minimum value in the date field. Lucene does not store within the date or number - all in the text view.
- prepare the necessary date ranges in accordance with the partition the user needs. We have it for 1 year. If there are logs for 2 years, then we get 2 requests
- go through the inverted index and count all documents (log entries) that contain ERROR and fall into the current range. Make such a request for all ranges.
A quick reference to Lucene. Range queries on "numbers" in textual representation are very effective. NumericRangeQuery :
Comparisons of the different types of RangeQueries on an index with about 500,000 docs showed that TermRangeQuery in boolean rewrite mode (with raised BooleanQuery clause count) took about 30-40 secs to complete, TermRangeQuery in constant score filter rewrite mode took 5 secs and executing this class took <100ms to complete We proceed to practice. Prepare the data
Since now we’ll just see what can be aggregated into ElasticSearch, we will not chase after volumes, but we’ll add habr index and add 20 posts to it.
Posts will be like this structure:
{ "user": "andrey", "title": "Android 1", "body": "Android 1", "postDate": "2011-02-15T11:12:12", "tags": [""], "rank": 67, "comments": 21 } I created 10 posts about Android and 10 posts about iPhone.
Posts can have one or more tags from the set
- explosion
- update
- attachment
- bug
Years of posts from 2011 to 2014 . Rating from 0 to 100 . Number of comments is similar.
Here is what we have in the index as a result:
Old-school-analysis (up to version ES 1.0)
Tag allocation in posts about Android
Immediately in practice, we will show what can be analyzed by combining full-text search and facets. Make a android search query to the Title field and a faceted query on the tags field:
{ "query": { "wildcard": { "title": "Android*" } }, "facets": { "tags": { "terms": { "field": "tags" } } } } In response, we get:
"facets": { "tags": { "_type": "terms", "missing": 0, "total": 18, "other": 0, "terms": [ { "term": "", "count": 5 }, { "term": "", "count": 5 }, { "term": "", "count": 4 }, { "term": "", "count": 4 } ] } } Well, for comparison, the same thing, but if we are looking for posts about the iPhone :
"facets": { "tags": { "_type": "terms", "missing": 0, "total": 16, "other": 0, "terms": [ { "term": "", "count": 5 }, { "term": "", "count": 5 }, { "term": "", "count": 4 }, { "term": "", "count": 2 } ] } } As can be seen from analysts, iPhones more often explode, and androids are updated.
Histogram of the distribution of posts about the iPhone by year
Another example in which we consider how the interest in iPhones has changed over time. IPhone request, postDate facets :
{ "query": { "wildcard": { "title": "iPhone" } }, "facets": { "articles_over_time": { "date_histogram": { "field": "postDate", "interval": "year" } } } } Answer:
"facets": { "articles_over_time": { "_type": "date_histogram", "entries": [ { "time": 1293840000000, "count": 2 }, { "time": 1325376000000, "count": 4 }, { "time": 1356998400000, "count": 2 }, { "time": 1388534400000, "count": 2 } ] } } As you can see, a surge of interest occurred in 2012 (in response to the timestamps).
It’s pretty clear how this works. Main types of facets in ElasticSearch
- term is convenient in the fields of the tags type. Not very recommended to build a term-facet in terms of "War and Peace"
- range — facets by range of numeric fields and date. You can make a facet: count me all the products with a price from 0 to 100 and from 100 to 200
- histogram is the same range-requests, only ranges are set automatically, the split step is indicated. Works on numeric fields and date. Do not make a histogram in increments of 1 millisecond for 100 years
Combining facets and full-text queries, you can get many different samples.
Analytics in ES 1.0 - new school!
As you noticed, facets in ES to version 1.0 just returned the number of documents. Requests were rather flat (no nesting). But what if we want to get posts about the iPhone over the years, and then calculate the average rating of these posts?
In ES 1.0, this became possible thanks to the Aggregation framework.
There are two types of aggergation:
Bucket - which count the number of documents found, as well as add the id of the found documents into the “basket”. For example, the above facet requests like term, range, histogram are Bucket-aggregates. Now they do not just count the number of documents, for example, by terms in the tag field, but also give out lists of these documents: 7 documents with the “bug” tag, these documents id 2,5,6,10,17,19,20
Calc - which count only a number. For example, the average value of a numerical field, minima, maxima, sums.
Bucket-units knowingly return the id of the found documents. The fact is that now you can build a chain of aggregates. For example, the first unit we break all the documents by year, then we find the distribution of tags by year.
In order not to beat around the bush, back to our test data. Let's find the most boring tag posts about iPhone broken down by year. In other words, we’ll find all the articles about Iphone, split the sample by years, and see which tags are in the articles with the lowest rating. Then we forbid authors to write articles on this topic. Request such:
- We limit the selection of posts that contain the iPhone in the title
- we make histogram-bucklet-facets by year
- using the received “baskets”, we make term-bucklet-facets by tags.
- on the received "baskets" (with tags) we do Average-aggregation by rating
- Since we need only the most boring tags, we will sort them by the value obtained in the nested aggregation (average rating).
{ "query": { "wildcard": { "title": "iphone" } }, "aggs": { "post_over_time_agg": { "date_histogram": { "field": "postDate", "interval": "year" }, "aggs": { "tags_agg": { "terms": { "field": "tags", "size": 1, "order": { "avg_rating_agg": "asc" } }, "aggs": { "avg_rating_agg": { "avg": { "field": "rank" } } } } } } } } Answer:
"aggregations": { "post_over_time_agg": { "buckets": [ { "key": 1293840000000, "doc_count": 2, "tags_agg": { "buckets": [ { "key": "", "doc_count": 1, "avg_rating_agg": { "value": 14.0 } } ] } }, { "key": 1325376000000, "doc_count": 4, "tags_agg": { "buckets": [ { "key": "", "doc_count": 1, "avg_rating_agg": { "value": 34.0 } } ] } }, { "key": 1356998400000, "doc_count": 2, "tags_agg": { "buckets": [ { "key": "", "doc_count": 2, "avg_rating_agg": { "value": 41.0 } } ] } }, { "key": 1388534400000, "doc_count": 2, "tags_agg": { "buckets": [ { "key": "", "doc_count": 1, "avg_rating_agg": { "value": 23.0 } } ] } } ] } } As you can see, in 2011 and 2012, people got posts about iPhone explosions, in 2013 about new applications, and in 2014 about bugs.
To real problems
The standard task of an online store is to calculate the effectiveness of an advertising campaign or analyze the behavior of a group of users. Imagine that you push all the logs of your http-server in ElasticSearch, while adding to the document some more of your data that you have stored, for example, in Bitrix
{ "url": "http://myshop.com/purchase/confirmed", "date": "2014-02-15T11:12:12", "agent": "Chrome/32.0.1667.0", "geo": "", "utm_source": "super_banner", "userRegisterDate": "2011-02-15T11:12:12", "orderPrice": 4000, "orderCategory": [" ",""] } At the same time the scheme of the document is not fixed. There is an order on this page - they added an orderPrice , no - they did not.
With just such logs, you can already have a lot of things that Google Anallytics can do.
Example 1: To make a cohort analysis, for example, split users by registration date and see how many orders were made by them 2 months after registration, calculate the average amount of the order. Here is how a logical query to ElasticSearch looks like:
- make a text request by url of the word "purchase / confirmed"
- we make date_histogram-facets by the date of user registration
- we make the date_range-facet with the initial value of the range “user registration date” (it can be accessed in the request) and end + 2 months
- we do count and average across the field orderPrice in the received bucklet
Example 2: Track goals and conversions by channel by date. For example, the goal is to visit the URL / purchase / confirmed
Request:
- make a text request by url of the word "purchase / confirmed"
- we make the date_histogram facet by the date of the urla visit, broken down into 1 day
- make term-facet by utm_source
- do count aggregation
findings
The combination of full-text search and chains of aggregations (facets), flexible document layout, automatic scalability and ease of setup and launch make ElasticSearch a serious player in the market for analytical systems.
I also add that the threshold of entry is very low. Installation in 5 minutes, then you can play even with curl, even though a plugin for Chrome that can generate http requests. We have http://indexisto.com/ now a cluster of 7 cars shows itself surprisingly stable.
All possibilities of aggregation are described here https://github.com/elasticsearch/elasticsearch/issues/3300
Source: https://habr.com/ru/post/213849/
All Articles