Navigation from the inside
I always wonder how a thing works, be it a smart watch , a smartphone or an Atari 2600 . Do you know how your navigator paves the route? I decided to find out how this system works from the inside using the example of one hardware and software manufacturer.

It does not always make sense to reinvent the wheel. So it was judged in Shturmann and, instead of creating an engine for the navigation program and drawing maps from scratch, they used the development of BeNomad and the cartography from HERE. At the same company, they developed information content, an interface library and a user interface built on its basis, a system of automatic updates for WinCE, and so on. As a result, the user receives the final product.
')
The main partner and content provider, Yandex.Probki, has to do a lot of manipulations with the data obtained from it.
If users only needed a map from a navigator, they could use a thick atlas of Russian roads. The main thing in the navigation program is precisely the laying of the optimal route. Routing is constantly and continuously optimized and configured to produce each time the closest to the ideal result.
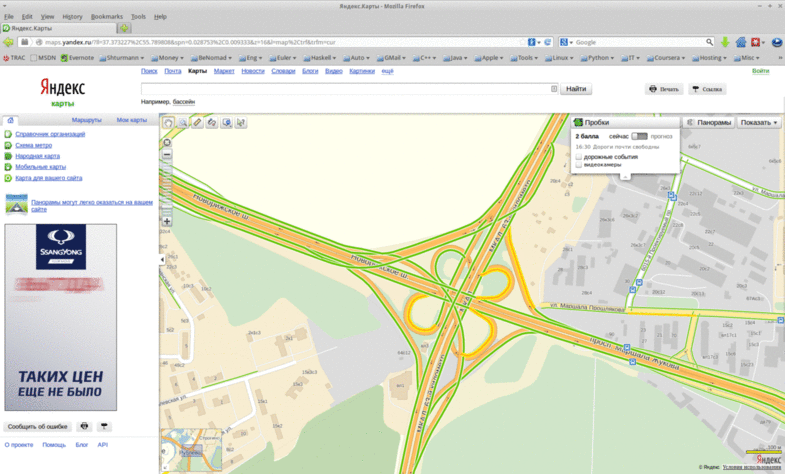
The route in the online version is laid using cartography and data on traffic jams, which are taken from Yandex.Probok. From the first, everything is clear - there is a regularly updated HERE cartography. But there are difficulties with traffic jams: they come in the form of points with 4 main characteristics: ID, speed, direction and color. This set of points must be properly put on the map.

In addition, it is important to somehow pack the data that comes from Yandex, so that they can be unpacked quickly and without problems even on slow devices - the method was developed in Shturmann. In addition, they implemented a resume when the connection was broken.
At the moment there are three commercial releases: for navigators on WinCE and two mobile versions - under Android OS and under iOS. In the future - the completion of the development version under WinPhone. There are also desktop versions for Windows and Linux that developers use. Moreover, the Shturmann version for Linux formed the basis for joint projects with Marussia and Luxoft.
The navigation program was originally written in such a way that it could be easily ported to any platform with a normal C ++ compiler. Today, these are Android OS, iOS, Mac OS, Linux, WinCE, Windows (desktop).
Thus, program versions for different platforms are developed in parallel. However, in the development of mobile applications there are features that must be considered when writing versions: for example, the map manager in Shturmann navigation is written in Java specifically for Android.

Tverskaya, rush hour. You can drive around the lanes, which are exactly known that 5 of them are, and there is no data about the 6th. But this does not mean that the lane is free, it can mean a lack of data: closed traffic, parked cars in two rows on a narrow street - any other impossibility of passage.
The program builds a route, giving preference to those roads about which information is more.
In cartography, roads are divided into different categories. Data about each road contains various indicators, including the average speed on it, the length of the road and a lot of other information. If you do not take into account traffic jams, the route is laid out taking into account the average speed and using the coefficients that determine the different categories of roads. These factors also depend on the season.
The program works with numbers, therefore, in order for it to build a route, given traffic jams, it is not enough for it to obtain data on traffic jams, scored in points (like in Yandex).
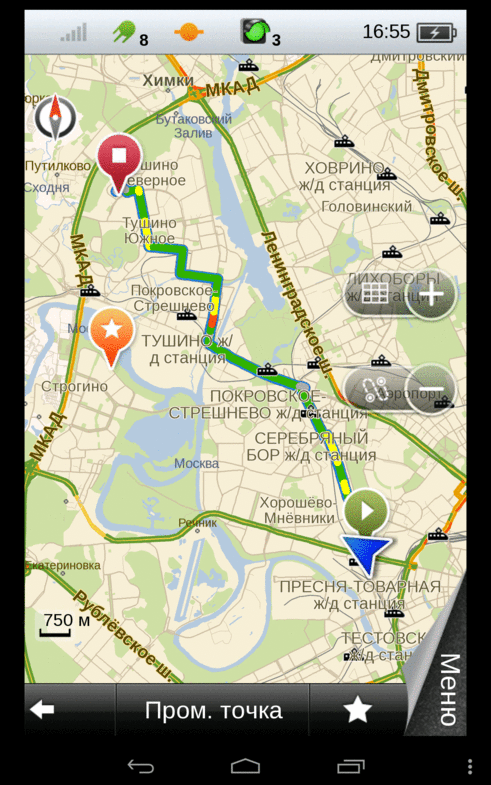
Traffic jams, entering the navigation from the server, have the form of arcs - road sections. At each such arc, you can determine the average speed of movement. To construct the routes (taking into account these data), arc elongation factors are set. The more loaded the road, the stronger the arc is. And the lower the chances that the program will lead the user to traffic.
For example, the average speed on the notorious Tverskaya without traffic jams is 50 km / h. And suddenly a traffic jam comes at a speed of 10 km / h. Does this mean that it is necessary to proportionally increase the coefficient of 5 times? The answer is no. The fact is that, in addition to the coefficients, there are coefficients that are used depending on the route, seasonality and many other factors.
Of course, the program is experiencing a "green" roads. If the route is laid from point A to point B along two equivalent roads with an average speed of 50 km / h, but one has a traffic jam of 40 km / h, and there is no information about the other, the program will drive through the “traffic jam” because it interprets the second option as not reliable enough. Although algorithms sometimes use other factors.


Even at the same speed on the plot color may be different. In other words, 15 km / h on the Moscow Ring Road and 15 km / h in some central Moscow lane are two big differences. In one case, the traffic jam will be red, in the other, yellow - and all because different speed ranges are used.
Another clear example: under construction junction. The overlap of roads is taken into account using data from Yandex. Burgundy (or brown) color in Yandex means that the road is “worth”. The program takes into account the colors of the arcs and does not lead the user to burgundy, for example, routes.

Work on routing is regular. First, the speed of the roads may change with each mapping update. Secondly, the data from Yandex also change its range - this must be taken into account. And among other things, seasonality plays a significant role: in the summer to drive more freely, higher road to the big roads, in the winter, the navigator sends to detours, which the driver can not guess, and then can begin to use them regularly. If he likes it.
When laying the route takes into account a lot of data:
- the number of left turns;
- the number of possible turns (if the driver accidentally or deliberately turned out of the way, the program will not immediately send it back, but will re-route the route, making the ride more relaxed. This is especially true for megalopolises: it’s harder to turn around than driving 500 meters to the nearest traffic light);
- the number of traffic lights and accidents.
In fact, information about traffic jams - this is the summary data, so it was decided not to overload the cards and not distract drivers with unnecessary information. On the map there are traffic lights and complicated turns, the user receives the rest in the final format of traffic jams.
It is very interesting that the program received the possibility of machine learning based on user preferences: a client-server solution is implemented to find the optimal transition rates from traffic jams to arc lengthening, which analyzes route history received from user groups and offers the optimal set of coefficients for routing to period of time (day, evening, etc.).
It is interesting:
Smart City at Mobile World Congress 2014
Mobile Internet tariffs without monthly fees

It does not always make sense to reinvent the wheel. So it was judged in Shturmann and, instead of creating an engine for the navigation program and drawing maps from scratch, they used the development of BeNomad and the cartography from HERE. At the same company, they developed information content, an interface library and a user interface built on its basis, a system of automatic updates for WinCE, and so on. As a result, the user receives the final product.
')
The main partner and content provider, Yandex.Probki, has to do a lot of manipulations with the data obtained from it.
If users only needed a map from a navigator, they could use a thick atlas of Russian roads. The main thing in the navigation program is precisely the laying of the optimal route. Routing is constantly and continuously optimized and configured to produce each time the closest to the ideal result.
The route in the online version is laid using cartography and data on traffic jams, which are taken from Yandex.Probok. From the first, everything is clear - there is a regularly updated HERE cartography. But there are difficulties with traffic jams: they come in the form of points with 4 main characteristics: ID, speed, direction and color. This set of points must be properly put on the map.

In addition, it is important to somehow pack the data that comes from Yandex, so that they can be unpacked quickly and without problems even on slow devices - the method was developed in Shturmann. In addition, they implemented a resume when the connection was broken.
Cross platform
At the moment there are three commercial releases: for navigators on WinCE and two mobile versions - under Android OS and under iOS. In the future - the completion of the development version under WinPhone. There are also desktop versions for Windows and Linux that developers use. Moreover, the Shturmann version for Linux formed the basis for joint projects with Marussia and Luxoft.
The navigation program was originally written in such a way that it could be easily ported to any platform with a normal C ++ compiler. Today, these are Android OS, iOS, Mac OS, Linux, WinCE, Windows (desktop).
Thus, program versions for different platforms are developed in parallel. However, in the development of mobile applications there are features that must be considered when writing versions: for example, the map manager in Shturmann navigation is written in Java specifically for Android.

Route Example
Tverskaya, rush hour. You can drive around the lanes, which are exactly known that 5 of them are, and there is no data about the 6th. But this does not mean that the lane is free, it can mean a lack of data: closed traffic, parked cars in two rows on a narrow street - any other impossibility of passage.
The program builds a route, giving preference to those roads about which information is more.
How does the program determine the route?
In cartography, roads are divided into different categories. Data about each road contains various indicators, including the average speed on it, the length of the road and a lot of other information. If you do not take into account traffic jams, the route is laid out taking into account the average speed and using the coefficients that determine the different categories of roads. These factors also depend on the season.
The program works with numbers, therefore, in order for it to build a route, given traffic jams, it is not enough for it to obtain data on traffic jams, scored in points (like in Yandex).
Traffic jams, entering the navigation from the server, have the form of arcs - road sections. At each such arc, you can determine the average speed of movement. To construct the routes (taking into account these data), arc elongation factors are set. The more loaded the road, the stronger the arc is. And the lower the chances that the program will lead the user to traffic.
For example, the average speed on the notorious Tverskaya without traffic jams is 50 km / h. And suddenly a traffic jam comes at a speed of 10 km / h. Does this mean that it is necessary to proportionally increase the coefficient of 5 times? The answer is no. The fact is that, in addition to the coefficients, there are coefficients that are used depending on the route, seasonality and many other factors.
Of course, the program is experiencing a "green" roads. If the route is laid from point A to point B along two equivalent roads with an average speed of 50 km / h, but one has a traffic jam of 40 km / h, and there is no information about the other, the program will drive through the “traffic jam” because it interprets the second option as not reliable enough. Although algorithms sometimes use other factors.


Multicolored cork
Even at the same speed on the plot color may be different. In other words, 15 km / h on the Moscow Ring Road and 15 km / h in some central Moscow lane are two big differences. In one case, the traffic jam will be red, in the other, yellow - and all because different speed ranges are used.
Another clear example: under construction junction. The overlap of roads is taken into account using data from Yandex. Burgundy (or brown) color in Yandex means that the road is “worth”. The program takes into account the colors of the arcs and does not lead the user to burgundy, for example, routes.

Work, work and work on routes again
Work on routing is regular. First, the speed of the roads may change with each mapping update. Secondly, the data from Yandex also change its range - this must be taken into account. And among other things, seasonality plays a significant role: in the summer to drive more freely, higher road to the big roads, in the winter, the navigator sends to detours, which the driver can not guess, and then can begin to use them regularly. If he likes it.
When laying the route takes into account a lot of data:
- the number of left turns;
- the number of possible turns (if the driver accidentally or deliberately turned out of the way, the program will not immediately send it back, but will re-route the route, making the ride more relaxed. This is especially true for megalopolises: it’s harder to turn around than driving 500 meters to the nearest traffic light);
- the number of traffic lights and accidents.
In fact, information about traffic jams - this is the summary data, so it was decided not to overload the cards and not distract drivers with unnecessary information. On the map there are traffic lights and complicated turns, the user receives the rest in the final format of traffic jams.
Coefficients
It is very interesting that the program received the possibility of machine learning based on user preferences: a client-server solution is implemented to find the optimal transition rates from traffic jams to arc lengthening, which analyzes route history received from user groups and offers the optimal set of coefficients for routing to period of time (day, evening, etc.).
It is interesting:
Smart City at Mobile World Congress 2014
Mobile Internet tariffs without monthly fees
Source: https://habr.com/ru/post/213145/
All Articles