The new interface Yandex.Metro and technology with which it works
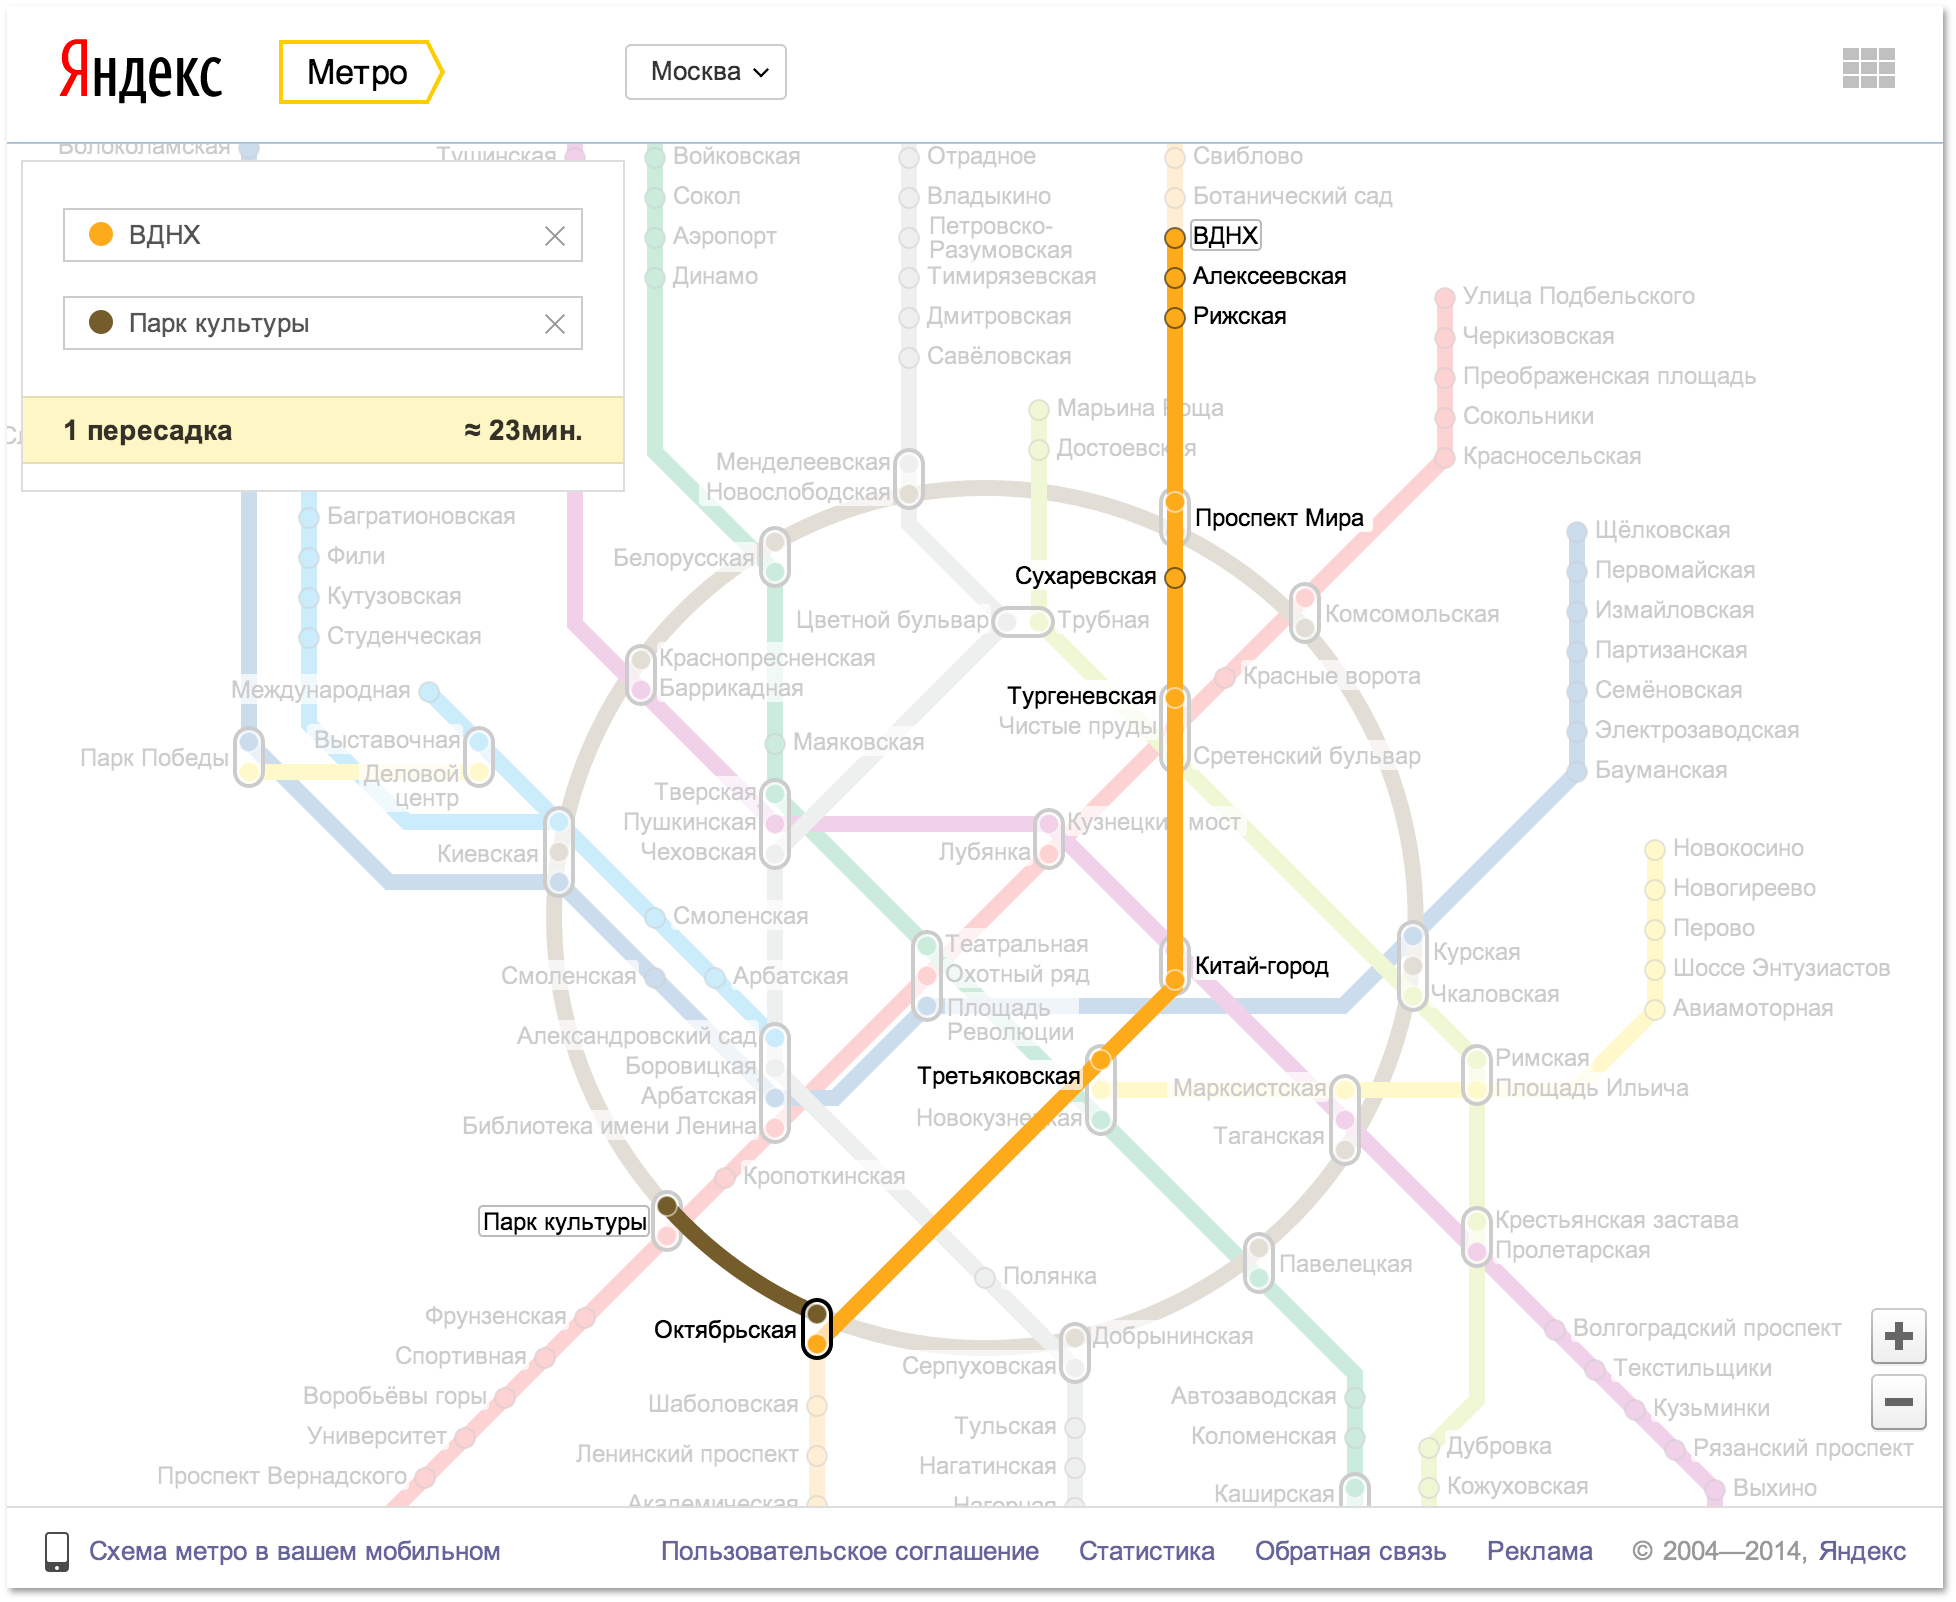
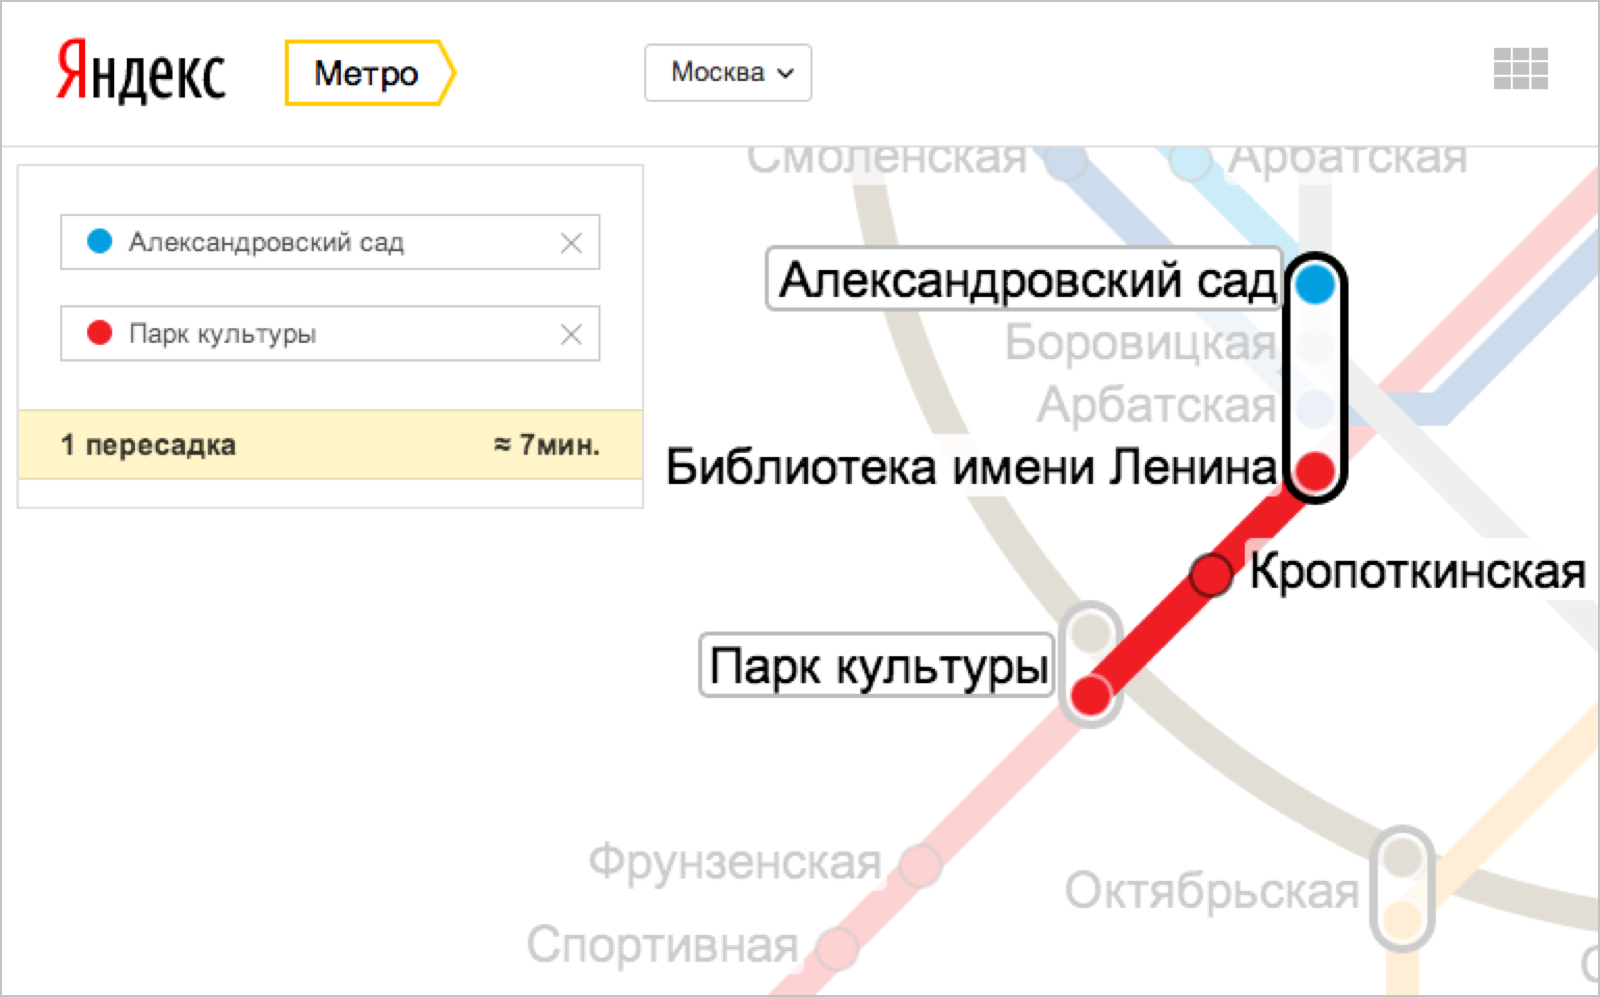
Today we launched a new version of the web interface for the Yandex.Metro service . Now in the new "island" design available subway schemes of five cities. But we have updated not only the visual part, but also transferred all the logic from the server side to the client side.
In this post we would like to tell exactly how we did it, what decisions we chose and why.
The Yandex.Metro service was launched back in 2007. Since then, the web interface has hardly evolved, the design looked frankly outdated. Venerable service age affected the technical side. All schemes were sets of GIF images, on which objects were placed using coordinates. Because of this, there were difficulties with updating the graph, it was impossible to independently make changes to the scheme (it was necessary to involve outsourcers, to order pictures from them). Since the names of the stations were also embedded in the images, localization of the schemes would require the generation of complete sets of GIF images.
None of the server-side developers are currently working on this service, and it is very poorly documented. So the backend of the old Yandex.Metro is in some way a black box that knew how to accept parameters and return routes. However, it was extremely difficult to maintain him. The service definitely required an update, and the main question was how to get it closer in terms of technology to mobile applications.
')
It cannot be said that Yandex.Metro was completely abandoned, it has a fairly wide audience. About 220 thousand people visit the web interface daily, the Android application has been downloaded 3 million times, and 1 million downloads for iOS. It is worth noting that mobile applications were developed somewhat later than the web version, and are devoid of most of its shortcomings.
When developing it was necessary to take into account several important changes that have occurred since the launch of Metro:
To play the graph were used the same data as for mobile applications. They already had a database of XML-files, each of which contained one scheme and data on the connectedness of the graph. It will also simplify localization: in the near future, all schemes will be translated into different languages.
At the very beginning of development, the question arose of which technology to use for drawing the scheme: canvas, SVG, or CSS3. We also considered the method of drawing through the visualization library RaphaelJS. This library draws in SVG, but if it detects IE8, rendering takes place in VML, which ensures maximum cross-browser compatibility.
At first, three prototype schemes were written on the basis of the XML files: on canvas, SVG and RaphaelJS. All three options were driven through benchmarks. According to the results, the SVG variant turned out to be the fastest, followed by canvas with a not very significant lag, and the one based on RaphaelJS was the slowest. Too much time is spent on loading and executing code that checks which functions are available in your browser. On one hundred iterations of rendering, we obtained the following results in Chrome and Firefox, respectively:
Thus, the final choice was between canvas and SVG. Canvas has its advantages, but for drawing vector schemes, SVG is better suited. The fact is that SVG elements fit well into the DOM page. So, you can refer to them as ordinary DOM nodes with a familiar interface, catch events, etc. In addition, in the vector format there is no need to redraw the scheme when changing the scale.
To be able to allocate routes in the scheme, it was necessary to divide it into layers. The bottom layer is for static objects that help you navigate. In future versions, rivers and other noticeable landscape elements will be displayed there. The whole circuit is drawn on the middle layer. The topmost layer is the route layer. To be able to select it, there is one more layer between it and the layer of the general scheme: connecting it, we provide the blurriness of the general scheme.

Later, for convenience of development and assignment of CSS styles, the layer with the general scheme was divided into three: with districts, stations and transitions.
The new scheme has indisputable advantages: it is vector, it can be scaled without writing additional code, it is easier to maintain and add additional features. Unfortunately, changes to the schema are still made manually through XML files, but even this is simpler than it was in the original version.
The entire logic of laying routes in the old version of Metro was executed on the server side. For each user action a request was sent to the server, a new version was calculated there and a response was sent. For the calculations, Dijkstra's algorithm was used with minor modifications to support searching for several routes, for example, you can chop off the last edge and continue searching for paths.
Approximately the same algorithm was used when creating mobile applications, but since they were developed a little later, they used more modern technologies and approaches. There, all the logic has already been transferred to the client part. In the iOS version, the graph is represented as an adjacency matrix, and the Android client implements an object-oriented model. The stations are presented in the form of JS-objects, each of which has an array of links - spans. These compounds are also objects.
When choosing the basis for the web interface, both options were considered. But the model from the Android application seemed to us more optimal.
For each request, the router returns about 30 routes. Relevant of them are very few - no more than 10%. But the problem is that many users have a different understanding of the “best route”. Some prefer speed and some prefer comfort. A girl in high heels will be ready to spend the extra 10 minutes so as not to go on a long transition, but for a person who is late for the plane, this difference will be critical. This means that routes need to be evaluated according to different criteria.
In order not to complicate the whole system, special filters were developed: a class of objects whose interface consists of one method that performs one simple action. Composite filters have also been added that contain multiple filters. They are applied to the route array according to the order specified by the developer.
Now filtering is rendered in a separate module. This will allow us in the near future to unify the filtering process on all platforms. Thus, the choice of route will not depend on the device from which the request is entered.
In the development of MVC, we took advantage of the existing developments in Yandex: the JS libraries responsible for island design, logic, data storage, and notifying components about user actions and state changes.
Immediately after the launch of a new version of the service, we plan to bring our scheme into line with the official one. Next, we will introduce some features that are already in mobile applications. For example, information about which car is the most convenient to make a transfer. We also implement the features already inherent in the architecture: the ability to select routes and the translation of schemes into several languages. In addition, plans to develop a visual tool for making changes to the scheme. So far, any changes are made by editing the xml-files. If a visual editor appears, one content manager will be able to promptly make changes for all platforms simultaneously.
In this post we would like to tell exactly how we did it, what decisions we chose and why.
The Yandex.Metro service was launched back in 2007. Since then, the web interface has hardly evolved, the design looked frankly outdated. Venerable service age affected the technical side. All schemes were sets of GIF images, on which objects were placed using coordinates. Because of this, there were difficulties with updating the graph, it was impossible to independently make changes to the scheme (it was necessary to involve outsourcers, to order pictures from them). Since the names of the stations were also embedded in the images, localization of the schemes would require the generation of complete sets of GIF images.
None of the server-side developers are currently working on this service, and it is very poorly documented. So the backend of the old Yandex.Metro is in some way a black box that knew how to accept parameters and return routes. However, it was extremely difficult to maintain him. The service definitely required an update, and the main question was how to get it closer in terms of technology to mobile applications.
')
It cannot be said that Yandex.Metro was completely abandoned, it has a fairly wide audience. About 220 thousand people visit the web interface daily, the Android application has been downloaded 3 million times, and 1 million downloads for iOS. It is worth noting that mobile applications were developed somewhat later than the web version, and are devoid of most of its shortcomings.
When developing it was necessary to take into account several important changes that have occurred since the launch of Metro:
- Visualization technologies in browsers have gone a long way; rendering a map on the client side is no longer a problem.
- The performance of JavaScript engines has greatly improved. Many tasks that previously could only be done on the server are now quite feasible on the client side.
- The share of obsolete browsers has decreased. IE6 and IE8 almost never occur, which means there is no reason to use GIF.
How the new version was developed
To play the graph were used the same data as for mobile applications. They already had a database of XML-files, each of which contained one scheme and data on the connectedness of the graph. It will also simplify localization: in the near future, all schemes will be translated into different languages.
At the very beginning of development, the question arose of which technology to use for drawing the scheme: canvas, SVG, or CSS3. We also considered the method of drawing through the visualization library RaphaelJS. This library draws in SVG, but if it detects IE8, rendering takes place in VML, which ensures maximum cross-browser compatibility.
At first, three prototype schemes were written on the basis of the XML files: on canvas, SVG and RaphaelJS. All three options were driven through benchmarks. According to the results, the SVG variant turned out to be the fastest, followed by canvas with a not very significant lag, and the one based on RaphaelJS was the slowest. Too much time is spent on loading and executing code that checks which functions are available in your browser. On one hundred iterations of rendering, we obtained the following results in Chrome and Firefox, respectively:
| technology | time_to_download | time_to_draw | overall_time |
| canvas | 34.58 ms | 181.72 ms | 216.30 ms |
| svg | 28.02 ms | 74.02 ms | 102.07 ms |
| svg-raphael | 45.87 ms | 1147.58 ms | 1193.45 ms |
| technology | time_to_download | time_to_draw | overall_time |
| canvas | 55.26 ms | 769.16 ms | 824.42 ms |
| svg | 102.60 ms | 136.51 ms | 239.11 ms |
| svg-raphael | 148.40 ms | 2369.88 ms | 2518.28 ms |
Thus, the final choice was between canvas and SVG. Canvas has its advantages, but for drawing vector schemes, SVG is better suited. The fact is that SVG elements fit well into the DOM page. So, you can refer to them as ordinary DOM nodes with a familiar interface, catch events, etc. In addition, in the vector format there is no need to redraw the scheme when changing the scale.
To be able to allocate routes in the scheme, it was necessary to divide it into layers. The bottom layer is for static objects that help you navigate. In future versions, rivers and other noticeable landscape elements will be displayed there. The whole circuit is drawn on the middle layer. The topmost layer is the route layer. To be able to select it, there is one more layer between it and the layer of the general scheme: connecting it, we provide the blurriness of the general scheme.
Later, for convenience of development and assignment of CSS styles, the layer with the general scheme was divided into three: with districts, stations and transitions.
The new scheme has indisputable advantages: it is vector, it can be scaled without writing additional code, it is easier to maintain and add additional features. Unfortunately, changes to the schema are still made manually through XML files, but even this is simpler than it was in the original version.
Search paths on the graph
The entire logic of laying routes in the old version of Metro was executed on the server side. For each user action a request was sent to the server, a new version was calculated there and a response was sent. For the calculations, Dijkstra's algorithm was used with minor modifications to support searching for several routes, for example, you can chop off the last edge and continue searching for paths.
Approximately the same algorithm was used when creating mobile applications, but since they were developed a little later, they used more modern technologies and approaches. There, all the logic has already been transferred to the client part. In the iOS version, the graph is represented as an adjacency matrix, and the Android client implements an object-oriented model. The stations are presented in the form of JS-objects, each of which has an array of links - spans. These compounds are also objects.
When choosing the basis for the web interface, both options were considered. But the model from the Android application seemed to us more optimal.
Filtering Search Results
For each request, the router returns about 30 routes. Relevant of them are very few - no more than 10%. But the problem is that many users have a different understanding of the “best route”. Some prefer speed and some prefer comfort. A girl in high heels will be ready to spend the extra 10 minutes so as not to go on a long transition, but for a person who is late for the plane, this difference will be critical. This means that routes need to be evaluated according to different criteria.
In order not to complicate the whole system, special filters were developed: a class of objects whose interface consists of one method that performs one simple action. Composite filters have also been added that contain multiple filters. They are applied to the route array according to the order specified by the developer.
Now filtering is rendered in a separate module. This will allow us in the near future to unify the filtering process on all platforms. Thus, the choice of route will not depend on the device from which the request is entered.
Client Application Architecture
In the development of MVC, we took advantage of the existing developments in Yandex: the JS libraries responsible for island design, logic, data storage, and notifying components about user actions and state changes.
Plans
Immediately after the launch of a new version of the service, we plan to bring our scheme into line with the official one. Next, we will introduce some features that are already in mobile applications. For example, information about which car is the most convenient to make a transfer. We also implement the features already inherent in the architecture: the ability to select routes and the translation of schemes into several languages. In addition, plans to develop a visual tool for making changes to the scheme. So far, any changes are made by editing the xml-files. If a visual editor appears, one content manager will be able to promptly make changes for all platforms simultaneously.
Source: https://habr.com/ru/post/213033/
All Articles