Analysis of application performance as a separate direction in IT
Good afternoon, my name is Daniel, and for more than five years I have been working in the service of global technical support of IT infrastructure of a large international company. The idea of separating the analysis of application performance into a separate area came to me about two years ago and now I am at the stage when it is already possible to sum up the first results of work. The main reason that prompts me to write this article is the desire to get constructive feedback from outside (including from respected visitors to this resource), in order to use them to adjust the development course of this area in the future.
The theme of application performance management [1] (more general regarding its analysis) is quite popular nowadays. Many large companies are aware or close to the realization of the importance of the development of this direction. However, the issue of practical implementation and evaluation of the effectiveness of the efforts made is far from simple. Even the wording itself, which is “optimal performance” for each specific application or service, is not an easy task with fuzzy conditions and a conclusion. Also, today there is no any reliable way to measure the financial efficiency of investments in this area. The only thing that can be relied upon in the development of this field is common sense, applied in each particular case. All these questions are well reflected in the global study of the company Enterprise Management Associates [2].
Let us examine a typical example. There is some important application in the organization. Business imposes stringent requirements on the availability of this application, since every hour of inactivity leads to quite tangible losses. The corresponding SLA agreement is signed. The IT department establishes continuous automatic availability monitoring when a specific device regularly polls its user interface, sending a simple request and waiting for a typical response. If there is no response, an automatic incident is created, which is resolved by the appropriate support teams. Can we say that the IT department performs its work and provides support for the interests of the business in full? Not sure.
One day, users discover that the application starts up pretty quickly, but its key operations are extremely slow. Automatic monitoring "silent" and we are very lucky if there is at least one of the users who pick up the phone and call technical support before this problem leads to significant losses. My practice shows that, as a rule, users do not report such problems. There are many reasons, from the banal reluctance to call somewhere and explain difficult and subjective symptoms to a lack of confidence in the local support service. It happens that such problems last for years, causing hidden damage to business, spoiling people's nerves and significantly undermining the reputation of the IT department. Sometimes they will find out about a problem if losses from poor system performance become too obvious and get into the focus of business leadership. Next begins a rather fascinating story. IT senior management requires their subordinates to immediately eliminate the problem. A round table is gathered from representatives of individual teams, each checks the part of the infrastructure entrusted to him and everyone comes to a remarkable conclusion - “everything is fine with us!”. Servers are OK - neither the CPU nor the memory is overloaded. The network is fine - there are no packet losses, the communication lines are not overloaded. The client part should also be in order - the rest of the applications work fine. The trouble is that when it all comes together in one system, it works terribly, but where to find the root cause? The manufacturer of the program also does not really help, citing the fact that other customers do not complain, and points to "some problems in the infrastructure." Then one of the following usually happens (sometimes in combination):
The IT department can save face only in the latter case, but what happens exactly, alas, there are no guarantees. In addition, it is completely incomprehensible how to motivate people to work beyond their immediate responsibility and maintain transparency and manageability in the industry.
')
The company's management supported my initiative to highlight the analysis of application performance in a separate area. This gave me the opportunity on an official basis to develop it in accordance with the needs of our organization and to do what I can do best - to conduct a cross-technological analysis of various systems operating in our enterprise. Now let's see what this area is in our understanding.
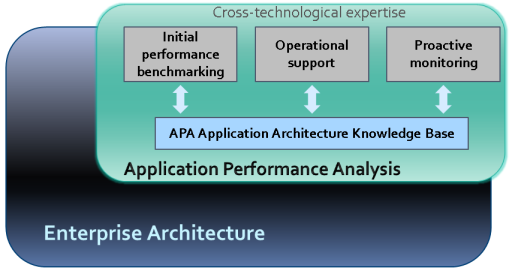
We have assigned the following functions to the scope of application performance analysis (hereinafter referred to as APA or Application Performance Analysis) (in accordance with the available tools and skills):
Picture 1
One of the main tools of APA is the knowledge base, which reflects the functional purpose, architecture, and related incidents of all applications that have been in the focus of attention of APA. It helps not to do the same job twice (especially if there are several specialists in the team). We can say that this database makes APA domain more similar to the more general area of Enterprise Architecture [3], namely, its technical branch. In order not to create excessive expectations, we immediately define the clear boundaries of the area of responsibility:
The essence of the work of the APA area is reflected in its logo (see Fig. 2). The lighthouse only helps to determine the right course, but the choice of the route is always on the conscience of the captain.

Figure 2
The main niche of APA among other services can be defined by the following formulations:
In terms of ITIL, we can say that we take the area of Performance Management beyond the traditional understanding of the area of Capacity Management, to which it formally refers [4].
It can be seen from the above that APA plays an important role in the process of managing application performance, but does not replace it completely. This is a kind of centralization and unification of its most complex components - monitoring and analysis, but the issues of the direct management of applications remain with the respective teams. Here they are more efficient: it is easier for them to establish individual contact with the software manufacturer, they are most interested in the success of their service or application. APA is only a tool that covers the most difficult area, everything else is solved by standard procedures.
An APA specialist analyzes network traffic to determine the causes of performance problems. The network is a universal environment that combines various architectural components of applications and in most cases the analysis of network transactions provides the necessary and sufficient information to find the faulty element. However, this method has its limitations. For example, we can see that this server introduces the greatest delay in the execution of a user operation, and we can even select the most problematic call, for example, a GET or POST request when loading a web page and a corresponding SQL long query to the database. But what is happening inside the server at this time remains behind the scenes. Moreover, if for some reason the database server was combined with the application server within the same host, then it is almost impossible to separate their influence by the total execution time of the operation by this method. Fortunately, in most cases the use of this method brings good results. From my practice, I can say that about 99% of calls to me are resolved successfully. In this case, the information obtained by the APA service is key.
There are a lot of software and hardware on the market today that helps manage application performance. We use two main tools: one for detailed study of pre-recorded transactions, the other for continuous monitoring of application performance by decoding and analyzing their network traffic.
Now let's take a closer look at the methods for implementing individual APA directions.
The key to success in the operational support of application performance is a clear formalization of each incident. The user, as a rule, describes the problem subjectively and often very emotionally. At the first stage it is very important to separate the emotional component (too strong coffee, bad mood or dislike for any application) from the direct definition of the problem. For this, I created a special list of questions that the user must answer during the creation of the incident. It is important to note that APA does not involve direct work with users; universal specialists of the first and second level of support receive all the necessary answers. Sometimes, some of the necessary information can be obtained using the automated performance monitoring application.
Further, the team responsible for this application provides me with a fairly complete description of its architecture (what host is responsible for what, and what network transactions between them are expected during the execution of problematic operations). Sometimes incomplete information is given, which is not an insurmountable obstacle to the investigation. Also, I can ask them to install the necessary agents on the client and server side of the application. Agents are used to collect statistical information from network interfaces. They are placed in strict accordance with the instructions and in 99% of cases their installation does not cause any difficulties.
Then, we will coordinate the procedure of direct testing of problem operations: either I reproduce the problem myself according to the instructions or ask the user to do it at my command. At the same time, I activate the writing process on my agents. The resulting material is a set of trace files that were simultaneously recorded during the execution of a problem operation at several observation points. They contain a complete history of network operations on selected hosts. The key advantage of the tool I use for analysis is the ability to merge these files into one time-aligned (i.e., 0 seconds trace file from the client absolutely exactly correspond to 0 seconds in server trace files). This gives me the opportunity to track in time the whole course of the operation - how long the client request went over the network to the application server, how much it spent processing, before sending the required database request, how long the database processed this request, and so on. Let us analyze a specific example.
Here is a fragment of the architecture of the application we are interested in (see Figure 3).
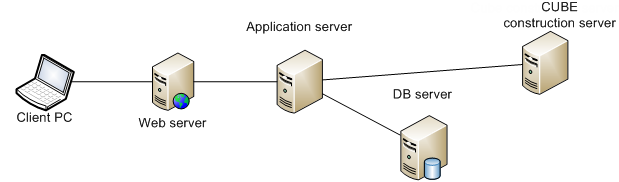
Figure 3
After recording and processing, the problem operation looks as shown in Figure 4:
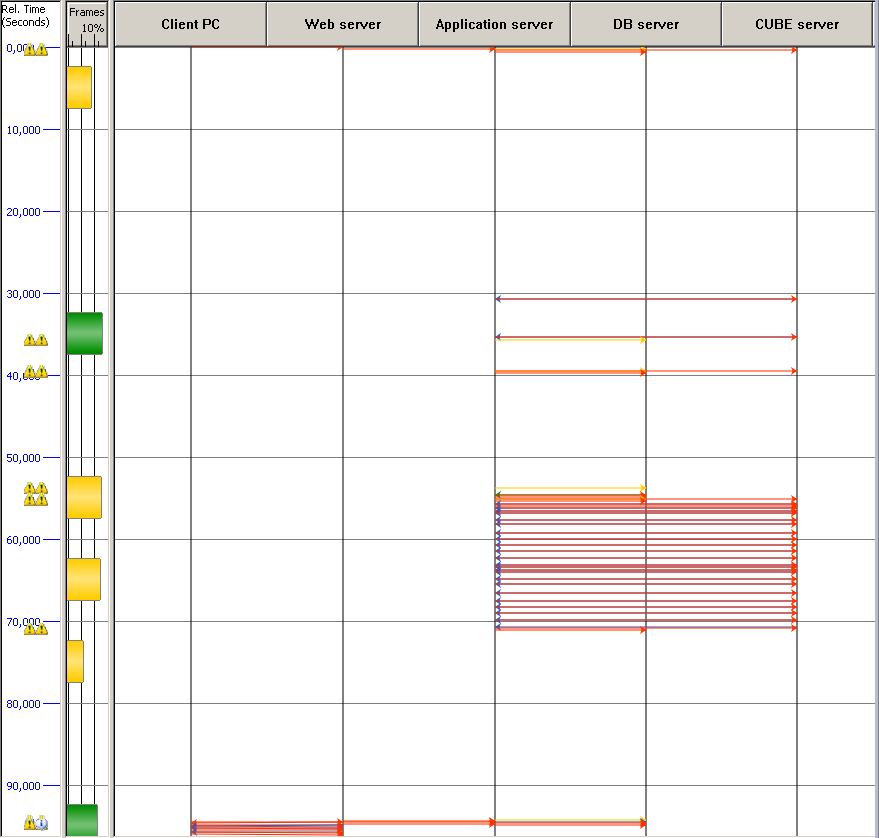
Figure 4
Next, you can determine the effect of each element on the total execution time of the operation (see Figure 5)
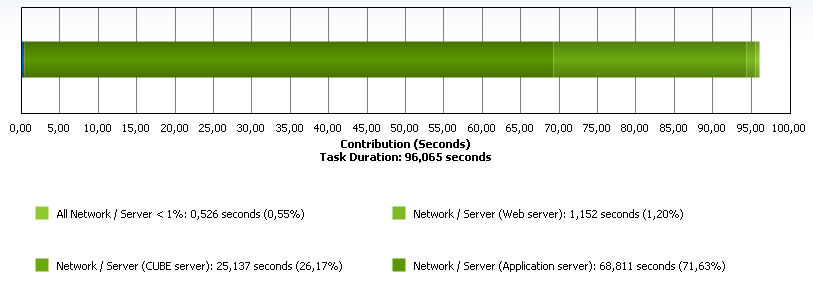
Figure 5
It can be seen that the problem is related to the application server and the CUBE server, but you can figure it out a little deeper. For example, highlight the most problematic challenges (see Fig. 6).

Figure 6
There is a topic for a reasoned conversation with the manufacturer of this software.
It is also important to note that this method is no less effective in investigating functional problems that are not related to performance, in which the support teams are deadlocked.
This activity is entirely based on the methods used in operational support. In addition to them, we also have the ability to mathematically predict what will be the performance of the user interface in different regions for centralized applications.
As mentioned above, it can be very difficult to get an objective assessment of the application's performance from the user. Just because of the subjectivity of the question itself. On the other hand, technical support in its work cannot operate with subjective metrics. This contradiction often leads to the fact that we are trying to fix non-existent or non-essential breakdowns, while the truly important problems are ignored. The main conclusion is that in order to effectively manage the performance of the applications installed in the enterprise, you need to have an independent system of automatic performance monitoring. Relying on users in this matter is pointless.
To resolve this issue, I use the means of continuous monitoring of application performance by decoding and analyzing their network traffic. Here the source of information is the SPAN ports configured on the switches of interest to us. That is, we practically do not interfere in any way with the work of the systems of interest to us, no agents on the servers are needed. The obtained information is collected and filtered on special probe servers and transmitted to the central server. This server is responsible for analyzing and storing the received data, providing a report interface and automatically notifying application performance problems.
This solution not only helps to quickly find out about existing problems, but also often gives a hint where to look for the root cause of their occurrence. Not as thoroughly and precisely as it can be done by means of operational support, but still enough to significantly speed up the investigation process. In addition, we can see long-term trends in application performance, as well as evaluate the effect of changes in infrastructure.
Let me give you a couple of examples of reports that we use.
Overall assessment of the load and performance of the user interface of the application for the last 8 hours (see. Fig. 7)

Figure 7
Here: Operations (left scale) - the total number of operations per measurement interval, divided into “slow operations” and “fast operations” . An operation is considered slow if its execution time exceeds a certain threshold value defined for this interface. Average operation time (right scale) - the average execution time of operations for each measurement interval.
The performance and load of the database server of the same application at the same time is shown in Figure 8.

Figure 8
If you wish, you can determine which SQL queries caused the “Average operation time” jump between 8 30 and 9 00, but there is no special need, since this did not affect the user interface.
There are companies on the market that provide application performance analysis as a service. As far as I could figure out, they do it about the same methods as I do, but various variations and additions are possible. If you are faced with the task of developing this area in your enterprise, the first question to decide is to use external services or develop a service within the company. When I went through this stage, I identified several key factors that helped us make the final decision. I hope you will find them interesting and useful too.
One of the first factors to think about is the price. In the case of an external service, the initial installation cost may be significantly lower than what an internal installation would require. Moreover, it is possible to practically avoid an increase in fixed assets (we are buying the service). If you install everything inside you need to be prepared for some costs - servers, licenses, personnel with its hiring and training, annual maintenance, resources for installing and debugging all this. And the time required for the efforts and costs to be applied to bring benefits can be substantially more if you do everything yourself. These arguments are very significant if we consider the short-term perspective, but over time the balance may change. The service provider is primarily a commercial organization. He, too, needs to cover his expenses for the maintenance of specialists and the maintenance of products and to do it with profit for himself. It may well happen that in the long run, with a more or less dense load, this service will require large expenses if you use the services of third-party companies. I spent a lot of time trying to compare the cost of ownership for each option. It was necessary to make some assumptions, based on existing experience: how many investigations a year should be carried out, how long it takes on average, and how much, in the end, it can cost.
No less important is what we get for this money (quality, volume, and also speed of investigation of critical incidents).
An important feature of the outsource services is that the supplier always works within the framework of its contract. Unlike internal service, he is absolutely not interested in the success of our business. Hence the inflexibility of the supplier in borderline situations. All that is not spelled out in the contract, as a rule, either impossible or very expensive. For example, a complex, critical non-performance incident has occurred. Very often, in such cases, the same tools and methods that are used to analyze performance problems will come to the rescue. The internal APA team will definitely help, but what the third-party provider says is unknown. Formally, this is far beyond the scope of the contract and the usual work for him. And it's not a fact that it will be easy to convince a manager on the other side to help, because he may not understand the technology and many arguments simply won't work for him.
The result of an APA investigation may be a recommendation to substantially change the existing infrastructure. This is done in order not only to resolve the current incident, but also to prevent a similar problem in other applications. It is absolutely not profitable for an external supplier to solve problems that have not yet happened. This is their income. In addition, the level of responsibility for the recommendations provided is quite high, as they often affect the overall strategy for the development of information technology in the enterprise. It is not always reasonable to leave these questions to the discretion of the external company.
No less difficult issue with the speed of investigation of critical incidents. In general, investigating performance problems is a complex area. You can never say in advance how much time it will take to analyze - too many unknown factors. In any case - this is not something that can be reflected in the contract. And how then to be, if you need to urgently understand? The internal division, in one way or another, depends on the success of our business, but the external company does not.
In addition, working with an external supplier implies a certain formalization of requests and the results obtained. And now the question is: are all internal units ready to clearly formulate their requests and can understand exactly what they were told? People often come to me and ask not about what they really need. It turns out that inside we still need someone who will act as an interpreter, who knows the right people within the company and understands how to communicate with an external supplier in his language. At the same time, this role implies the presence of a good technical expertise, which is practically the same as is needed in order to carry out investigations independently.
Consideration of the above arguments led us to the decision to leave APA as an internal service. Of course, in each case the optimal solution may differ. Any arguments are a priori controversial because of the very nature of the issue. I just share my experience.
All of the above is a version of the practical implementation of the process of analyzing and managing the performance of applications in a large enterprise. In our case, it gives a good result. Over the past year, the APA unit has been involved in investigating a number of critical issues and in the vast majority of cases played a key role in determining the root cause. Moreover, in many cases it was difficult to imagine how the errors found could be identified without involving APA methods. Our work is appreciated by management.
[1] en.wikipedia.org/wiki/Application_Performance_Management .
[2] “Retail IT Service Operation: Across a Business Ecosystem” Enterprise Management Associates. 2011
[3] en.wikipedia.org/wiki/Enterprise_architecture_framework
[4] en.wikipedia.org/wiki/Information_Technology_Infrastructure_Library .
Application Performance Management
The theme of application performance management [1] (more general regarding its analysis) is quite popular nowadays. Many large companies are aware or close to the realization of the importance of the development of this direction. However, the issue of practical implementation and evaluation of the effectiveness of the efforts made is far from simple. Even the wording itself, which is “optimal performance” for each specific application or service, is not an easy task with fuzzy conditions and a conclusion. Also, today there is no any reliable way to measure the financial efficiency of investments in this area. The only thing that can be relied upon in the development of this field is common sense, applied in each particular case. All these questions are well reflected in the global study of the company Enterprise Management Associates [2].
Let us examine a typical example. There is some important application in the organization. Business imposes stringent requirements on the availability of this application, since every hour of inactivity leads to quite tangible losses. The corresponding SLA agreement is signed. The IT department establishes continuous automatic availability monitoring when a specific device regularly polls its user interface, sending a simple request and waiting for a typical response. If there is no response, an automatic incident is created, which is resolved by the appropriate support teams. Can we say that the IT department performs its work and provides support for the interests of the business in full? Not sure.
One day, users discover that the application starts up pretty quickly, but its key operations are extremely slow. Automatic monitoring "silent" and we are very lucky if there is at least one of the users who pick up the phone and call technical support before this problem leads to significant losses. My practice shows that, as a rule, users do not report such problems. There are many reasons, from the banal reluctance to call somewhere and explain difficult and subjective symptoms to a lack of confidence in the local support service. It happens that such problems last for years, causing hidden damage to business, spoiling people's nerves and significantly undermining the reputation of the IT department. Sometimes they will find out about a problem if losses from poor system performance become too obvious and get into the focus of business leadership. Next begins a rather fascinating story. IT senior management requires their subordinates to immediately eliminate the problem. A round table is gathered from representatives of individual teams, each checks the part of the infrastructure entrusted to him and everyone comes to a remarkable conclusion - “everything is fine with us!”. Servers are OK - neither the CPU nor the memory is overloaded. The network is fine - there are no packet losses, the communication lines are not overloaded. The client part should also be in order - the rest of the applications work fine. The trouble is that when it all comes together in one system, it works terribly, but where to find the root cause? The manufacturer of the program also does not really help, citing the fact that other customers do not complain, and points to "some problems in the infrastructure." Then one of the following usually happens (sometimes in combination):
- After a long study, they may forget about the problem (the business has reconciled itself to the fact that it will not work faster now), although in the process we spent a lot of money on the chaotic improvement of individual infrastructure elements. Alas, it did not help, but we tried!
- A business cannot come to terms with the poor performance of this system and, seeing the failure of IT departments to solve the problem, hires an external consultant. That one for the big money finds the root cause somewhere at the junction of separate infrastructure elements and technologies, but the reputation of the IT department is thoroughly undermined.
- Someone from internal experts guesses the reason, but acts far beyond the scope of his responsibility.
The IT department can save face only in the latter case, but what happens exactly, alas, there are no guarantees. In addition, it is completely incomprehensible how to motivate people to work beyond their immediate responsibility and maintain transparency and manageability in the industry.
')
Main features of application performance analysis
The company's management supported my initiative to highlight the analysis of application performance in a separate area. This gave me the opportunity on an official basis to develop it in accordance with the needs of our organization and to do what I can do best - to conduct a cross-technological analysis of various systems operating in our enterprise. Now let's see what this area is in our understanding.
We have assigned the following functions to the scope of application performance analysis (hereinafter referred to as APA or Application Performance Analysis) (in accordance with the available tools and skills):
- Initial analysis of the performance and architecture of new applications
- Assist operational support teams in identifying the causes of incidents related to poor application performance
- Automated performance monitoring for key applications
Picture 1
One of the main tools of APA is the knowledge base, which reflects the functional purpose, architecture, and related incidents of all applications that have been in the focus of attention of APA. It helps not to do the same job twice (especially if there are several specialists in the team). We can say that this database makes APA domain more similar to the more general area of Enterprise Architecture [3], namely, its technical branch. In order not to create excessive expectations, we immediately define the clear boundaries of the area of responsibility:
- APA helps implementation teams conduct an initial performance review for new applications, but is not responsible for the comprehensive evaluation of this application. Issues such as functionality, redundancy, fault tolerance, and many others remain beyond the scope of the APA study.
- APA helps support teams identify an issue in an infrastructure or application, but is not responsible for fixing it.
- For application performance monitoring needs, APA provides technical tools and their fine-tuning in accordance with the needs of the customer, but is not responsible for the successful resolution of the identified problems.
The essence of the work of the APA area is reflected in its logo (see Fig. 2). The lighthouse only helps to determine the right course, but the choice of the route is always on the conscience of the captain.
Figure 2
The main niche of APA among other services can be defined by the following formulations:
- Analysis of problems and incidents in which the remaining teams are at a standstill
- Cross-technology expertise
- Preventing application performance incidents
In terms of ITIL, we can say that we take the area of Performance Management beyond the traditional understanding of the area of Capacity Management, to which it formally refers [4].
It can be seen from the above that APA plays an important role in the process of managing application performance, but does not replace it completely. This is a kind of centralization and unification of its most complex components - monitoring and analysis, but the issues of the direct management of applications remain with the respective teams. Here they are more efficient: it is easier for them to establish individual contact with the software manufacturer, they are most interested in the success of their service or application. APA is only a tool that covers the most difficult area, everything else is solved by standard procedures.
Basic methods for analyzing application performance
An APA specialist analyzes network traffic to determine the causes of performance problems. The network is a universal environment that combines various architectural components of applications and in most cases the analysis of network transactions provides the necessary and sufficient information to find the faulty element. However, this method has its limitations. For example, we can see that this server introduces the greatest delay in the execution of a user operation, and we can even select the most problematic call, for example, a GET or POST request when loading a web page and a corresponding SQL long query to the database. But what is happening inside the server at this time remains behind the scenes. Moreover, if for some reason the database server was combined with the application server within the same host, then it is almost impossible to separate their influence by the total execution time of the operation by this method. Fortunately, in most cases the use of this method brings good results. From my practice, I can say that about 99% of calls to me are resolved successfully. In this case, the information obtained by the APA service is key.
There are a lot of software and hardware on the market today that helps manage application performance. We use two main tools: one for detailed study of pre-recorded transactions, the other for continuous monitoring of application performance by decoding and analyzing their network traffic.
Now let's take a closer look at the methods for implementing individual APA directions.
Operational support methods
The key to success in the operational support of application performance is a clear formalization of each incident. The user, as a rule, describes the problem subjectively and often very emotionally. At the first stage it is very important to separate the emotional component (too strong coffee, bad mood or dislike for any application) from the direct definition of the problem. For this, I created a special list of questions that the user must answer during the creation of the incident. It is important to note that APA does not involve direct work with users; universal specialists of the first and second level of support receive all the necessary answers. Sometimes, some of the necessary information can be obtained using the automated performance monitoring application.
Further, the team responsible for this application provides me with a fairly complete description of its architecture (what host is responsible for what, and what network transactions between them are expected during the execution of problematic operations). Sometimes incomplete information is given, which is not an insurmountable obstacle to the investigation. Also, I can ask them to install the necessary agents on the client and server side of the application. Agents are used to collect statistical information from network interfaces. They are placed in strict accordance with the instructions and in 99% of cases their installation does not cause any difficulties.
Then, we will coordinate the procedure of direct testing of problem operations: either I reproduce the problem myself according to the instructions or ask the user to do it at my command. At the same time, I activate the writing process on my agents. The resulting material is a set of trace files that were simultaneously recorded during the execution of a problem operation at several observation points. They contain a complete history of network operations on selected hosts. The key advantage of the tool I use for analysis is the ability to merge these files into one time-aligned (i.e., 0 seconds trace file from the client absolutely exactly correspond to 0 seconds in server trace files). This gives me the opportunity to track in time the whole course of the operation - how long the client request went over the network to the application server, how much it spent processing, before sending the required database request, how long the database processed this request, and so on. Let us analyze a specific example.
Here is a fragment of the architecture of the application we are interested in (see Figure 3).
Figure 3
After recording and processing, the problem operation looks as shown in Figure 4:
Figure 4
Next, you can determine the effect of each element on the total execution time of the operation (see Figure 5)
Figure 5
It can be seen that the problem is related to the application server and the CUBE server, but you can figure it out a little deeper. For example, highlight the most problematic challenges (see Fig. 6).
Figure 6
There is a topic for a reasoned conversation with the manufacturer of this software.
It is also important to note that this method is no less effective in investigating functional problems that are not related to performance, in which the support teams are deadlocked.
Initial analysis of the performance and architecture of new applications
This activity is entirely based on the methods used in operational support. In addition to them, we also have the ability to mathematically predict what will be the performance of the user interface in different regions for centralized applications.
Application Performance Monitoring
As mentioned above, it can be very difficult to get an objective assessment of the application's performance from the user. Just because of the subjectivity of the question itself. On the other hand, technical support in its work cannot operate with subjective metrics. This contradiction often leads to the fact that we are trying to fix non-existent or non-essential breakdowns, while the truly important problems are ignored. The main conclusion is that in order to effectively manage the performance of the applications installed in the enterprise, you need to have an independent system of automatic performance monitoring. Relying on users in this matter is pointless.
To resolve this issue, I use the means of continuous monitoring of application performance by decoding and analyzing their network traffic. Here the source of information is the SPAN ports configured on the switches of interest to us. That is, we practically do not interfere in any way with the work of the systems of interest to us, no agents on the servers are needed. The obtained information is collected and filtered on special probe servers and transmitted to the central server. This server is responsible for analyzing and storing the received data, providing a report interface and automatically notifying application performance problems.
This solution not only helps to quickly find out about existing problems, but also often gives a hint where to look for the root cause of their occurrence. Not as thoroughly and precisely as it can be done by means of operational support, but still enough to significantly speed up the investigation process. In addition, we can see long-term trends in application performance, as well as evaluate the effect of changes in infrastructure.
Let me give you a couple of examples of reports that we use.
Overall assessment of the load and performance of the user interface of the application for the last 8 hours (see. Fig. 7)
Figure 7
Here: Operations (left scale) - the total number of operations per measurement interval, divided into “slow operations” and “fast operations” . An operation is considered slow if its execution time exceeds a certain threshold value defined for this interface. Average operation time (right scale) - the average execution time of operations for each measurement interval.
The performance and load of the database server of the same application at the same time is shown in Figure 8.
Figure 8
If you wish, you can determine which SQL queries caused the “Average operation time” jump between 8 30 and 9 00, but there is no special need, since this did not affect the user interface.
In-house or outsource
There are companies on the market that provide application performance analysis as a service. As far as I could figure out, they do it about the same methods as I do, but various variations and additions are possible. If you are faced with the task of developing this area in your enterprise, the first question to decide is to use external services or develop a service within the company. When I went through this stage, I identified several key factors that helped us make the final decision. I hope you will find them interesting and useful too.
One of the first factors to think about is the price. In the case of an external service, the initial installation cost may be significantly lower than what an internal installation would require. Moreover, it is possible to practically avoid an increase in fixed assets (we are buying the service). If you install everything inside you need to be prepared for some costs - servers, licenses, personnel with its hiring and training, annual maintenance, resources for installing and debugging all this. And the time required for the efforts and costs to be applied to bring benefits can be substantially more if you do everything yourself. These arguments are very significant if we consider the short-term perspective, but over time the balance may change. The service provider is primarily a commercial organization. He, too, needs to cover his expenses for the maintenance of specialists and the maintenance of products and to do it with profit for himself. It may well happen that in the long run, with a more or less dense load, this service will require large expenses if you use the services of third-party companies. I spent a lot of time trying to compare the cost of ownership for each option. It was necessary to make some assumptions, based on existing experience: how many investigations a year should be carried out, how long it takes on average, and how much, in the end, it can cost.
No less important is what we get for this money (quality, volume, and also speed of investigation of critical incidents).
An important feature of the outsource services is that the supplier always works within the framework of its contract. Unlike internal service, he is absolutely not interested in the success of our business. Hence the inflexibility of the supplier in borderline situations. All that is not spelled out in the contract, as a rule, either impossible or very expensive. For example, a complex, critical non-performance incident has occurred. Very often, in such cases, the same tools and methods that are used to analyze performance problems will come to the rescue. The internal APA team will definitely help, but what the third-party provider says is unknown. Formally, this is far beyond the scope of the contract and the usual work for him. And it's not a fact that it will be easy to convince a manager on the other side to help, because he may not understand the technology and many arguments simply won't work for him.
The result of an APA investigation may be a recommendation to substantially change the existing infrastructure. This is done in order not only to resolve the current incident, but also to prevent a similar problem in other applications. It is absolutely not profitable for an external supplier to solve problems that have not yet happened. This is their income. In addition, the level of responsibility for the recommendations provided is quite high, as they often affect the overall strategy for the development of information technology in the enterprise. It is not always reasonable to leave these questions to the discretion of the external company.
No less difficult issue with the speed of investigation of critical incidents. In general, investigating performance problems is a complex area. You can never say in advance how much time it will take to analyze - too many unknown factors. In any case - this is not something that can be reflected in the contract. And how then to be, if you need to urgently understand? The internal division, in one way or another, depends on the success of our business, but the external company does not.
In addition, working with an external supplier implies a certain formalization of requests and the results obtained. And now the question is: are all internal units ready to clearly formulate their requests and can understand exactly what they were told? People often come to me and ask not about what they really need. It turns out that inside we still need someone who will act as an interpreter, who knows the right people within the company and understands how to communicate with an external supplier in his language. At the same time, this role implies the presence of a good technical expertise, which is practically the same as is needed in order to carry out investigations independently.
Consideration of the above arguments led us to the decision to leave APA as an internal service. Of course, in each case the optimal solution may differ. Any arguments are a priori controversial because of the very nature of the issue. I just share my experience.
Conclusion
All of the above is a version of the practical implementation of the process of analyzing and managing the performance of applications in a large enterprise. In our case, it gives a good result. Over the past year, the APA unit has been involved in investigating a number of critical issues and in the vast majority of cases played a key role in determining the root cause. Moreover, in many cases it was difficult to imagine how the errors found could be identified without involving APA methods. Our work is appreciated by management.
Links
[1] en.wikipedia.org/wiki/Application_Performance_Management .
[2] “Retail IT Service Operation: Across a Business Ecosystem” Enterprise Management Associates. 2011
[3] en.wikipedia.org/wiki/Enterprise_architecture_framework
[4] en.wikipedia.org/wiki/Information_Technology_Infrastructure_Library .
Source: https://habr.com/ru/post/212895/
All Articles