Data Mining Camp: how we were inspired for the year ahead
Once at the very beginning of the new year, we decided to combine business with pleasure: to have a rest and work together. And they invited employees, our students and experts from companies EMC , Rosalind , Yota , Game | Changers to spend three days of winter holidays in a house near St. Petersburg.
Meeting with like-minded friends outside the city is good to share ideas, write an article or finish a job that has never reached its hands. To do this, we organized a trip to Data Mining Camp. We decided that there would be a sauna, board games, a contact zoo and - the highlight of the program - a hackathon.
With the help of experts, the guys at the hackathon worked on three studies: a model of hierarchical clustering of signs, a model of leaving online courses, they tried to improve the algorithm of Gradient Boosting Machines, and also participated in the competition on the Kaggle platform. About how it was and how the guys continue to work on these ideas under the cut ...
')

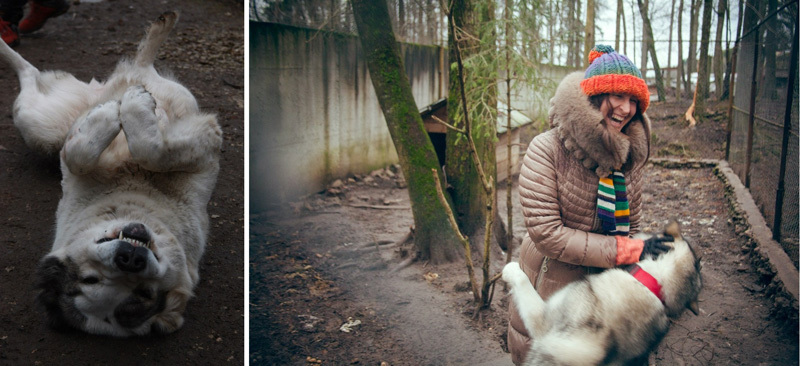
The first thing we went to a private zoo . Frolicked there, remembered childhood: everyone found entertainment to their own taste. Someone like a beggar-raccoon, someone camel or lama ...

... but the most courageous ones ventured to play with big, but kind dogs.
We spent the evening of the first day for intimate conversations in the sauna and preparing for the hackathon tomorrow, meeting the arriving guests. The next morning passed for conversations and board games.
Inspired by the entertainment program, we began to discuss the actual affairs. Right after the game at Munchkin, the conversation turned to education in the field of Data Mining and ideas for new research.
Among us were experts in the field of bioinformatics, finance, telecom and big data, who shared their research experience while having a cup of tea. For example, after the story of Vladimir Suvorov, an expert from EMC , about deciphering the dragonfly genome, a dozen ideas emerged that could be further deciphered and how to start cooperation in the field of bioinformatics.

Rosalind experts shared their educational experiences. We concluded that lectures on machine learning and data analysis are less effective than practice. Hackatons, contests, real tasks from experts - this is what you need to become a good specialist. The question remains open: “How to combine online and offline education? Recommend before starting the training to listen to certain courses on Coursera? Completely exclude lectures? Or is there another way? ”
Meanwhile, the hackathon was near, which we decided to divide into two independent streams: participants of hackathon # 1 conducted their mini-research and wrote an article on its results, and participants of hackathon # 2 worked together to solve the problem for an international competition.
Three teams participated in the research hackathon. The first team worked on the methods of feature selection, one of the main tasks of data analysis. Why do you need it? Too many features, that is, columns in a dataset can make calculations difficult or even impossible. For example, if the sample size is smaller than the number of attributes.
Suppose that we want to predict what place our country will take at the Olympiad, and decided to collect more information. On the economy: GDP per capita, external debt, the minimum wage, the volume of imports and exports, the number of immigrants. About geography: the latitude of the capital, the percentage of area occupied by mountains, the area of the whole country. About past Olympiads: the number of medals of each value, the number of athletes, the number of sports in which the country is represented, the venue ... In general, we are so fascinated by data collection that we did not notice how the number of signs exceeded the number of participating countries. And this, frankly, is not good, because the number of equations has become less than the number of unknowns, which leads either to incompatibility of the system or to an infinite number of solutions.
We'll have to weed out extra information. Usually, information criteria ( AIC , BIC ) are used to select a model with an optimal set of features. The best is considered a model that adequately describes the data with the least number of signs. Or they use the regularization methods built into the models, in other words, they hope that the model will cope with incorrect data itself. Or reduce the dimensionality of the data using the principal component method (PCA). The essence of the principal component method is most easily conveyed by an example with two signs:
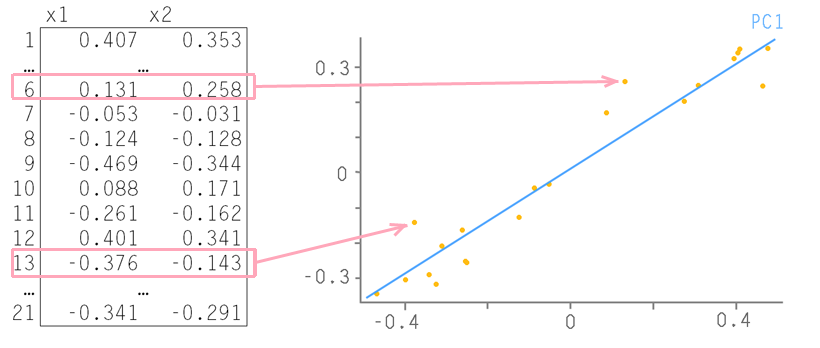
Each row of the table corresponds to a point on the plane. Let us draw a straight line through them so that the maximum data change takes place along it, it is called the first main component - PC1. Then we project all the origin points onto this axis. All deviations from the new axis will be considered noise. It’s possible to check whether this is noise, by doing the same thing with the original data as we did with the original data — find the axis of maximum changes in them. It is called the second major component (PC2). And so it is necessary to act until the noise is no longer really noise, that is, a random random set of values. An example is taken from here , but here you can read more about the method of the main components.
If you do not want to change the signs, as in the principal component method, or the models do not have built-in regularizations, for example, neural networks, and are easily subject to retraining, other approaches are needed. Our guys decided to develop a model of hierarchical clustering of signs followed by a search for a subset of the most successful of them.
Let us consider in more detail the resulting algorithm. The hierarchy will be formed using the clustering algorithm, the most popular of which is the k-means method. The number of clusters k is known in advance, suppose we set k = 2. We will randomly select two features from our model and begin to form clusters around them. We will transfer the center of the cluster until the total square deviation becomes minimal. The sign in our case turns into a point in n-dimensional space, where n is the number of entries in the table, that is, the number of countries participating in the Olympiad. About the mechanism of the k-means algorithm can be found here .
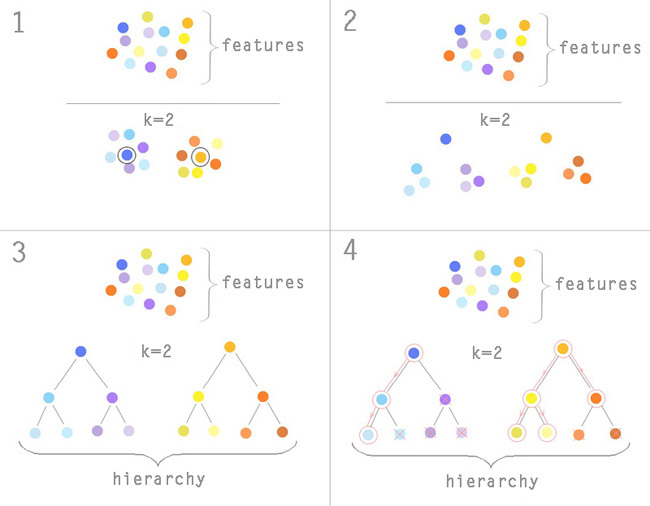
Now our signs are divided into two groups. In each of them, we selected one characteristic feature by the principle of proximity to the cluster median (1) . Again we cluster each of the resulting groups, excluding the characteristic feature (2) . We will repeat until the number of signs in the subgroup is> 2.
As a result, we will obtain a tree, in the nodes of which to the lower levels there are all less significant features (3) . After this selection is made. Suppose we need to leave 8 signs. At first, our model is trained only on signs from the top level of the hierarchy. For each of them, a decision is made based on the contribution of the trait to the model: leave it in the model, remove or delve into the subgroup. If the contribution is large enough - leave, if the average - leave and delve into the subgroup, if very small - throw away the entire subgroup with it. We continue to descend down the tree until the prediction error of our model decreases and the number of selected features <8 (4) .
The second team worked on creating a model of leaving users MOOC (Massive Open Online Course) on the example of three platforms: Coursera , Rosalind and Stepic . This task is now very relevant for online education - in one of the interviews Daphne Koller told that only 7% of users finish the course on Coursera. The goal is to create a model that will describe the user's behavior at different stages of training, in order to track activity and find “bottlenecks”.
At the hackathon, the guys investigated the data of the Rosalind platform, which is primarily aimed at training bioinformatists by solving practical problems. During the hackathon, the guys decided on a list of signs for the model and variants of the target variable. To build the model, we identified three types of features that characterize:
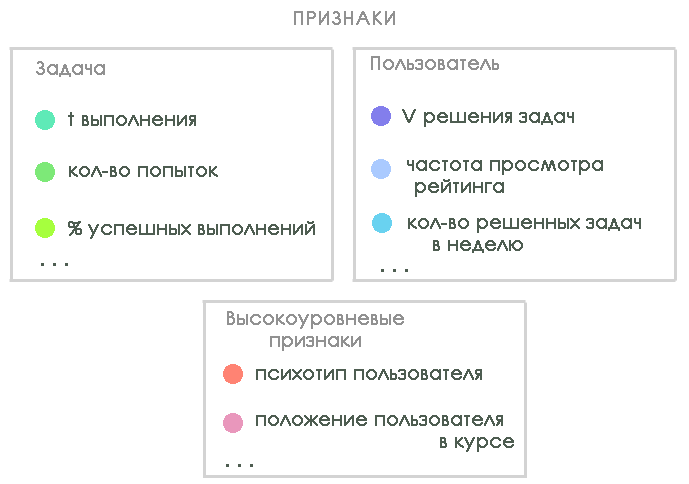
Not all signs were counted on the hackathon (there was not enough power and manpower), but it became clear where the guys should move in further studies.
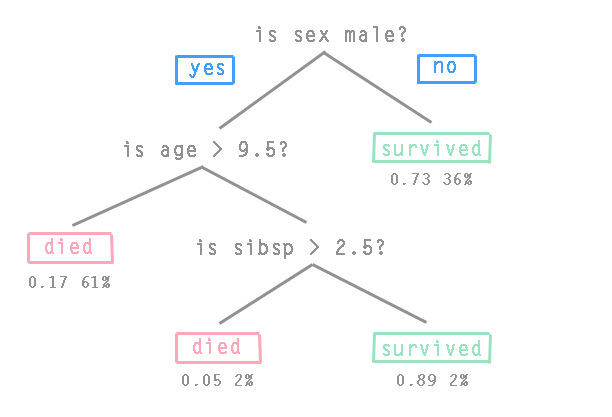
The third team tried to improve the algorithm Gradient Boosting . This algorithm builds a prediction model from an ensemble of “weak” predictive models called “base-learner” or “basic building blocks”. “Weak” models are trained in a training sample, after which they are combined in such a way that the final prediction model becomes more accurate at each iteration. Typically, the Gradient Tree Boosting algorithm is used, where the fixed-size CART decision trees are used as “basic building blocks”. The conditions of the transition lie in the nodes of the decision trees, and the values of the objective function lie in the leaves. The picture shows a classic example of a decision-making tree about passengers of the Titanic (sibsp is the number of relatives on the ship):
The guys wondered whether it was possible to increase the accuracy of the model by mixing the components of the ensemble in various ways. Were considered options for GBM (Gradient Boosting Machines), where the ensemble consists of SVM- regression, linear models and all sorts of options for trees. So far, the standard GBM has not been defeated, but the work continues to boil even after the hackathon ends.
The goal of all three teams was to write an article for participation in the ICML international machine learning conference , which will be held in Beijing this summer.

The second hackathon was dedicated to a competition from Yandex on the Kaggle crowdsourcing platform . The task is to rank the web pages in the output based on user preferences. Yandex has provided a history of almost 6 million users in 27 days, which is about 21 million requests. For each request, there were: user id, a list of words in the query, 10 positions from the issue, the position number that the user selected, and the time of each user action. In addition, test session data was provided for the next 3 days.
It was necessary to arrange the issue in test sessions so as to obtain the maximum NDCG (Normalized discounted cumulative gain) . Consider in more detail what it is. DCG - discounted cumulative gain or reduced total effectiveness of relevance is calculated using the following formula:
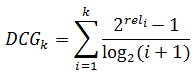
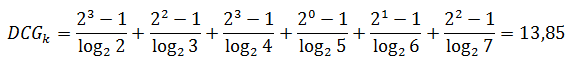
where i is the serial number of the issue, and rel is the degree of compliance with the request. On a scale of compliance 0 to 3, the first six pages in the issue can be estimated, for example, as follows: 3,2,3,0,1,2. Calculate the reduced total effectiveness of relevance:
and the cited total effectiveness of relevance with perfect ranking:
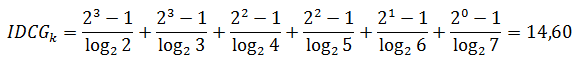
We normalize the result by dividing the real DCG into the ideal one:
This metric is often used in information retrieval and in ranking evaluation.
Having dealt with performance indicators, the guys got down to work. The prepared logs of user requests occupied more than 60 gigabytes, which made it difficult to use machine learning algorithms. There was nothing left before the deadline, so it was decided to leave the data only on personal navigation inquiries. They accounted for 10% of the sample, that is 6 gigabytes.
In order to improve the current output, the team decided to check whether there are any users who in the past entered the same query (query_id). In many cases, it turned out. The guys analyzed the time the user visited certain documents, the frequency of clicks and other parameters in the training set, and then used this data to rank the current issue. The simplest rule was used: the web document advanced to the top, if previously a user with the same request visited it several times, and the average visit time was more than 400 ts (time stamp is equivalent to time. By condition, a time equal to 400 ts or more meant relevance document to user).
According to the results of the competition, our team overcame the baseline - the result was improved by 0.6% compared with what Yandex offered as a sample. For comparison, the best result in the leaderboard surpassed the baseline by only 1.6%. It is for such pennies that there is a struggle to improve the quality of service.
In the morning everyone went home. Time passed unnoticed at work and entertainment, for interesting conversations and the exchange of ideas.

The idea of holding such meetings seemed good, so we decided to regularly hold mini-conferences in an informal setting. We assign the following to the spring and we will definitely write an announcement with the exact date on Habré. We always welcome new like-minded people, and if you have interesting ideas about this, please share them in the comments!
Meeting with like-minded friends outside the city is good to share ideas, write an article or finish a job that has never reached its hands. To do this, we organized a trip to Data Mining Camp. We decided that there would be a sauna, board games, a contact zoo and - the highlight of the program - a hackathon.
With the help of experts, the guys at the hackathon worked on three studies: a model of hierarchical clustering of signs, a model of leaving online courses, they tried to improve the algorithm of Gradient Boosting Machines, and also participated in the competition on the Kaggle platform. About how it was and how the guys continue to work on these ideas under the cut ...
')
Fun hour ...
The first thing we went to a private zoo . Frolicked there, remembered childhood: everyone found entertainment to their own taste. Someone like a beggar-raccoon, someone camel or lama ...
... but the most courageous ones ventured to play with big, but kind dogs.
We spent the evening of the first day for intimate conversations in the sauna and preparing for the hackathon tomorrow, meeting the arriving guests. The next morning passed for conversations and board games.
Inspired by the entertainment program, we began to discuss the actual affairs. Right after the game at Munchkin, the conversation turned to education in the field of Data Mining and ideas for new research.
... and business time!
Among us were experts in the field of bioinformatics, finance, telecom and big data, who shared their research experience while having a cup of tea. For example, after the story of Vladimir Suvorov, an expert from EMC , about deciphering the dragonfly genome, a dozen ideas emerged that could be further deciphered and how to start cooperation in the field of bioinformatics.
Rosalind experts shared their educational experiences. We concluded that lectures on machine learning and data analysis are less effective than practice. Hackatons, contests, real tasks from experts - this is what you need to become a good specialist. The question remains open: “How to combine online and offline education? Recommend before starting the training to listen to certain courses on Coursera? Completely exclude lectures? Or is there another way? ”
Meanwhile, the hackathon was near, which we decided to divide into two independent streams: participants of hackathon # 1 conducted their mini-research and wrote an article on its results, and participants of hackathon # 2 worked together to solve the problem for an international competition.
Hackathon # 1
Three teams participated in the research hackathon. The first team worked on the methods of feature selection, one of the main tasks of data analysis. Why do you need it? Too many features, that is, columns in a dataset can make calculations difficult or even impossible. For example, if the sample size is smaller than the number of attributes.
Suppose that we want to predict what place our country will take at the Olympiad, and decided to collect more information. On the economy: GDP per capita, external debt, the minimum wage, the volume of imports and exports, the number of immigrants. About geography: the latitude of the capital, the percentage of area occupied by mountains, the area of the whole country. About past Olympiads: the number of medals of each value, the number of athletes, the number of sports in which the country is represented, the venue ... In general, we are so fascinated by data collection that we did not notice how the number of signs exceeded the number of participating countries. And this, frankly, is not good, because the number of equations has become less than the number of unknowns, which leads either to incompatibility of the system or to an infinite number of solutions.
We'll have to weed out extra information. Usually, information criteria ( AIC , BIC ) are used to select a model with an optimal set of features. The best is considered a model that adequately describes the data with the least number of signs. Or they use the regularization methods built into the models, in other words, they hope that the model will cope with incorrect data itself. Or reduce the dimensionality of the data using the principal component method (PCA). The essence of the principal component method is most easily conveyed by an example with two signs:
Each row of the table corresponds to a point on the plane. Let us draw a straight line through them so that the maximum data change takes place along it, it is called the first main component - PC1. Then we project all the origin points onto this axis. All deviations from the new axis will be considered noise. It’s possible to check whether this is noise, by doing the same thing with the original data as we did with the original data — find the axis of maximum changes in them. It is called the second major component (PC2). And so it is necessary to act until the noise is no longer really noise, that is, a random random set of values. An example is taken from here , but here you can read more about the method of the main components.
If you do not want to change the signs, as in the principal component method, or the models do not have built-in regularizations, for example, neural networks, and are easily subject to retraining, other approaches are needed. Our guys decided to develop a model of hierarchical clustering of signs followed by a search for a subset of the most successful of them.
Let us consider in more detail the resulting algorithm. The hierarchy will be formed using the clustering algorithm, the most popular of which is the k-means method. The number of clusters k is known in advance, suppose we set k = 2. We will randomly select two features from our model and begin to form clusters around them. We will transfer the center of the cluster until the total square deviation becomes minimal. The sign in our case turns into a point in n-dimensional space, where n is the number of entries in the table, that is, the number of countries participating in the Olympiad. About the mechanism of the k-means algorithm can be found here .
Now our signs are divided into two groups. In each of them, we selected one characteristic feature by the principle of proximity to the cluster median (1) . Again we cluster each of the resulting groups, excluding the characteristic feature (2) . We will repeat until the number of signs in the subgroup is> 2.
As a result, we will obtain a tree, in the nodes of which to the lower levels there are all less significant features (3) . After this selection is made. Suppose we need to leave 8 signs. At first, our model is trained only on signs from the top level of the hierarchy. For each of them, a decision is made based on the contribution of the trait to the model: leave it in the model, remove or delve into the subgroup. If the contribution is large enough - leave, if the average - leave and delve into the subgroup, if very small - throw away the entire subgroup with it. We continue to descend down the tree until the prediction error of our model decreases and the number of selected features <8 (4) .
The second team worked on creating a model of leaving users MOOC (Massive Open Online Course) on the example of three platforms: Coursera , Rosalind and Stepic . This task is now very relevant for online education - in one of the interviews Daphne Koller told that only 7% of users finish the course on Coursera. The goal is to create a model that will describe the user's behavior at different stages of training, in order to track activity and find “bottlenecks”.
At the hackathon, the guys investigated the data of the Rosalind platform, which is primarily aimed at training bioinformatists by solving practical problems. During the hackathon, the guys decided on a list of signs for the model and variants of the target variable. To build the model, we identified three types of features that characterize:
Not all signs were counted on the hackathon (there was not enough power and manpower), but it became clear where the guys should move in further studies.
The third team tried to improve the algorithm Gradient Boosting . This algorithm builds a prediction model from an ensemble of “weak” predictive models called “base-learner” or “basic building blocks”. “Weak” models are trained in a training sample, after which they are combined in such a way that the final prediction model becomes more accurate at each iteration. Typically, the Gradient Tree Boosting algorithm is used, where the fixed-size CART decision trees are used as “basic building blocks”. The conditions of the transition lie in the nodes of the decision trees, and the values of the objective function lie in the leaves. The picture shows a classic example of a decision-making tree about passengers of the Titanic (sibsp is the number of relatives on the ship):
The guys wondered whether it was possible to increase the accuracy of the model by mixing the components of the ensemble in various ways. Were considered options for GBM (Gradient Boosting Machines), where the ensemble consists of SVM- regression, linear models and all sorts of options for trees. So far, the standard GBM has not been defeated, but the work continues to boil even after the hackathon ends.
The goal of all three teams was to write an article for participation in the ICML international machine learning conference , which will be held in Beijing this summer.
Hackathon # 2
The second hackathon was dedicated to a competition from Yandex on the Kaggle crowdsourcing platform . The task is to rank the web pages in the output based on user preferences. Yandex has provided a history of almost 6 million users in 27 days, which is about 21 million requests. For each request, there were: user id, a list of words in the query, 10 positions from the issue, the position number that the user selected, and the time of each user action. In addition, test session data was provided for the next 3 days.
It was necessary to arrange the issue in test sessions so as to obtain the maximum NDCG (Normalized discounted cumulative gain) . Consider in more detail what it is. DCG - discounted cumulative gain or reduced total effectiveness of relevance is calculated using the following formula:
where i is the serial number of the issue, and rel is the degree of compliance with the request. On a scale of compliance 0 to 3, the first six pages in the issue can be estimated, for example, as follows: 3,2,3,0,1,2. Calculate the reduced total effectiveness of relevance:
and the cited total effectiveness of relevance with perfect ranking:
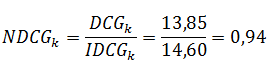
We normalize the result by dividing the real DCG into the ideal one:
This metric is often used in information retrieval and in ranking evaluation.
Having dealt with performance indicators, the guys got down to work. The prepared logs of user requests occupied more than 60 gigabytes, which made it difficult to use machine learning algorithms. There was nothing left before the deadline, so it was decided to leave the data only on personal navigation inquiries. They accounted for 10% of the sample, that is 6 gigabytes.
In order to improve the current output, the team decided to check whether there are any users who in the past entered the same query (query_id). In many cases, it turned out. The guys analyzed the time the user visited certain documents, the frequency of clicks and other parameters in the training set, and then used this data to rank the current issue. The simplest rule was used: the web document advanced to the top, if previously a user with the same request visited it several times, and the average visit time was more than 400 ts (time stamp is equivalent to time. By condition, a time equal to 400 ts or more meant relevance document to user).
According to the results of the competition, our team overcame the baseline - the result was improved by 0.6% compared with what Yandex offered as a sample. For comparison, the best result in the leaderboard surpassed the baseline by only 1.6%. It is for such pennies that there is a struggle to improve the quality of service.
Impressions
In the morning everyone went home. Time passed unnoticed at work and entertainment, for interesting conversations and the exchange of ideas.
The idea of holding such meetings seemed good, so we decided to regularly hold mini-conferences in an informal setting. We assign the following to the spring and we will definitely write an announcement with the exact date on Habré. We always welcome new like-minded people, and if you have interesting ideas about this, please share them in the comments!
Source: https://habr.com/ru/post/212393/
All Articles