Qwt and Qt Creator. Quick and easy. Part 2: Display and Control Elements
The examples used are Qt Creator 3.0.0 (MinGW) and Qwt-6.1.0.
For the reader to understand this article, it is advisable:
- have initial experience in developing windows applications in the Qt Creator environment;
- understand the concept of "signal-slot";
- get acquainted with part number 1 of the series of my articles about Qwt: habrahabr.ru/post/211204
Qwt is a graphic library that allows you to significantly simplify the process of data visualization in the program. Simplification is as follows: there is no need to manually prescribe display elements, such as scales of coordinates, grids, data curves, and so on. It is only necessary to set the parameters of these elements.
')
In part number 1 (gradually growing) series of articles we:
• connected Qwt to Qt Creator;
• built a schedule;
• set the coordinate axes;
• change the scale of the graph (zoom in / out it);
• moved across the chart field;
• displayed the coordinates next to the cursor by clicking the mouse.
In part 2, we will expand the functionality of our visualizer:
• add a status bar;
• save the click coordinates in variables and display them in the status bar;
• add a button to the control panel;
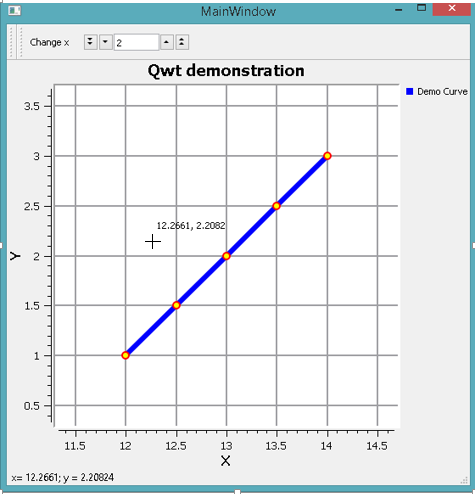
• add to the control panel QwtCounter (the field for the number, the value of which can be changed by arrows, see the picture).
• using QwtCounter, set the x offset of the graph;
• pressing the button will shift the graph to the previously set value x.
Note: For the purposes of this article, the addition of GUI controls is not used.
Preparation: splitting the code presented in article 1 into functions
In the previous article, the code went entirely in the MainWindow constructor. Now we divide the code into functions. There is a slight change: if earlier we registered the coordinates of the points of the curve directly, now we read them from the array (see comment).
Important: if you are creating a new project, do not forget to add a line to the .pro file
Important: if you are creating a new project, do not forget to add a line to the .pro file
CONFIG += qwt Here is the content should be in the file mainwindow.h
#ifndef MAINWINDOW_H #define MAINWINDOW_H #include <QMainWindow> #include <qwt_plot.h> #include <qwt_plot_grid.h> #include <qwt_legend.h> #include <qwt_plot_curve.h> #include <qwt_symbol.h> #include <qwt_plot_magnifier.h> #include <qwt_plot_panner.h> #include <qwt_plot_picker.h> #include <qwt_picker_machine.h> namespace Ui { class MainWindow; } class MainWindow : public QMainWindow { Q_OBJECT public: explicit MainWindow(QWidget *parent = 0); ~MainWindow(); private: Ui::MainWindow *ui; QwtPlot *d_plot; void setPlot(); QwtPlotGrid *grid; void setPlotGrid(); QwtPlotCurve *curve; QwtSymbol *symbol; void setCurveParameters(); // double pointArray[5][2]; QPolygonF points; void addPointsToCurveAndShow(); QwtPlotMagnifier *magnifier; void enableMagnifier(); QwtPlotPanner *d_panner; void enableMovingOnPlot(); QwtPlotPicker *d_picker; void enablePicker(); }; #endif // MAINWINDOW_H Here is the required contents of the mainwindow.cpp file.
#include "mainwindow.h" #include "ui_mainwindow.h" MainWindow::MainWindow(QWidget *parent) : QMainWindow(parent), ui(new Ui::MainWindow) { ui->setupUi(this); // setPlot(); // setPlotGrid(); // setCurveParameters(); addPointsToCurveAndShow(); // / enableMagnifier(); // enableMovingOnPlot(); // // enablePicker(); } void MainWindow::setPlot() { // (this) - // #include <qwt_plot.h> d_plot = new QwtPlot( this ); setCentralWidget(d_plot); // d_plot->setTitle( "Qwt demonstration" ); // d_plot->setCanvasBackground( Qt::white ); // // d_plot->setAxisTitle(QwtPlot::yLeft, "Y"); d_plot->setAxisTitle(QwtPlot::xBottom, "X"); d_plot->insertLegend( new QwtLegend() ); } void MainWindow::setPlotGrid() { // #include <qwt_plot_grid.h> grid = new QwtPlotGrid(); grid->setMajorPen(QPen( Qt::gray, 2 )); // grid->attach( d_plot ); // } void MainWindow::setCurveParameters() { //#include <qwt_plot_curve.h> curve = new QwtPlotCurve(); curve->setTitle( "Demo Curve" ); curve->setPen( Qt::blue, 6 ); // curve->setRenderHint ( QwtPlotItem::RenderAntialiased, true ); // // // #include <qwt_symbol.h> symbol = new QwtSymbol( QwtSymbol::Ellipse, QBrush( Qt::yellow ), QPen( Qt::red, 2 ), QSize( 8, 8 ) ); curve->setSymbol( symbol ); } void MainWindow::addPointsToCurveAndShow() { // // , // for (int i = 0; i < 5; i++) { pointArray[i][0] = 1.0 + 0.5*i; pointArray[i][1] = 1.0 + 0.5*i; points << QPointF( pointArray[i][0], pointArray[i][1]); } curve->setSamples( points ); // curve->attach( d_plot ); // } void MainWindow::enableMagnifier() { // #include <qwt_plot_magnifier.h> magnifier = new QwtPlotMagnifier(d_plot->canvas()); // , / magnifier->setMouseButton(Qt::MidButton); } void MainWindow::enableMovingOnPlot() { // #include <qwt_plot_panner.h> d_panner = new QwtPlotPanner( d_plot->canvas() ); // , d_panner->setMouseButton( Qt::RightButton ); } void MainWindow::enablePicker() { // #include <qwt_plot_picker.h> // d_picker = new QwtPlotPicker( QwtPlot::xBottom, QwtPlot::yLeft, // QwtPlotPicker::CrossRubberBand, // QwtPicker::AlwaysOn, // d_plot->canvas() ); // // d_picker->setRubberBandPen( QColor( Qt::red ) ); // d_picker->setTrackerPen( QColor( Qt::black ) ); // d_picker->setStateMachine( new QwtPickerDragPointMachine() ); } MainWindow::~MainWindow() { delete ui; } Add a status bar
Write the function's prototype in mainwindow.h:
Add code to mainwindow.cpp
Call the function from the MainWindow constructor:
void setStatusBar(); Add code to mainwindow.cpp
void MainWindow::setStatusBar() { #ifndef QT_NO_STATUSBAR ( void )statusBar(); #endif } Call the function from the MainWindow constructor:
setStatusBar(); Save the click coordinates in variables and display them in the status bar
Coordinates can be displayed either by mouse click or in real time. Since the coordinates in real time are already displayed near the cursor (a small correction of the code for part No. 1), we will implement the first option.
A click is an event. Therefore, we will create a slot that will receive this event (signal). In mainwindow.h, add a new private section and the following code:
We implement the slot (function) in mainwindow.cpp:
In the MainWindow constructor, we create a signal-slot pair.
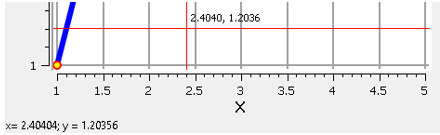
Compile and click anywhere on the screen (the bottom piece of the graph is shown):
As you already understood, click coordinates recorded in double variables can be used as you like.
A click is an event. Therefore, we will create a slot that will receive this event (signal). In mainwindow.h, add a new private section and the following code:
private Q_SLOTS: void click_on_canvas( const QPoint &pos ); We implement the slot (function) in mainwindow.cpp:
void MainWindow::click_on_canvas( const QPoint &pos ) { // double x = d_plot->invTransform(QwtPlot::xBottom, pos.x()); double y = d_plot->invTransform(QwtPlot::yLeft, pos.y()); QString info = "x= " + QString::number(x) + "; y = " + QString::number(y); // statusBar()->showMessage(info); } In the MainWindow constructor, we create a signal-slot pair.
// d_picker, d_plot! connect( d_picker, SIGNAL( appended( const QPoint & ) ), SLOT( click_on_canvas( const QPoint & ) ) ); Compile and click anywhere on the screen (the bottom piece of the graph is shown):
As you already understood, click coordinates recorded in double variables can be used as you like.
Create a control panel
Add a private variable to mainwindow.h
Write the function's prototype in mainwindow.h:
Add code to mainwindow.cpp
Call the function from the MainWindow constructor:
Result: a thin strip appeared in the upper part - the toolbar
(still empty).
QToolBar *toolBar; Write the function's prototype in mainwindow.h:
void setToolBar (); Add code to mainwindow.cpp
void MainWindow::setToolBar() { toolBar = new QToolBar( this ); addToolBar( toolBar ); } Call the function from the MainWindow constructor:
setToolBar(); Result: a thin strip appeared in the upper part - the toolbar
(still empty).
Add a button to the control panel
Add mainwindow.h to the beginning:
Add private variables to mainwindow.h and private prototype function:
Add code to mainwindow.cpp
Call the function from the MainWindow constructor:
#include <QToolButton> Add private variables to mainwindow.h and private prototype function:
QToolButton *toolButton; void addCorrectionButton(); Add code to mainwindow.cpp
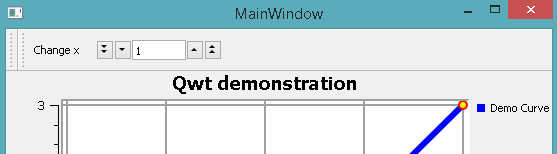
void MainWindow::addCorrectionButton() { toolButton = new QToolButton( toolBar ); toolButton->setText( "Change x" ); toolButton->setCheckable( true ); toolBar->addWidget( toolButton ); // } Call the function from the MainWindow constructor:
addCorrectionButton(); Add to the QwtCounter control panel
Add mainwindow.h to the beginning:
Add private variables to mainwindow.h and private prototype function:
Add code to mainwindow.cpp
Call the function from the MainWindow constructor:
Result:
#include <QHBoxLayout> #include <qwt_counter.h> Add private variables to mainwindow.h and private prototype function:
QWidget *hBox; QHBoxLayout *layout; QwtCounter *cntDamp; void addQwtCounter(); Add code to mainwindow.cpp
void MainWindow::addQwtCounter() { // cntDamp = new QwtCounter(); cntDamp->setRange( -50, 50 ); // // cntDamp->setSingleStep( 1.0 ); cntDamp->setValue( 0 ); // cntDamp->setEnabled(true); // // hBox = new QWidget(); // "", // QWidget. layout = new QHBoxLayout( hBox ); // layout->addWidget(cntDamp); // layout->addWidget( new QWidget(hBox) , 10 ); // spacer // ( void )toolBar->addWidget( hBox ); } Call the function from the MainWindow constructor:
addQwtCounter(); Result:
Using QwtCounter, we assign a graph offset to x
In mainwindow.h, add another slot to the private Q_SLOTS section:
Add a private variable to mainwindow.h:
We implement the slot (function) in mainwindow.cpp:
In the MainWindow constructor, initialize the added variable and create a signal-slot pair:
void setPlotCorrection( double coeff ); Add a private variable to mainwindow.h:
double changeXValue; We implement the slot (function) in mainwindow.cpp:
void MainWindow::setPlotCorrection( double coeff ) { changeXValue = coeff; } In the MainWindow constructor, initialize the added variable and create a signal-slot pair:
changeXValue = 0.0; connect( cntDamp, SIGNAL( valueChanged( double ) ), SLOT( setPlotCorrection( double ) ) ); Pressing the button will shift the graph to the previously specified value x
In mainwindow.h, add another slot to the private Q_SLOTS section:
implement the slot (function) in mainwindow.cpp:
After adding these lines, duplication appears in our code. However, the program has a demonstration character, so refactoring was not performed.
In the MainWindow constructor, create a signal-slot pair:
Note: the button has two different positions (pressed / not pressed), however, this state is not monitored in the program.
void changeX(); implement the slot (function) in mainwindow.cpp:
void MainWindow::changeX() { // points.clear(); for (int i = 0; i < 5; i++) { pointArray[i][0] += changeXValue; points << QPointF( pointArray[i][0], pointArray[i][1]); } curve->setSamples( points ); // d_plot->replot(); } After adding these lines, duplication appears in our code. However, the program has a demonstration character, so refactoring was not performed.
In the MainWindow constructor, create a signal-slot pair:
connect( toolButton, SIGNAL(toggled(bool)), SLOT( changeX() ) ); Note: the button has two different positions (pressed / not pressed), however, this state is not monitored in the program.
Results and conclusions
Run the program. Set the arrows any number and click on the button. The graph is successfully shifted across the field by a specified amount.
Findings:
This article on a simple example shows how to add controls manually, and using them to modify the schedule.
Obviously, adding controls manually is a process that requires additional manual coding. I would like to use a GUI. This is what my next article will be about.
Findings:
This article on a simple example shows how to add controls manually, and using them to modify the schedule.
Obviously, adding controls manually is a process that requires additional manual coding. I would like to use a GUI. This is what my next article will be about.
Thanks for attention!
PS Please leave comments about the design of the article. Was it convenient to read it? Maybe change the presentation of the material? How?
References:
Source archive of this example: yadi.sk/d/TcMglWvAHWvxT
Official Qwt resource: qwt.sourceforge.net
Collection of solutions of various problems with Qwt:
www.qtcentre.org/archive/index.php/f-23.html
Part number 1 of a series of articles about Qwt: habrahabr.ru/post/211204
Library variant, alternative Qwt (thanks, GooRoo !)
www.qcustomplot.com
Source: https://habr.com/ru/post/211867/
All Articles