MIG Icon Generator
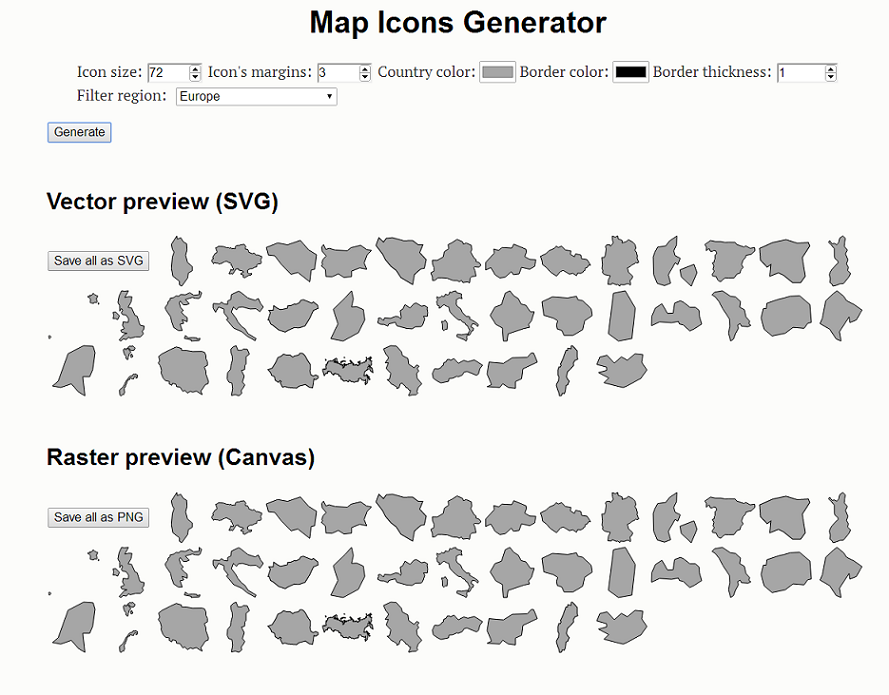
Greetings habrosoobschestvo. I want to share with you one of my latest mini-projects - the MIG geodata icon generator. With it, you can generate vector ( SVG ) and raster (PNG) icons, with the specified parameters (color, size, stroke, etc.).
All this works right in the browser and is distributed under the MIT license . Under the cat you can learn how to use it and how it works.
')
By default, MIG uses a world map on a 1: 110m scale to generate icons, based on natural earth data . It contains data for ( 174 + 3 ) countries of the world (the rest on this scale degenerate), plus three countries — Northern Cyprus, Kosovo and Somaliland. If this is enough for you, then simply set the parameters of the icons you need directly in the code, or use the GUI on the MIG's demo page . If you want to filter out some countries, this can be done easily by setting conditions for the
The demo looks very ascetic, because to achieve interesting results, you still have to change the code. So boldly fork MIG and change it for yourself. Yes, new inputs are used in the demo (HTML5), they are not yet supported everywhere: caniuse , but there is a fallback, so it should work anyway.
So, what to do if the default option does not suit you. First of all, it is necessary to determine the new geodata - this can be a world map, a country map with administrative borders, a city map with division into districts, or any other map. Once you have decided on the geodata you need to convert them to TopoJSON . This can be done using the Command-line TopoJSON , having previously installed the implementation of TopoJSON for Node.js. At the conversion stage, you must remove all unnecessary properties, you can also add names if you are not going to use an external file for this. When the new TopoJSON file is ready, update the paths and names:
Change the name of the
Everything, now it is possible to generate icons!
For those cases when you need to use a non-standard Mercator projection, you can easily add one of the available projections or even create your own. In this case, you can apply a separate projection for at least each icon. By the way, in the demo example, separate projections for Russia and the USA are used.
In general, there is an extensive field for experimentation.
The generator is written using the D3.js library , the code can be viewed on GitHub: Map Icons Generator . So, what is happening here. First, the geodata and the corresponding names are loaded (for the case when they are not sewn into the TopoJSON file). Then, for each object, an SVG element is created of a given size and the corresponding map region is drawn into it in a given projection, while the centering and scale are calculated based on the
Further, based on the created vector icons, raster are created. This happens as follows: in the loop we go over all SVG elements, create canvas elements and draw our icon there using the
I think to add filtering by country and improve the design of the demo page. Change the saving mechanism - now the icons are saved either individually, when you click on a country, or the entire region (continent) at once, and a modal window is created for each icon, I plan to replace it with the ability to download icons with one archive. I also plan to add the possibility of simplifying geometry and accuracy for geodata so that they can be adjusted accordingly to the size of the icons. Now it can be done at the stage of creating TopoJSON (
If there are any questions, something is not clear, found a bug or something else - write.
That's all, good luck!
All this works right in the browser and is distributed under the MIT license . Under the cat you can learn how to use it and how it works.
')
How to use
By default, MIG uses a world map on a 1: 110m scale to generate icons, based on natural earth data . It contains data for ( 174 + 3 ) countries of the world (the rest on this scale degenerate), plus three countries — Northern Cyprus, Kosovo and Somaliland. If this is enough for you, then simply set the parameters of the icons you need directly in the code, or use the GUI on the MIG's demo page . If you want to filter out some countries, this can be done easily by setting conditions for the
properties . For example, filtering by ID is as follows: .data(topojson.feature(world, world.objects.countries).features .filter(function(d) {return contryList.indexOf(d.id) > -1;})) The demo looks very ascetic, because to achieve interesting results, you still have to change the code. So boldly fork MIG and change it for yourself. Yes, new inputs are used in the demo (HTML5), they are not yet supported everywhere: caniuse , but there is a fallback, so it should work anyway.
So, what to do if the default option does not suit you. First of all, it is necessary to determine the new geodata - this can be a world map, a country map with administrative borders, a city map with division into districts, or any other map. Once you have decided on the geodata you need to convert them to TopoJSON . This can be done using the Command-line TopoJSON , having previously installed the implementation of TopoJSON for Node.js. At the conversion stage, you must remove all unnecessary properties, you can also add names if you are not going to use an external file for this. When the new TopoJSON file is ready, update the paths and names:
.defer(d3.json, "data/TopoJSON_file.json") .defer(d3.tsv, "data/external_file_for_names.tsv") Change the name of the
feature to suit your new file: .data(topojson.feature(world, world.objects.YourNewFeatureName).features Everything, now it is possible to generate icons!
Additional features
For those cases when you need to use a non-standard Mercator projection, you can easily add one of the available projections or even create your own. In this case, you can apply a separate projection for at least each icon. By the way, in the demo example, separate projections for Russia and the USA are used.
switch (d.id) { //Russia case "RUS": var projection = d3.geo.albers().rotate([-105, 0]).center([-10, 65]).parallels([52, 64]); path = d3.geo.path().projection(projection); break; //USA case "USA": var projection = d3.geo.albersUsa(); path = d3.geo.path().projection(projection); break; default: var projection = d3.geo.mercator(); path = d3.geo.path().projection(projection); break; } In general, there is an extensive field for experimentation.
What is under the hood
The generator is written using the D3.js library , the code can be viewed on GitHub: Map Icons Generator . So, what is happening here. First, the geodata and the corresponding names are loaded (for the case when they are not sewn into the TopoJSON file). Then, for each object, an SVG element is created of a given size and the corresponding map region is drawn into it in a given projection, while the centering and scale are calculated based on the
BoundingBox . There are several nuances associated with this point, since the presentation of geodata depends on the projection, in some cases autocentration and autoscaling will give an unattractive result. For example, countries through which the anti-meridian passes (including our long-suffering Russia) or countries with a large spread of territories (island) will look very fine. This can be corrected with the help of a suitable projection, or deletion (filtration) of a part of the territories of the displayed region. Then go to the stylization of icons. At this stage, you can use various SVG filters, gradients, patterns, clipping - in general, all the power of SVG .Further, based on the created vector icons, raster are created. This happens as follows: in the loop we go over all SVG elements, create canvas elements and draw our icon there using the
context.drawImage() , here also has a small nuance, the SVG should be all right with the xmlns attribute, and its Blob 'a is the correct MIME type, otherwise it will not work. Now fasten the save, run and enjoy the resulting icons.Further development
I think to add filtering by country and improve the design of the demo page. Change the saving mechanism - now the icons are saved either individually, when you click on a country, or the entire region (continent) at once, and a modal window is created for each icon, I plan to replace it with the ability to download icons with one archive. I also plan to add the possibility of simplifying geometry and accuracy for geodata so that they can be adjusted accordingly to the size of the icons. Now it can be done at the stage of creating TopoJSON (
simplification and quantization ).If there are any questions, something is not clear, found a bug or something else - write.
That's all, good luck!
Source: https://habr.com/ru/post/211689/
All Articles