We print OSM (Part 1)
Imagine a situation: an earthquake, flood, volcanic eruption happened near you. You are an OpenStreetMap member, of course, wrote about this on the forum. You spent the next half day and night together with other Osmery at drawing houses, setting addresses, marking the zone of destruction, and as a result you have a detailed electronic map of the area in the morning. In half an hour a friend will come to pick you up and together you are going to take warm clothes and water to the victims. How in the course of these half an hour — an hour to print a map, and why should victims even need maps,
In short: we will use Qgis and Alacarte.
Alacarte will be responsible for drawing a map with a custom style suitable for printing on a BW printer.
In Qgis, we will aggregate data from different sources in different formats and generate map / atlas sheets. In fact, this is what GIS is for.
1. Download and install the latest QGIS www.qgis.org/ru/site/forusers/download.html
Version 1.8 will also work in principle, but with reservations, so it’s best not to be lazy to download the latest.
2. Install the QGIS plugins - GridsForAtlas.
At the time of this writing, there is no version for QGIS 2.0 from the authors of the plugin. I rewrote the plugin for the second version of qgis and added something.
The plugin is here www.dropbox.com/s/vl98wb6fmprti8z/synoptiquesatlas.zip
Since I was modifying someone else's plugin and I don’t know if the authors intended to publish it, the link is not to github. I hope that the authors will make my changes and update the plugin, then it will be available in the main qgis plugin repository.
In the meantime, the plugin will have to be installed manually.
To do this, simply copy the synoptiquesatlas folder from the archive to~ / .qgis2 / python / plugins (C: \ Documents and Settings \ (user) \. Qgis2 \ python \ plugins)
3. Install alacrte. github.com/alacarte-maps/alacarte
I'm not a big fan of building something from source, so I just found a repository with deb'koy
https://launchpad.net/~andrew.sh/+archive/alacarte-maps
Binaries under win (thanks to freeExec ).
alacarte-importer - generates from osm-xml a file with data suitable for alacarte-server, which already handles http requests for obtaining map tiles.
4. Swing styles for alacarte
github.com/kiselev-dv/walking-papers.mapcss
bw is a general purpose style for printing in bw.
walking-papers is a style with an emphasis on printing bypass sheets.
5. Download the OSM data for the region whose map we are going to print.
If the community has already dealt with the problem, then the question of where to download the latest data upload, you probably will not have. Most likely, the hourly unloading of the region will be adjusted. (osm-data.xml)
As a result, we get the ala.carte file with the OS data indexed for fast rendering. Alacarte-server
We start the server
Where
-g /home/dkiselev/osm/ala.carte - the path to the file generated by alacarte-importer
-s walking-papers.mapcss - path to the folder with descriptions of rendering styles
The first time I run alacarte-server from under sudo so that alacarte can create folders in var for caching map tiles. In the future, you can run alacarte-server as a normal user. Or redefine the folder for the cache - server.cache-path and the path to access log'a - logfile
Checking that the server is up and running: localhost: 8080 Must get a picture of Oops! because we did not specify which square of the card we need.
In Qgis, there is no native way to open the TMS layer. But you can connect any gdal layer.
Create a file bw.gdal.xml with the following content
If you plan to use other styles, such as walking-papers, create 1 file for each (wp.gdal.xml for example) and change the query string pattern.
In principle, this way you can connect any TMS layer in qgis.
Next, run Qgis, add a raster layer .
Choose our xml bk.gdal.xml
Projection: EPSG: 3857 (She’s EPSG: 900913 is a pseudonym for 3857 that resembles google)
We check the project projection.
Project - Project Properties - Coordinate System
If not selected, enable automatic reprojection of coordinates, select EPSG: 3857
This is done so that the projection of the project and the layer coincide and there is no reprojection of the raster layer, which we are actually going to print.
In principle, you can use your layer in EPSG: 3857 in a project from another ck, gdal will helpfully reproject it to you. But it should be understood that when reprojecting, the quality of the image suffers significantly, especially the signatures will suffer.
Next, zoom in closer to the place that we are going to print, and click “increase to the best scale 100%”. This aligns the qgis and alacarte scale lines, in addition to reprojection, to avoid excessive scale for the image.

Suppose we print an atlas.
Those. We will need a set of rectangular areas with a small overlap for each page of the atlas, covering the part of the map that is interesting to us. Links between pages (this is very convenient when you know which page is below and do not flip through the entire atlas). And, perhaps, an alphabetical index, with the names of streets (shops, hospitals, schools, etc.) and page numbers where this street can be found.
First, we need to specify the area of our interest - the atlas, which we are going to print.
Click to create a shape-file.
Type - polygon,
Coordinate System - EPSG: 3857
The rest is the default.

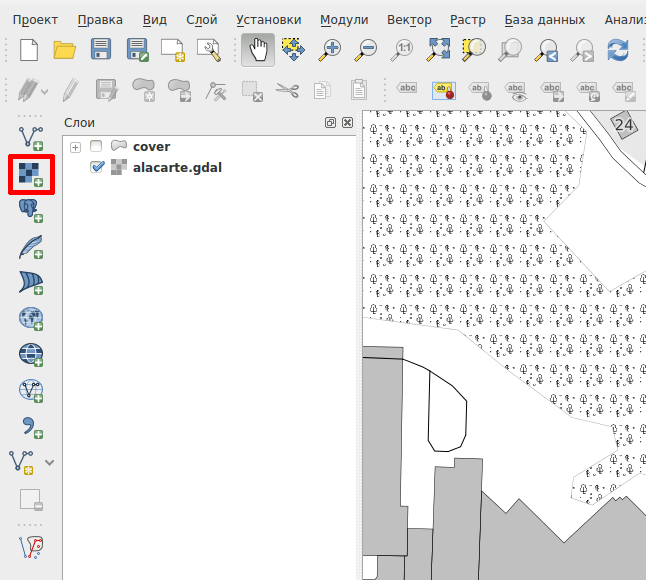
Choose a name for the shape of the file, I called the cover. We save. A new layer has appeared.
Select the newly created vector layer, turn on the editing mode.

We click add object and, by clicking on the points, create a polygon.
Complete creation - right click. After adding you will be asked to fill in the fields. We have one - id.
You can create multiple areas for printing.
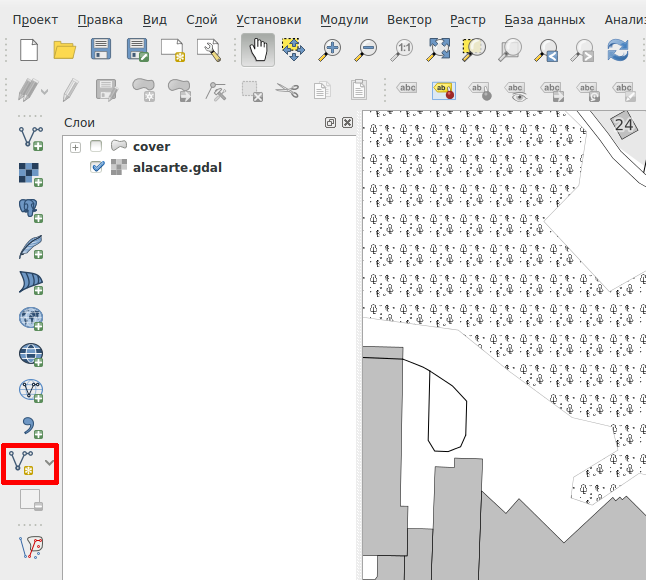
Turn off the editing mode (the same button that was used), save the changes to the shape file.
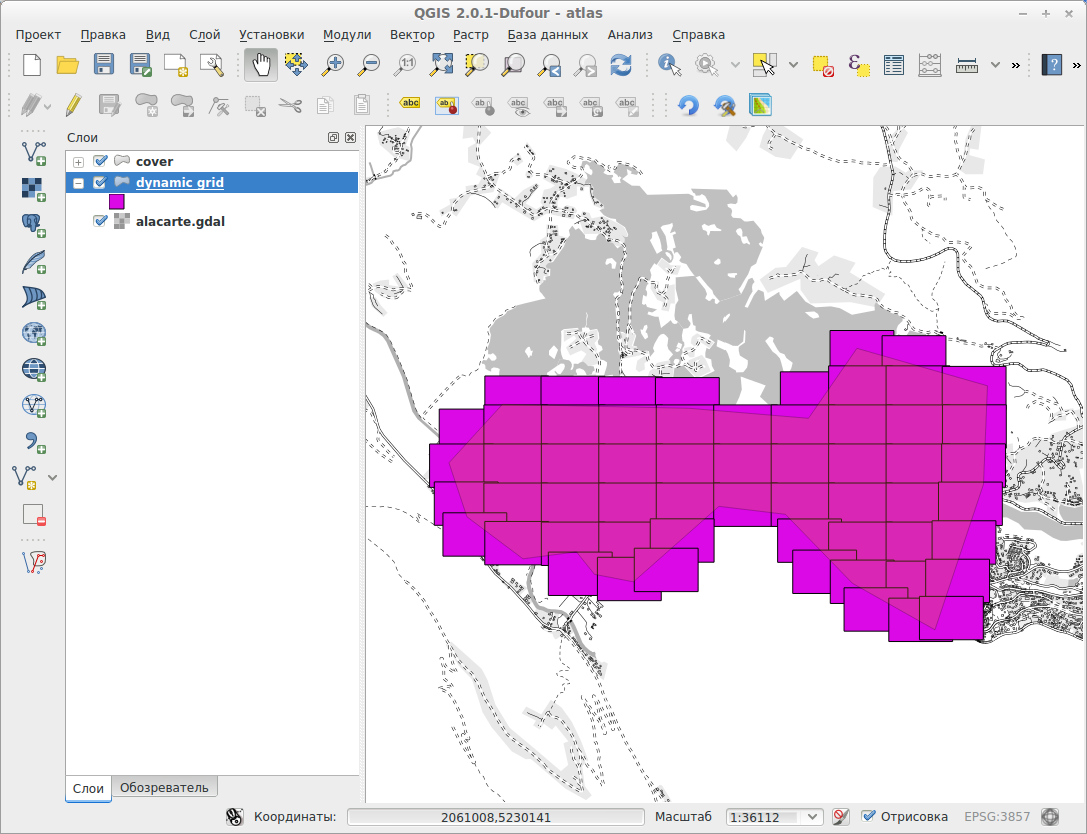
This is how the result looks like for me, if you make the cover fill translucent.

Hide the layer so that it does not print.
Select Project - Create layout.
This will be the layout of one sheet of our atlas. I called it page.
Select the size and orientation of the sheet. Add an item map.

Map can be pozumit mouse wheel.
Do not be greedy, leave the fields, we still need them for links to adjacent pages.
You can close the page layout for now.
Printing atlases in qgis is constructed as follows: you select a layer, and then for each object of the layer, the page is rendered either at a constant scale or in order to fit the object in the map.
For a classic atlas, we need a grid of rectangles corresponding to the size and scale of the map of our page layout. Fortunately, there is a plugin that will do this for us.
We include our layer from the fourth step with the coverage area.
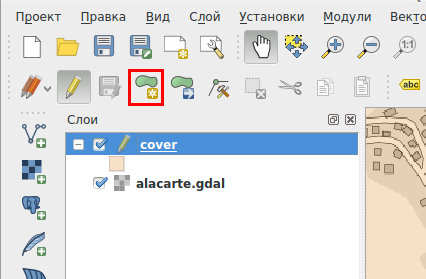
Run: Modules - Grids for Atlas - Grids for Atlas
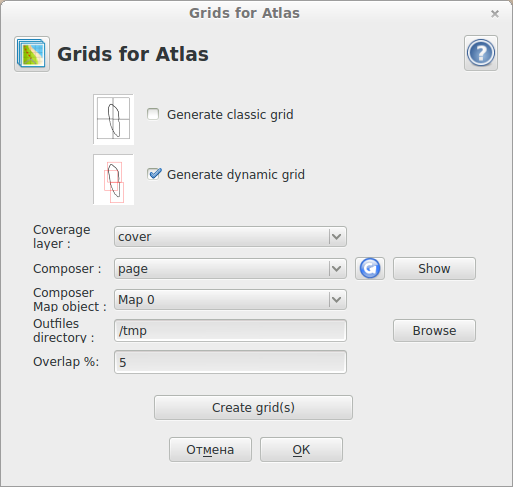
The plugin can generate 2 types of grid:
classic grid and dynamic grid
The classic grid is a regular grid of rectangles.
dynamic grid - the rectangles are moved so that the sheet can be optimally used for printing.
Coverage layer - a layer with area / areas of coverage.
Compozer page layout
Compozer map object - selected by the machine. If you have more than one card per sheet, select the one you need.
Outfiles directory - the plugin will create layers and corresponding files. This is the path to the directory where the files of the layers with grids will be saved.
Overlap% - overlapping grid cells.
Overlap percentage can be set both when printing and when generating a grid. For the grid, it is needed if you are going to build an alphabetical index of objects for your atlas. Then the grid cells will correspond to print areas 1 to 1 and objects that fall into the overlapping area of the cells will be on all pages on which they are printed. In this case, when printing, specify the fields 0%.
As a result, we get a layer with a grid of rectangles.
Go back to our page layout.
Project - Layouts of maps - page (if you named your layout page).
Add page numbers and links to adjacent pages.
Open the Atlas tab.
Select the coverage layer - dynamic grid (or the classic grid if you generated a classic grid at the last step).
Scaling - by the size of objects with a field of 0% (or leave the field if you generated the grid without overlapping cells).
Next, add the text. Add text elements.

In the properties of the object, click Insert expression, and expand the Fields and values item. If you selected the correct layer on the atlas tab as the coverage layer, then the field list will contain all the fields of the dynamic grid layer.
ID_MAILE - cell ID. Countdown from zero.
above, below, left, right, etc. - links to adjacent grid cells.
Since the countdown is from scratch - you need to add 1 everywhere.
Here are the properties of the signature containing the number of the upper left page and a piece of the map element.
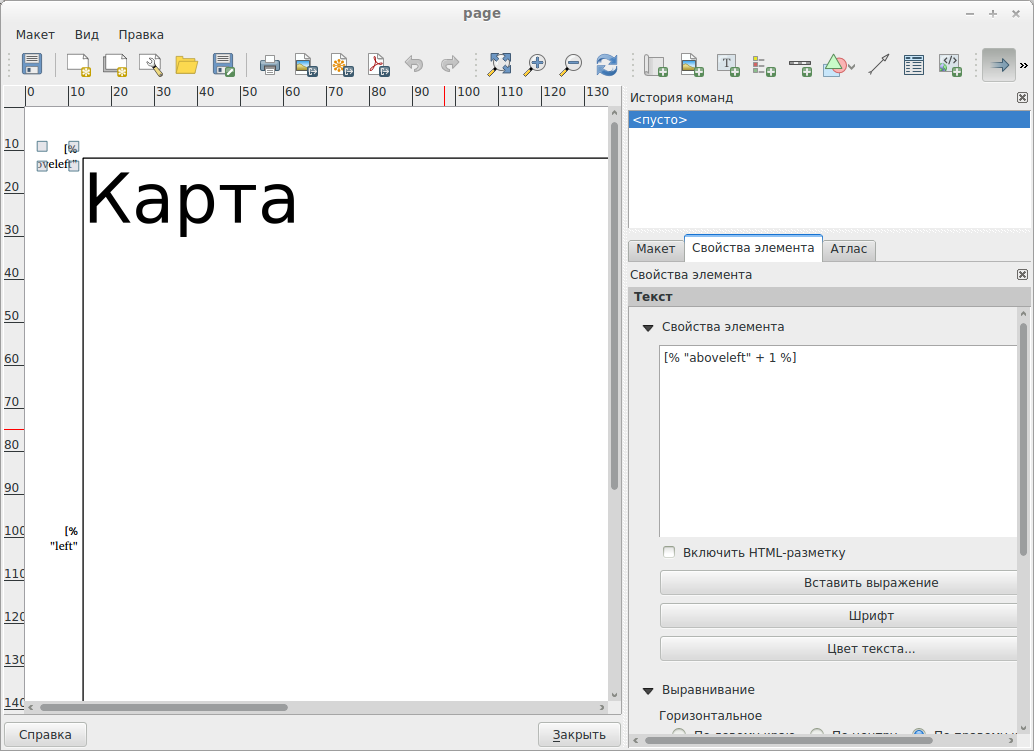
So, for the number of the current page in the properties of the element should be:
For the page number on the right:
If there is no adjacent cell, the fields will be empty.
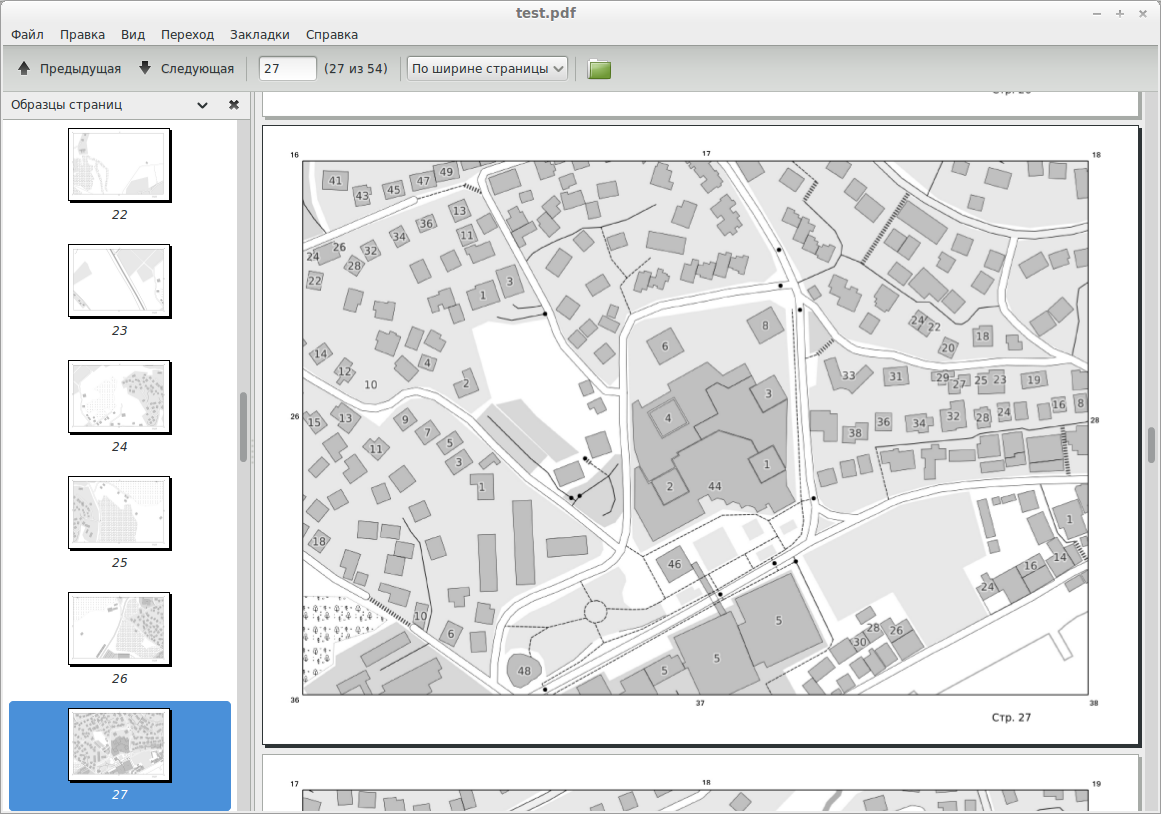
Go back to the Atlas tab, put a tick to create a multipage document in Export. In the top toolbar, select export to PDF. Choose where to save pdf.
The tutorial turned out to be quite long, if you are not doing this for the first time, it takes 10 - 15 minutes from the moment you install all the programs and download the data until you have an atlas. And remember, if the situation that I described at the beginning of the tutorial is real, it is much more useful to check whether you took everything in the last half hour before leaving. Atlas will make you a responsive osm community.
In the second part we will build an alphabetical index, let's talk about how to change the style for Alacarte. How to add layers with additional information and how to add a minimap to make it clear which part of the city is printed on the page.
So, why do we need maps in such situations and what cards are needed?
First of all, they are necessary for the organization of volunteers, forces of the Ministry of Emergency Situations and generally coordinated work. Let's say you organize the work of volunteers, you need to dissolve warm clothes and ask the residents what kind of help is still needed. Volunteers in the city are not oriented, explain to everyone the road, where is the street and what is the name of this or that area of the city, in the local bird language? And what to do if, for example, while you were delivering assistance, you were told that someone had phoned with relatives and they urgently need help, they live “on a new river near a house of culture”.
')
With maps, everything is much simpler: in general, you don’t even need to know what the streets and districts are called, you can simply hand out squares or city sectors to volunteer teams. When communicating with locals, explaining where something is located is much easier if you have a map. Despite the information society and other interesting things you need a paper map.
Secondly, the cards will be useful to the victims themselves, for example, if they have help points, etc.
A few words about which cards can be useful.
First of all, this is an atlas. If the atlas or, at least, the breakdown of the atlas into pages is the same for all volunteers, then you can simply navigate by the page numbers.
In addition - these are maps of important places with the surroundings. For example, in each district a help point is organized, where you can get food, warm clothes, etc. You need a map sheet with this item and the surrounding area to hang these cards around.
Well, to distract from the situation of emergency, in which I myself plunged you, let's say you osmer and you just need roundabouts, on which you are going to mark the missing addresses, shops, roads. But you want to print not a square area, but an area along your route to work or to college.
Important note: in all these cases you will need a printed card, and you will have to print it, most likely on a black and white lazer screen and in a hurry.
Actually the tutorial itself:
In short: we will use Qgis and Alacarte.
Alacarte will be responsible for drawing a map with a custom style suitable for printing on a BW printer.
In Qgis, we will aggregate data from different sources in different formats and generate map / atlas sheets. In fact, this is what GIS is for.
Lyrical digression about bikes
In fact, my first idea was an application on JAVA for generating atlases. In general, I even wrote something that skillfully split the area into squares of the desired size with a given scale, download map pieces via WMS and insert them into page templates.
Then I thought that it would be nice to add a visual designer, support for TMS, geojson and osm xml and found that I was conceiving the development of a desktop GIS, which even without me is not enough.
Then I thought that it would be nice to add a visual designer, support for TMS, geojson and osm xml and found that I was conceiving the development of a desktop GIS, which even without me is not enough.
1. Download and install:
1. Download and install the latest QGIS www.qgis.org/ru/site/forusers/download.html
Version 1.8 will also work in principle, but with reservations, so it’s best not to be lazy to download the latest.
2. Install the QGIS plugins - GridsForAtlas.
At the time of this writing, there is no version for QGIS 2.0 from the authors of the plugin. I rewrote the plugin for the second version of qgis and added something.
The plugin is here www.dropbox.com/s/vl98wb6fmprti8z/synoptiquesatlas.zip
Since I was modifying someone else's plugin and I don’t know if the authors intended to publish it, the link is not to github. I hope that the authors will make my changes and update the plugin, then it will be available in the main qgis plugin repository.
In the meantime, the plugin will have to be installed manually.
To do this, simply copy the synoptiquesatlas folder from the archive to
3. Install alacrte. github.com/alacarte-maps/alacarte
I'm not a big fan of building something from source, so I just found a repository with deb'koy
https://launchpad.net/~andrew.sh/+archive/alacarte-maps
Binaries under win (thanks to freeExec ).
alacarte-importer - generates from osm-xml a file with data suitable for alacarte-server, which already handles http requests for obtaining map tiles.
4. Swing styles for alacarte
github.com/kiselev-dv/walking-papers.mapcss
bw is a general purpose style for printing in bw.
walking-papers is a style with an emphasis on printing bypass sheets.
5. Download the OSM data for the region whose map we are going to print.
If the community has already dealt with the problem, then the question of where to download the latest data upload, you probably will not have. Most likely, the hourly unloading of the region will be adjusted. (osm-data.xml)
If there are no regular landings with fresh data for the required region
Go to www.openstreetmap.org , zoom in to the region for which data is needed.
Click Export. Next, either click the “Export” button or click on the link to the Ovrpass API.
Better - a link to the Ovrpass API: first, it responds faster, secondly, the area available for download is larger, and third, it loads the primary server less.
Click Export. Next, either click the “Export” button or click on the link to the Ovrpass API.
Better - a link to the Ovrpass API: first, it responds faster, secondly, the area available for download is larger, and third, it loads the primary server less.
If the required area is larger than the Overpass API can return
Download data on the region with download.geofabrik.de or gis-lab.info/projects/osm_dump
And update them to the current state using wiki.openstreetmap.org/wiki/Osmupdate
And update them to the current state using wiki.openstreetmap.org/wiki/Osmupdate
2. Start Alacarte
alacarte-importer -i osm-data.xml [INFO] [Geodata] Serialize to "/home/dkiselev/osm/data.ser" [INFO] [Geodata] Save geodata to "ala.carte" As a result, we get the ala.carte file with the OS data indexed for fast rendering. Alacarte-server
We start the server
sudo alacarte-server -g /home/dkiselev/osm/ala.carte -s walking-papers.mapcss Where
-g /home/dkiselev/osm/ala.carte - the path to the file generated by alacarte-importer
-s walking-papers.mapcss - path to the folder with descriptions of rendering styles
The first time I run alacarte-server from under sudo so that alacarte can create folders in var for caching map tiles. In the future, you can run alacarte-server as a normal user. Or redefine the folder for the cache - server.cache-path and the path to access log'a - logfile
Checking that the server is up and running: localhost: 8080 Must get a picture of Oops! because we did not specify which square of the card we need.
3. Connect the alacarte layer to qgis
In Qgis, there is no native way to open the TMS layer. But you can connect any gdal layer.
Create a file bw.gdal.xml with the following content
<GDAL_WMS> <Service name="TMS"> <ServerUrl>http://localhost:8080/bw/${z}/${x}/${y}.png</ServerUrl> </Service> <DataWindow> <UpperLeftX>-20037508.34</UpperLeftX> <UpperLeftY>20037508.34</UpperLeftY> <LowerRightX>20037508.34</LowerRightX> <LowerRightY>-20037508.34</LowerRightY> <TileLevel>18</TileLevel> <TileCountX>1</TileCountX> <TileCountY>1</TileCountY> <YOrigin>top</YOrigin> </DataWindow> <Projection>EPSG:3857</Projection> <BlockSizeX>256</BlockSizeX> <BlockSizeY>256</BlockSizeY> <BandsCount>3</BandsCount> <Cache /> </GDAL_WMS> If you plan to use other styles, such as walking-papers, create 1 file for each (wp.gdal.xml for example) and change the query string pattern.
http: // localhost: 8080 / walking-papers / $ {z} / $ {x} / $ {y} .png In principle, this way you can connect any TMS layer in qgis.
Next, run Qgis, add a raster layer .
Choose our xml bk.gdal.xml
Projection: EPSG: 3857 (She’s EPSG: 900913 is a pseudonym for 3857 that resembles google)
We check the project projection.
Project - Project Properties - Coordinate System
If not selected, enable automatic reprojection of coordinates, select EPSG: 3857
This is done so that the projection of the project and the layer coincide and there is no reprojection of the raster layer, which we are actually going to print.
In principle, you can use your layer in EPSG: 3857 in a project from another ck, gdal will helpfully reproject it to you. But it should be understood that when reprojecting, the quality of the image suffers significantly, especially the signatures will suffer.
Next, zoom in closer to the place that we are going to print, and click “increase to the best scale 100%”. This aligns the qgis and alacarte scale lines, in addition to reprojection, to avoid excessive scale for the image.
4. Prepare the area (s) of coverage
Suppose we print an atlas.
Those. We will need a set of rectangular areas with a small overlap for each page of the atlas, covering the part of the map that is interesting to us. Links between pages (this is very convenient when you know which page is below and do not flip through the entire atlas). And, perhaps, an alphabetical index, with the names of streets (shops, hospitals, schools, etc.) and page numbers where this street can be found.
First, we need to specify the area of our interest - the atlas, which we are going to print.
Click to create a shape-file.
Type - polygon,
Coordinate System - EPSG: 3857
The rest is the default.
Choose a name for the shape of the file, I called the cover. We save. A new layer has appeared.
Select the newly created vector layer, turn on the editing mode.
We click add object and, by clicking on the points, create a polygon.
Complete creation - right click. After adding you will be asked to fill in the fields. We have one - id.
You can create multiple areas for printing.
Turn off the editing mode (the same button that was used), save the changes to the shape file.
This is how the result looks like for me, if you make the cover fill translucent.
Hide the layer so that it does not print.
5. Preparing the page layout
Select Project - Create layout.
This will be the layout of one sheet of our atlas. I called it page.
Select the size and orientation of the sheet. Add an item map.
Map can be pozumit mouse wheel.
Do not be greedy, leave the fields, we still need them for links to adjacent pages.
You can close the page layout for now.
6. Preparing the grid for printing
Printing atlases in qgis is constructed as follows: you select a layer, and then for each object of the layer, the page is rendered either at a constant scale or in order to fit the object in the map.
For a classic atlas, we need a grid of rectangles corresponding to the size and scale of the map of our page layout. Fortunately, there is a plugin that will do this for us.
We include our layer from the fourth step with the coverage area.
Run: Modules - Grids for Atlas - Grids for Atlas
The plugin can generate 2 types of grid:
classic grid and dynamic grid
The classic grid is a regular grid of rectangles.
dynamic grid - the rectangles are moved so that the sheet can be optimally used for printing.
Coverage layer - a layer with area / areas of coverage.
Compozer page layout
Compozer map object - selected by the machine. If you have more than one card per sheet, select the one you need.
Outfiles directory - the plugin will create layers and corresponding files. This is the path to the directory where the files of the layers with grids will be saved.
Overlap% - overlapping grid cells.
Overlap percentage can be set both when printing and when generating a grid. For the grid, it is needed if you are going to build an alphabetical index of objects for your atlas. Then the grid cells will correspond to print areas 1 to 1 and objects that fall into the overlapping area of the cells will be on all pages on which they are printed. In this case, when printing, specify the fields 0%.
As a result, we get a layer with a grid of rectangles.
7. Finish the page layout and click print.
Go back to our page layout.
Project - Layouts of maps - page (if you named your layout page).
Add page numbers and links to adjacent pages.
Open the Atlas tab.
Select the coverage layer - dynamic grid (or the classic grid if you generated a classic grid at the last step).
Scaling - by the size of objects with a field of 0% (or leave the field if you generated the grid without overlapping cells).
Next, add the text. Add text elements.
In the properties of the object, click Insert expression, and expand the Fields and values item. If you selected the correct layer on the atlas tab as the coverage layer, then the field list will contain all the fields of the dynamic grid layer.
ID_MAILE - cell ID. Countdown from zero.
above, below, left, right, etc. - links to adjacent grid cells.
Since the countdown is from scratch - you need to add 1 everywhere.
Here are the properties of the signature containing the number of the upper left page and a piece of the map element.
So, for the number of the current page in the properties of the element should be:
. [% "ID_MAILLE" + 1 %] For the page number on the right:
[% "right" + 1 %] If there is no adjacent cell, the fields will be empty.
Go back to the Atlas tab, put a tick to create a multipage document in Export. In the top toolbar, select export to PDF. Choose where to save pdf.
Conclusion
The tutorial turned out to be quite long, if you are not doing this for the first time, it takes 10 - 15 minutes from the moment you install all the programs and download the data until you have an atlas. And remember, if the situation that I described at the beginning of the tutorial is real, it is much more useful to check whether you took everything in the last half hour before leaving. Atlas will make you a responsive osm community.
In the second part we will build an alphabetical index, let's talk about how to change the style for Alacarte. How to add layers with additional information and how to add a minimap to make it clear which part of the city is printed on the page.
Source: https://habr.com/ru/post/211524/
All Articles