Qwt and Qt Creator. Quick and easy. Part 1: Data Visualizer
To understand this article, the reader must have initial experience in developing windows applications in the Qt Creator environment.
The examples use Qt Creator 3.0.0 (MinGW) and Qwt-6.1.0.
Qwt is a graphic library that allows you to significantly simplify the process of data visualization in the program. Simplification is as follows: there is no need to manually prescribe display elements, such as scales of coordinates, grids, data curves, and so on. It is only necessary to set the parameters of these elements.
Analogy: in order to build a graph in Excel, you select data and adjust the display parameters: minimum and maximum scales, color of curves, data labels, etc. Excel is responsible for the visualization - you do not program the elements themselves.
I note especially that Qwt allows you to work with fairly large amounts of data (I worked with 200,000 points) without the appearance of annoying “brakes”.
In this article we will display the curve on the graph, scale it, move around the graph, watch the coordinates of the cursor. Thus, we implement the minimum functionality necessary for displaying and viewing graphs. In subsequent articles, our graphic editor will be equipped with additional features.
')
Such instructions on the Internet, of course, there is. But they are very few. In large quantities there is information on solving various problems with Qwt, which is useful only to those programmers who already have solid basic skills in working with the library. In this article, I have assembled scattered pieces of code examples that allow you to create a simple graph visualizer.
Let's get down to it.
Stage 1: Connect Qwt to Qt Creator
(tested for Win 7 x64 and Win 8.1 x64).
- Install Qt Creator 3.0.0 (MinGW). The default directory did not change.
- Download Qwt-6.1.0 and unzip to the root directory C: \. When unpacking to another directory, I get incomprehensible errors.
- Right-click on "My Computer" and select "System". Further "Additional settings" and click on the "Environment Variables" button. In the list of "system variables" select Path, click "edit".
- Put the “;” sign after the last entry and add the following text (without quotes): “C: \ Qt \ Qt5.2.0 \ 5.2.0 \ mingw48_32 \ bin; C: \ Qt \ Qt5.2.0 \ Tools \ mingw48_32 \ bin; C: \ Qwt-6.1.0-rc3 \ lib ".
- Here, under the “Custom Variables” list, click “New” and add a couple of the following variables:
Name: QT_PLUGIN_PATH
Value: C: \ Qwt-6.1.0-rc3 \ plugins
Name: QMAKEFEATURES
Value: C: \ Qwt-6.1.0-rc3 \ features
Note: the folder "C: \ Qwt-6.1.0-rc3" does not exist yet. It will be subsequently created. Now there is only "C: \ qwt-6.1-rc3". - Run the command prompt, go to the directory "C: \ qwt-6.1-rc3".
- Sequentially enter, execute and wait for the completion of the following commands: "qmake", "mingw32-make", "mingw32-make install". After the last command, the folder “C: \ Qwt-6.1.0-rc3” should appear.
- To restart a computer.
Stage 2: using the Qwt library.
Step 1: Preparing the environment.
- Create a Qt Widgets Application project in Qt Creator (a class based on QMainWindow). The name of my project was: “Qwt_howTo”.
- Find the file with the extension “.pro” in the project file tree and add the line “CONFIG + = qwt” to the bottom (hereafter, the quotes are not part of the syntax and are used only for readability).
- Right-click on the root folder with the name of the project and select "Run qmake".
Steps 2 and 3 should be performed for each project in which the Qwt library is supposed to be used.
Step 2: Implement Qwt Features
The main.cpp file is left unchanged. In this example, the code will be written in the mainwindow.cpp file. This is not quite elegant, but acceptable as an example.
1. Add the following lines to the beginning of the mainwindow.cpp file:
#include <qwt_plot.h> #include <qwt_plot_grid.h> #include <qwt_legend.h> #include <qwt_plot_curve.h> #include <qwt_symbol.h> #include <qwt_plot_magnifier.h> #include <qwt_plot_panner.h> #include <qwt_plot_picker.h> #include <qwt_picker_machine.h> If these headers are underlined with the words “File not found”, it means that you have not completed step 3 of step 1.
2. Now we will write code only in the MainWindow constructor. It would be possible to break the code into methods, but in the framework of the teaching example I did not do that.
Create the main graphics field:
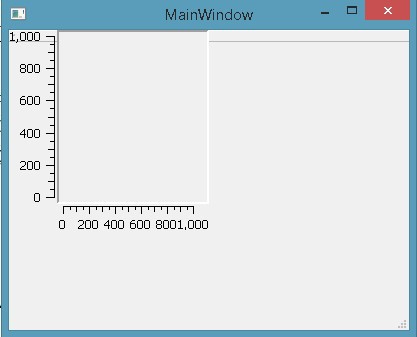
MainWindow::MainWindow(QWidget *parent) : QMainWindow(parent), ui(new Ui::MainWindow) { ui->setupUi(this); // // (this) - // #include <qwt_plot.h> QwtPlot *d_plot = new QwtPlot( this ); } We compile, run and see a not very nice image:
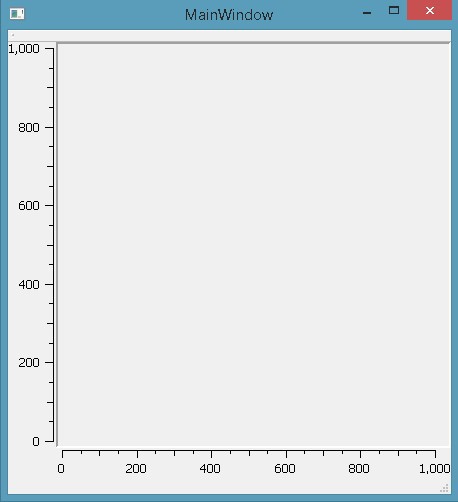
Add a line:
setCentralWidget(d_plot); // We start. We try to maximize the window to full screen, the field of graphics is also expanded to full screen with appropriate scaling. Not bad!
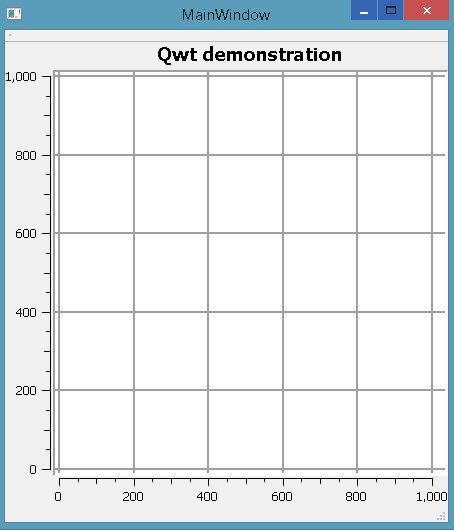
3. Paint a field by adding the following lines of code:
d_plot->setTitle( "Qwt demonstration" ); // d_plot->setCanvasBackground( Qt::white ); // // d_plot->setAxisTitle(QwtPlot::yLeft, "Y"); d_plot->setAxisTitle(QwtPlot::xBottom, "X"); d_plot->insertLegend( new QwtLegend() ); // // #include <qwt_plot_grid.h> QwtPlotGrid *grid = new QwtPlotGrid(); // grid->setMajorPen(QPen( Qt::gray, 2 )); // grid->attach( d_plot ); // The result of the launch (the field already looks pretty nice):
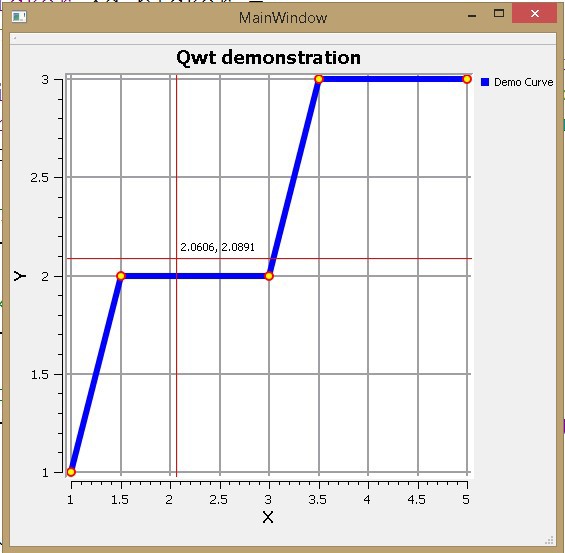
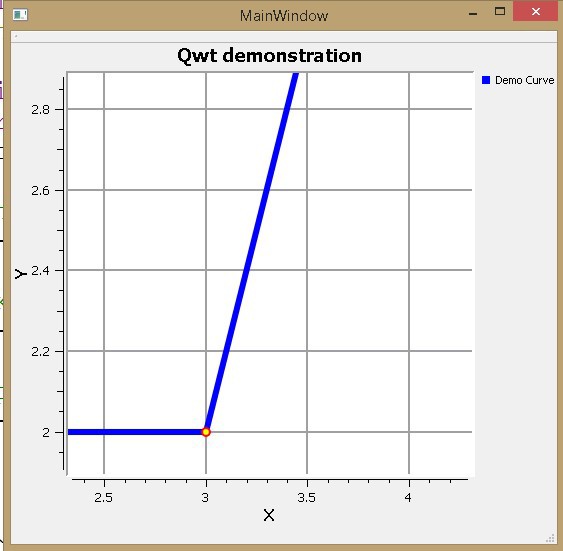
4. Add a chart
// //#include <qwt_plot_curve.h> QwtPlotCurve *curve = new QwtPlotCurve(); curve->setTitle( "Demo Curve" ); curve->setPen( Qt::blue, 6 ); // curve->setRenderHint ( QwtPlotItem::RenderAntialiased, true ); // // // #include <qwt_symbol.h> QwtSymbol *symbol = new QwtSymbol( QwtSymbol::Ellipse, QBrush( Qt::yellow ), QPen( Qt::red, 2 ), QSize( 8, 8 ) ); curve->setSymbol( symbol ); // QPolygonF points; points << QPointF( 1.0, 1.0 ) // x, y << QPointF( 1.5, 2.0 ) << QPointF( 3.0, 2.0 ) << QPointF( 3.5, 3.0 ) << QPointF( 5.0, 3.0 ); curve->setSamples( points ); // curve->attach( d_plot ); // Result:

I note that the minimum and maximum axes are determined automatically. This is a pleasant surprise! Of course, you can set these values manually, for example, like this:
d_plot->setAxisScale(QwtPlot::xBottom, 0, 10); 5. All this is good, but we are used to the fact that there is a possibility of approaching / deleting a chart as well as moving around its field. No problem! Just a few lines, and this functionality appears in our editor:
// / // #include <qwt_plot_magnifier.h> QwtPlotMagnifier *magnifier = new QwtPlotMagnifier(d_plot->canvas()); // , / magnifier->setMouseButton(Qt::MidButton); // // #include <qwt_plot_panner.h> QwtPlotPanner *d_panner = new QwtPlotPanner( d_plot->canvas() ); // , d_panner->setMouseButton( Qt::RightButton ); Scale and move:
6. Finally, activate the ability to determine the coordinates of the cursor:
// // // #include <qwt_plot_picker.h> // QwtPlotPicker *d_picker = new QwtPlotPicker( QwtPlot::xBottom, QwtPlot::yLeft, // QwtPlotPicker::CrossRubberBand, // QwtPicker::ActiveOnly, // / d_plot->canvas() ); // // d_picker->setRubberBandPen( QColor( Qt::red ) ); // d_picker->setTrackerPen( QColor( Qt::black ) ); // d_picker->setStateMachine( new QwtPickerDragPointMachine() ); Findings:
Quite a bit of coding, mainly in the appearance settings of the viewer, and we have implemented the basic functionality.
What's next? If interest is shown in this topic, then in the following articles I can talk about how:
1. Display the coordinates of the cursor in the status bar, as well as save these coordinates in separate variables.
2. By clicking the mouse to put dots in the area of the cursor.
3. Add control buttons and something else.
PS: in the folder “C: \ qwt-6.1-rc3 \ examples” there is the source code and .exe files of many interesting examples of Qwt applications. Code without comment.
References (English):
Official resource:
qwt.sourceforge.net
Collection of solutions of various problems with Qwt:
www.qtcentre.org/archive/index.php/f-23.html
Library variant, alternative Qwt (thanks, GooRoo !)
www.qcustomplot.com
Source: https://habr.com/ru/post/211204/
All Articles