Analyzing traffic sources to increase conversion
 This article will discuss how to correctly analyze traffic sources, for example, using Google Analytics tools or Yandex Metrica. Turning off sources with low or zero conversion, you can significantly increase the overall conversion, reduce the cost of the order and improve the profitability of online advertising.
The purpose of this article is to get feedback and comments on the methods described below, to describe ways to make informed decisions about blocking poor quality traffic sources.
So, suppose that we decided to organize our own small business selling, for example, books, via the Internet. We have created a wonderful user-friendly website, having entered it is simply impossible not to buy something. Googling reviews, we chose one of the many ad networks as a source of low-cost traffic for our store. As a rule, all ad networks do not have their own traffic, but buy it from various sources. The quality of traffic from different sources can be extremely diverse. On some sources there may be the most blatant cheat, from which no conversion will not have to wait. From other sources, there are random clicks, not target transitions. On third sources, the audience is interested in seeds and bits, not books. On the fourth sources, on the contrary, lovers of books are concentrated, for which our resource will be just a godsend, and the conversion will exceed all expectations.
Usually, all developed ad networks provide access to their sources through UTM markup and provide an opportunity to block sources that we don’t like. We can only learn to correctly find those poor-quality sources, without shutting down which we will throw our money away, or even go bankrupt. In addition, competent optimization of sources will allow us to reduce advertising costs, we will be able to lower the price of the goods and become much more competitive in the market.
')
I would like to emphasize that the sources in this article do not mean channels, such as Google AdWords, Yandex Direct or teaser ads, but sources (platforms) within the channel itself. For example, we chose some kind of advertising network from which we buy traffic. This network provides us with traffic from hundreds of independent sources and the challenge is to understand which sources are not suitable for our project. You can, of course, compare the channels with one another in this way, but they are usually not so many and can be dealt with manually.
We had to repeatedly come across a poorly substantiated approach to the analysis of sources, which is called "by eye". In one of the variations of this method, sources that simply do not give any conversion are turned off, for example, from 100 visits (this number pretends to be in the mind). Or, for example, this number of visits give a conversion below 0.1% (the number also pretends to be in the mind). In fact, these are the right approaches, except for “thinking about the mind”, which can lead to different mistakes. Particularly acute is the situation when one has to bear personal responsibility for the decisions made. In this case, it is very important to be able to justify why these sources were blocked, and those were not. “It seemed” here would be extremely inappropriate. This article will describe how to justify these values and minimize the risks of turning off a completely good source.
To begin with, we should determine the permissible errors. The statistics consider the error of the first kind and the error of the second kind .
In our case, the error of the first kind is when, due to accidental circumstances, we do not turn off the bad source. For us, a mistake of this kind is not critical: they did not block today - we block tomorrow, when random circumstances blow in the right direction.
More critical for us is the error of the second kind. In our case, this is the moment when, due to accidents, we will block a good source. This is critical because after blocking the traffic from it will stop, and it will no longer have a chance to prove that it was actually good.
The probability of such an error B is usually chosen 5% or 1% depending on the situation. If the situation is critical, advertising does not pay off, serious amounts go, then you can arm yourself with the probability of blocking a good source of 5% or even 10%. If the situation is stable, but just want to optimize the sources, it is better to choose 1% to minimize the loss of good sources. The level of permissible errors of 1% will require us to significantly more traffic for statistics than the level of 5%.
I would like to note that if we chose an error level, for example, 5%, this does not mean at all that we will lose 5% of good sources. This means that in case of boundary (and unlikely) situations, we will lose no more than 5% of good sources from those that we block.
The next step is to determine the critical level of conversion Ccr - traffic with a conversion, below which we are not ready to buy. Sources with a conversion below this value will be disabled. But sources with a conversion above this value should in no case be turned off (or rather, the probability of turning off such sources should not be higher than acceptable B). If we are engaged in source optimization, we can select Ccr as 30% of the current average conversion value.
Once we have decided on the basic values, we can run ads and observe the situation in Analytics or in the Metric. In order to collect statistics, you need to lay under a certain budget.
The first method of detecting low-quality sources is especially effective at the first stage - this is the identification of sources that have not brought a single conversion, but have already collected a sufficient number of visits. Calculate the threshold number of visits, above which it is already possible to block sources (if they did not bring any conversion).
Suppose that some source has that critical level of Ccr conversion. Then the probability that the order will not occur during the visit will be 1-Ccr. And the probability that no order will occur at N visits will be

We equate this probability to the admissible level of error probability B, which we determined at the very beginning. Then, at the critical value Ncr, we just get this value.

To find Ncr, we need to log both parts of the expression and, in fact, find Ncr
 (one)
(one)Instead of the natural logarithm, you can also use binary or decimal in calculations, if that is easier. So, having determined the critical value of the number of visits to Ncr, we can safely turn off all sources that have exceeded this number of visits and have not given a single conversion, and there is no need to worry - the risk that we turn off a good source is nothing more than that asked yourself.
By turning off substandard sources in the first way and feeling the joy of improving the envelope and the bitterness of reducing traffic volumes, we can move on to the second, more complex (computationally) way of finding substandard sources.
Suppose that some sources significantly exceeded the critical value of Ncr, brought orders, but their conversion seems low to us. We cannot block them by the first method, but, perhaps, their true conversion (which we do not know) is still lower than the critical one we have established for ourselves. Let's try to find such sources with acceptable risks B.
We cannot block sources only because their conversion is lower than Ccr, since sources with a conversion higher than Ccr may accidentally show such a conversion. To eliminate this, we must block sources whose conversion is slightly lower than Ccr and must be less than some boundary value Cx. By changing the value of Cx, we will be able to ensure that the probability of blocking sources whose conversion is higher than Ccr will not be higher than what we specified B. Let us try to calculate this boundary value Cx.
The number of orders on a fixed sample with a fixed conversion (and we just have these conditions) will obey the binomial distribution
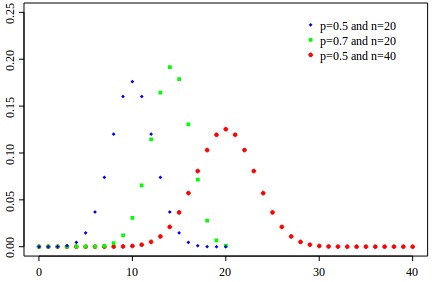
As is well known, with significant n (number of visits), the binomial distribution tends to normal with the expectation m = n * p and the variance D = s ^ 2 = n * p * q (p, in our case, this is conversion, and q = 1- p).
Suppose that some source has a critical Ccr conversion value. Then the probability of the fact that at n visits it will show a conversion of Cx or less is equal to:
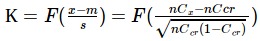
According to the tables of the normal distribution or using the numpy package in python, we find the corresponding quantile K - such values of the normal function for which the probabilities correspond to the permissible errors B:
>>>from scipy.stats import norm >>> norm.ppf(0.05) -1.6448536269514729 >>> norm.ppf(0.01) -2.3263478740408408 Then we get:
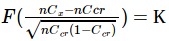
From
 (2)
(2)Thus, if the current conversion of the source with the corresponding number of visits is below the boundary Cx, then the source must be blocked.
If n is small, then Cx may turn out negative. This means that this number of visits is not enough to assess the sources. From the formula it is clear that with an increase in the number of visits, n x will tend to Ccr from below, which is logically expected.
It’s very difficult to calculate Cx for each source manually, so I’ll quote the source code of a simple python script that handles csv uploads from Analytics and appends a column with Cx boundaries for further analysis and search for sources to block:
#!/usr/bin/env python # -*- coding: utf-8 -*- import csv import math from scipy.stats import norm # , , file_in = 'in.csv' # file_out = 'out.csv' # !! % , Ccr = 1.0 # - ( ) B = 0.05 # , ( - 1) column_source = 1 # , column_n = 2 # , column_c = 4 K = norm.ppf(B) Ccr = float(Ccr) / 100 # , 0, : column_source -=1 column_n -=1 column_c -=1 out_data = [] with open(file_in, 'rb') as csvfile: reader = csv.reader(csvfile, delimiter=',') for i, row in enumerate(reader): # , if not i: out_data.append([row[column_source], row[column_n], row[column_c], 'Cx, %']) continue n = row[column_n] n = n.replace(' ', '') n = int(n) C = row[column_c] # - , # , C.replace('%', '') C.replace(',', '.') Cx = Ccr + K * math.sqrt(Ccr * (1 - Ccr) / n) Cx = round(Cx * 100, 3) out_data.append([row[column_source], str(n), C, str(Cx)]) with open(file_out, 'wb') as csvfile: writer = csv.writer(csvfile, delimiter=',', quoting=csv.QUOTE_MINIMAL) for row in out_data: writer.writerow(row) Consider the following simple example of source analysis. Suppose we have 8 sources with such data:
| A source | Visits | Orders | Conversion,% |
|---|---|---|---|
| one | 844 | 3 | 0.355 |
| 2 | 751 | 47 | 6.258 |
| 3 | 520 | one | 0.192 |
| four | 397 | 40 | 10.076 |
| five | 315 | 0 | 0 |
| 6 | 301 | 0 | 0 |
| 7 | 162 | eight | 4.938 |
| eight | 12 | 0 | 0 |
Perhaps the example looks somewhat artificial, because here and “by eye” you can see where something needs to be blocked. This is so because, firstly, there are few of them here, and secondly, their properties are pronounced. In practice, the mass of boundary cases, when even the most experienced "eye" will necessarily make the wrong decision.
So, the total conversion of this system = m = The sum of all orders / The sum of all visits = 2.998%
Choose a critical value as 0.3 * m = 1%
According to the formula (1) we calculate the threshold value, which can be used to separate sources with zero conversion.
Ncr = ln (0.05) / ln (1-0.01) = 298
Now we are looking for sources whose conversion is 0 and the number of visits is more than 298. We have 2 such sources: 5 and 6. We block them by the first sign.
We cannot disable source 8 on this basis, because, despite the fact that there is a conversion of 0, there were very few visitors, and we cannot be sure that its true conversion is actually below the critical one. Perhaps, in fact, its conversion is even higher than that of source 7, despite the fact that it shows very good results.
We now turn to the second sign.
Calculate the boundary value of the conversion for the first source by the formula (2):
Cx = 0.01 + (-1.64) * sqrt (0.01 * (1-0.01) / 844) = 0.00438 = 0.438%
Thus, the current conversion of this source is below the boundary, and we can, with an error probability of no more than 5%, state that the conversion of this source is below the critical one. Thus, this source is subject to blocking.
In order not to manually count the remaining 7 conversions, I use the script above. Save the original data in the file in.csv. Carefully review and configure the variables at the beginning of the script, run calc.py and see the results in out.csv, which will show us the following result:
| A source | Visits | Conversion,% | Cx,% |
|---|---|---|---|
| one | 844 | 0.355 | 0.437 |
| 2 | 751 | 6.258 | 0.403 |
| 3 | 520 | 0.192 | 0.282 |
| four | 397 | 10.076 | 0.179 |
| five | 315 | 0 | 0.078 |
| 6 | 301 | 0 | 0.057 |
| 7 | 162 | 4.938 | -0.286 |
| eight | 12 | 0 | -3.724 |
Comparing the current and boundary conversions, we can see that source 3 is also subject to blocking.
It is also interesting to note that sources 5 and 6 again fall under blocking. This is understandable, since method 2 does not contradict method 1, but extends it in case the current conversion of the source is not 0.
Boundary conversion of sources 7 and 8 below zero. This means that with the number of visits that those sources currently have, they cannot be blocked for any number of orders (well, except for negative orders). Their number of visits is not enough to make any predictions with an acceptable probability of error.
This is how we can provide a mathematical justification for our decisions on blocking sources. It should be noted, of course, that for successfully blocking sources with an error probability no higher than a given one, a sufficiently high number of visitors from the source being analyzed is needed. For example, if cr is set to 0.38%, then turning off this source due to the absence of an envelope will require at least 787 transitions. And, for example, for the boundary conversion of Cx = 0.119 with the same values, about 1500 visits from this source are required. But the visits are not analyzed in one day, sometimes even a month, so only recently launched advertising campaigns can expect such difficulties. In addition, there are ways to significantly improve the sensitivity, but this topic is probably another article.
I would appreciate an indication of errors and inaccuracies. Successful advertising campaigns!
Source: https://habr.com/ru/post/210946/
All Articles