How statistics help make Yandex.Probki better
How are Yandex.Probki? Where does the baseline traffic data come from? How do they turn into traffic jams? Is information about traffic always reliable? How to check it? And most importantly, how to make traffic data more accurate? For all this, statistics is used in Traffic Jams: science is both strong and insidious. In this lecture , Yandex.Probok analyst Leonid Mednikov tells students how to distinguish reliable results from random ones, and how statistics are used in various practical tasks.
The principle of Yandex.Probok is quite simple. To describe it does not require a separate lecture. Yandex.Maps and Yandex.Navigator applications using GPS determine the location of the device on which they are running, and transmit this information to the server. And he, in turn, on the basis of these data creates a picture of traffic jams.
')

But how exactly does this happen? This is a completely non-trivial process, which requires the use of special algorithms and statistics. How to distinguish a slow-moving motorist from a pedestrian or a cyclist? How to make sure the accuracy of the transmitted information? And most importantly, how to make traffic data more accurate?
The very first problem that one encounters when drawing up a map of traffic jams is that GPS technology is far from ideal and does not always exactly determine its location. By tracking the movements of a single object, one can get rather strange data: instant movements over fairly long distances, transition to the shoulder, etc. As a result, we can get the following picture:
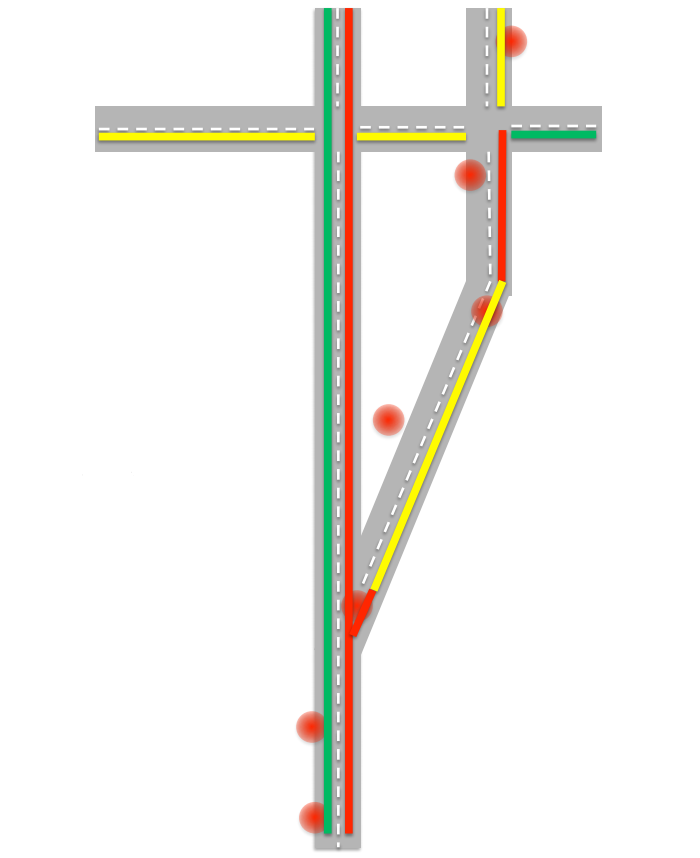
The algorithm needs to decide that this is what it was. To clarify the data, the algorithm will try to find the most likely route allowed by the rules. Next you need to determine what object we have? After all, in a traffic jam, cars can drive at a pedestrian speed, and the accuracy of GPS does not allow one to say with confidence whether an object is moving on the roadway or on the side of the road. Here you can take into account several factors: firstly, if the number of objects moving at low speed is large enough, then we can assume that there really is a traffic jam on this road and cars are going slowly. We can also take into account the history of the speed of movement of the object over the past few hours. For example, if an object has not reached a speed of more than 10-15 kilometers per hour in the last four hours, then this is most likely a pedestrian.
So, we determined the speed of movement of machines in a certain direction over a period of time, processed them with special algorithms, averaged and eventually obtained an approximate total speed of flow. All this happens in real time and on a stream of hundreds of thousands of cars.
As we said above, algorithms are involved in determining the type of an object, its speed, and averaging the speed of a stream. But how to assess the quality of their work, to understand which way to move in order to improve them?
The first problem is solved by launching test cars into the city. Like regular users, they send data about their movements, but at the same time we know for sure what the real conditions were. After that, based on metrics, you can compare the real map of traffic jams at a certain site with the calculated algorithms, and determine how well the system is doing its job.
Comparing the real situation with the results of the work of several algorithms at once, we can estimate which one is better. Suppose we are testing a new algorithm and comparing it with the old one. We run it on 67 segments and get the following results:

In 54 cases, the new algorithm worked better than the old, and in 13 - worse. By the percentage of correct answers and errors, the new algorithm is clearly better. Now imagine that we add another algorithm to the comparison. But he drove on a smaller number of segments - on six.

The percentage of hits and errors he has even better than the first. But is it worth trusting verification on such a small number of segments? To clearly answer this question, we turn to statistics.
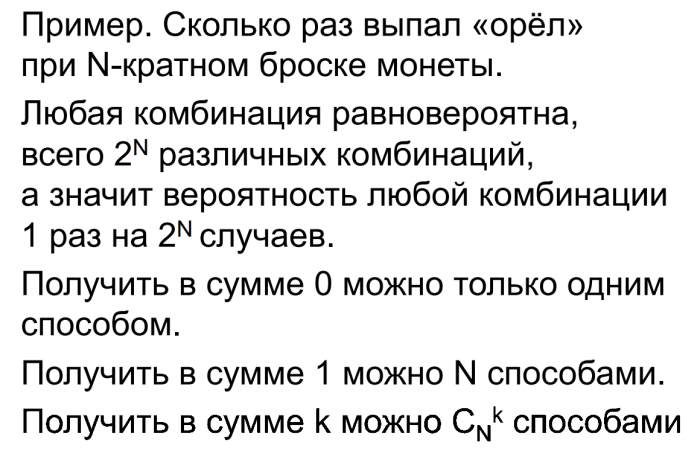
First, let's deal with random values. Suppose we toss a coin three times. The eagle is taken as zero, and tails - for one. In total, we can get eight combinations. If we calculate the sum of the dropped out values for each of the combinations, we will see that the extreme values fall out least of all, and as we approach the center, the probability increases.
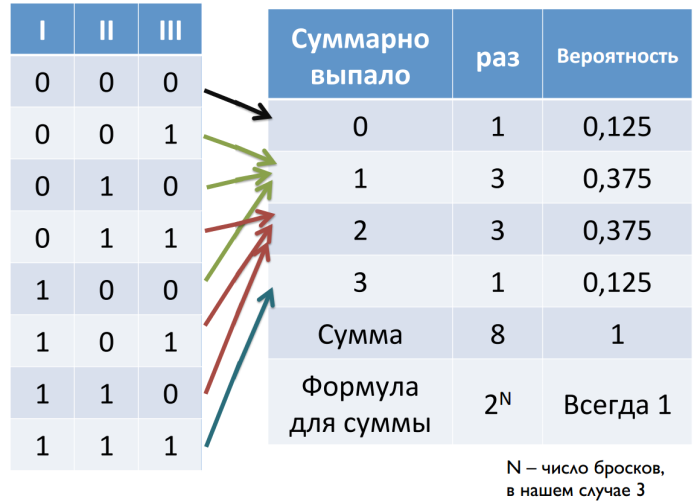
Now consider an example in which we throw a coin N times. The number of objects we take for k, and the number of combinations - for C.
Now we will set another task. Imagine that we have a coin, and we want to understand if it is flat, i.e. whether it falls on each side with equal probability. To test this hypothesis, we will be a coin toss. If a coin is flat, then the more times we throw a coin, the closer to the average indicator there should be the greatest number of results. At the same time, on a low number of shots, the probability of making an incorrect conclusion is much higher.
Why do we even talk about accidents? After all, errors in the construction of a map of traffic jams most often occur for some objective reasons. But not all of these reasons are known to us. If we knew all the reasons, we could create an ideal algorithm, and never improve it again. But until this happens, we are forced to take some errors of the algorithms for random variables. Therefore, we check how much better the algorithm began to work with approximately the same apparatus as the hypothesis with a flat coin. Only in this case, as a base hypothesis, we accept that the algorithm has not changed at all. And then with the help of the data run through the algorithm, we determine whether there are any distortions in one direction or another. And just as in the case of the coin, it is important that such runs be as large as possible, otherwise the probability of making a mistake will be too high.
If we return to our example with two algorithms, we can still say with confidence that the first new algorithm is better than the old one. But the second is more doubt, despite the fact that the percentage ratio of correct answers and errors is better for him. Perhaps it does work better, but to make sure of this, you need to carry out more checks.

The principle of Yandex.Probok is quite simple. To describe it does not require a separate lecture. Yandex.Maps and Yandex.Navigator applications using GPS determine the location of the device on which they are running, and transmit this information to the server. And he, in turn, on the basis of these data creates a picture of traffic jams.
')
But how exactly does this happen? This is a completely non-trivial process, which requires the use of special algorithms and statistics. How to distinguish a slow-moving motorist from a pedestrian or a cyclist? How to make sure the accuracy of the transmitted information? And most importantly, how to make traffic data more accurate?
The very first problem that one encounters when drawing up a map of traffic jams is that GPS technology is far from ideal and does not always exactly determine its location. By tracking the movements of a single object, one can get rather strange data: instant movements over fairly long distances, transition to the shoulder, etc. As a result, we can get the following picture:
The algorithm needs to decide that this is what it was. To clarify the data, the algorithm will try to find the most likely route allowed by the rules. Next you need to determine what object we have? After all, in a traffic jam, cars can drive at a pedestrian speed, and the accuracy of GPS does not allow one to say with confidence whether an object is moving on the roadway or on the side of the road. Here you can take into account several factors: firstly, if the number of objects moving at low speed is large enough, then we can assume that there really is a traffic jam on this road and cars are going slowly. We can also take into account the history of the speed of movement of the object over the past few hours. For example, if an object has not reached a speed of more than 10-15 kilometers per hour in the last four hours, then this is most likely a pedestrian.
So, we determined the speed of movement of machines in a certain direction over a period of time, processed them with special algorithms, averaged and eventually obtained an approximate total speed of flow. All this happens in real time and on a stream of hundreds of thousands of cars.
Algorithms
As we said above, algorithms are involved in determining the type of an object, its speed, and averaging the speed of a stream. But how to assess the quality of their work, to understand which way to move in order to improve them?
The first problem is solved by launching test cars into the city. Like regular users, they send data about their movements, but at the same time we know for sure what the real conditions were. After that, based on metrics, you can compare the real map of traffic jams at a certain site with the calculated algorithms, and determine how well the system is doing its job.
Comparing the real situation with the results of the work of several algorithms at once, we can estimate which one is better. Suppose we are testing a new algorithm and comparing it with the old one. We run it on 67 segments and get the following results:
In 54 cases, the new algorithm worked better than the old, and in 13 - worse. By the percentage of correct answers and errors, the new algorithm is clearly better. Now imagine that we add another algorithm to the comparison. But he drove on a smaller number of segments - on six.
The percentage of hits and errors he has even better than the first. But is it worth trusting verification on such a small number of segments? To clearly answer this question, we turn to statistics.
Statistics
First, let's deal with random values. Suppose we toss a coin three times. The eagle is taken as zero, and tails - for one. In total, we can get eight combinations. If we calculate the sum of the dropped out values for each of the combinations, we will see that the extreme values fall out least of all, and as we approach the center, the probability increases.
Now consider an example in which we throw a coin N times. The number of objects we take for k, and the number of combinations - for C.
Mean and observed mean
Now we will set another task. Imagine that we have a coin, and we want to understand if it is flat, i.e. whether it falls on each side with equal probability. To test this hypothesis, we will be a coin toss. If a coin is flat, then the more times we throw a coin, the closer to the average indicator there should be the greatest number of results. At the same time, on a low number of shots, the probability of making an incorrect conclusion is much higher.
Why do we even talk about accidents? After all, errors in the construction of a map of traffic jams most often occur for some objective reasons. But not all of these reasons are known to us. If we knew all the reasons, we could create an ideal algorithm, and never improve it again. But until this happens, we are forced to take some errors of the algorithms for random variables. Therefore, we check how much better the algorithm began to work with approximately the same apparatus as the hypothesis with a flat coin. Only in this case, as a base hypothesis, we accept that the algorithm has not changed at all. And then with the help of the data run through the algorithm, we determine whether there are any distortions in one direction or another. And just as in the case of the coin, it is important that such runs be as large as possible, otherwise the probability of making a mistake will be too high.
If we return to our example with two algorithms, we can still say with confidence that the first new algorithm is better than the old one. But the second is more doubt, despite the fact that the percentage ratio of correct answers and errors is better for him. Perhaps it does work better, but to make sure of this, you need to carry out more checks.
Source: https://habr.com/ru/post/210240/
All Articles