Let's put in a word about debugging and profiling [PHP]
Everything comes from laziness. You have received someone else’s very large project in which you need to make small edits, or you wrote a script and it’s not immediately obvious that it still needs optimization. How to be? Reading and analyzing the code, displaying each step on the screen or in a file (var_dump (), etc.) is not always effective, because you can use debugging tools, which are very numerous today. Briefly list the common ...
Xdebug Debugger and Profiler Tool - PHP extension. Requires installation on the server and settings. It can display: function call stack, memory allocation. Features: profiling, code coverage analysis, protection from endless recursion, interactive script debugging. Xdebug log visualization software: Webgrind is a web interface for Xdebug profiling written in PHP, MacGDBp is a Mac OS X client that allows you to debug PHP applications using Xdebug. Linux GUI kcachegrind . Free. Integrates with many IDE. See Profiling PHP Applications With xdebug . When you enable the option in php.ini:
will format the var_dump () output and error messages.
Xhprof is a PHP extension from facebook. Requires installation on the server and settings. Allows you to collect the execution time of each function, memory usage, waiting time, the number of calls and more. This extension is available from the PECL repository . You can read the documentation here [tyts] . Also Profiling and debugging php-applications using xhprof & FirePHP . Of the advantages, it does not heavily load the system, you can put it to battle. Free.
')
DBG (PHP Debugger and Profiler) - PHP extension. Requires installation on the server and settings. Allows you to work on a test or / and production server and debug scripts locally or remotely, from an IDE or console. Paid / free version.
ZendDebug is a PHP extension, part of Zend Studio (paid IDE). Requires installation on the server and settings. It allows almost everything, too, as xdebug, GUI in IDE Zend Studio or Zend Server. Paid. Below we consider it in more detail.
Memtrack is a PHP extension. Lets you look for memory leaks. It is convenient to check the scripts run on the crown or as a demon. Free. See [tyts]
APD Advanced PHP debugger - PHP extension. Weak competitor xdebug, but has the ability memtrack. It integrates poorly with the IDE, but it has a console interface (see [ tyts ]). Free.
DTrace + PHP is a PHP extension. Low level debugging. See [tyts] . Just do not forget about the existence of Strace and other system debuggers, which are sometimes able to show where, so to speak, "the dog rummaged." for example
analysis of the system call script, with PID = 1111. Also network analyzers wireshark (Windows), ngrep , tcpdump (Linux) - for analyzing network traffic, protocols, etc.
FirePHP - class, written in php + extension for FireFox. Allows you to send debug messages to the Firebug console by calling php methods. All information is sent through the X-FirePHP-Data headers, thus not interfering with the main content of the pages. Free. See Debugging PHP with Firebug.
php-console - written in php + extension for Google Chrome. Analogue of FirePHP, only for Google Chrome, but somewhat with different functionality. Free. See php-console
PHP_Debug class, written in php. It helps in debugging PHP code, shows the script execution path, displays all variables, execution time, included files, executed requests, watch variables ... This information is collected during the script execution, and displayed when it is completed and then can be used at any time. Free.
Pinba is a real-time monitoring and statistics service. Cm
Monitor php in real time
Monitor PHP code performance with Pinba . Free
General articles:
PHP code profiling
Debugging of difficult web applications - effective bag-crusher on production-servers
Debuggers in modern CMS / CMF / Framework . They are not considered, because they are often specific and designed for a specific shell, which makes it impossible to use them from outside (IDE) or use them without significant changes in their designs.
In order to collect and analyze bottlenecks in your applications, the syslog centralized storage method can sometimes be useful, see [ tyts ].
Let's go back to ZendDebug. Since I mainly use Zend Studio, it is most convenient for me to work with it. It allows you to immediately understand the progress of the script, supports navigation through the code from the IDE. No third-party tools except IDE are needed. This is really convenient, so to speak, set up once and use it.
Debugging and profiling scripts in Zend Studio is possible in at least two ways using xdebug or ZendDebug. Only here the profiling of the site with xdebug did not work for me, it says that it is impossible so - only debugging.
About local debugging of the code was written at the time of Zend Studio 5.5 [tyts] . Since that time, little has changed. But I ran into a problem when the web server and the code being debugged are on a remote server. Often these sandboxes are closed from the outside, and only the ports required for operation are opened. But if such a sandbox has access via SSH, then you can still configure ZendDebug without interfering with the firewall to perform its function.
Looking ahead, I note that for this you will need to create an SSH tunnel. It is a little about why SSH tunnel is needed in this case.
By default, Zend Studio initiates a remote debugging session by sending an HTTP request to the debug server. This request contains the return address parameters (IP address and port number), which ZendDebug (installed on the server) uses when starting a new connection to Zend Studio to relay debug information. By the way, you can initialize the debugging session itself from both the IDE and the browser by installing the component that comes with Zend Studio will be quite convenient.
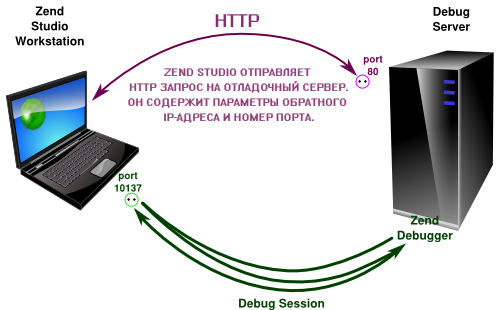
A regular debugging session will take place, for example, in the case when the code, WEB server and IDE are on the local computer.
But often the WEB server is shared with IDE firewalls, routers, proxy servers, etc. This is where the SSH tunnel comes in handy.
In the case of a tunnel, the debug session setup process consists of two main steps:
- create SSH tunnel;
- Zend Debugger settings, to send your traffic through the SSH tunnel.
The scheme of the debug session via the SSH tunnel will look like:

Normal debug session via SSH tunnel
Zend Studio, by default, opens port 10137. We will use it in the examples below. You can also assign another port if necessary.
Creating an SSH tunnel in Linux or Mac OS X is possible on the command line:
ssh <Zend Studio Port>: 127.0.0.1: <port to open debug server> @ example:
To create an SSH tunnel in Microsoft Windows, you can use PuTTY . After creating a working SSH connection, you need to further configure the tunnel.

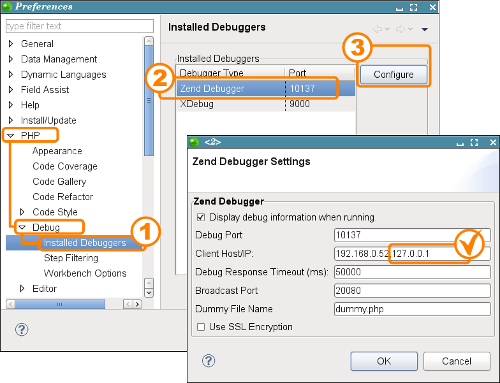
From the IDE side, check that the port 10137 and the local IP address are 127.0.0.1
The practice of traffic deduction may come in handy for other purposes. For example, using local utilities to do SQL dumps of the DBMS, when the remote database allows connection only with 127.0.0.1, etc.
I think from the list above everyone will be able to find a convenient tool for themselves every day. And what development would bring even more pleasure, and on a question - “What happened? Why are we lying? ”Was always a prompt response.
Enjoy your debugging and error-free scripts, thank you for your attention.
udp added php-console, thanks Arik
Xdebug Debugger and Profiler Tool - PHP extension. Requires installation on the server and settings. It can display: function call stack, memory allocation. Features: profiling, code coverage analysis, protection from endless recursion, interactive script debugging. Xdebug log visualization software: Webgrind is a web interface for Xdebug profiling written in PHP, MacGDBp is a Mac OS X client that allows you to debug PHP applications using Xdebug. Linux GUI kcachegrind . Free. Integrates with many IDE. See Profiling PHP Applications With xdebug . When you enable the option in php.ini:
html_errors = On will format the var_dump () output and error messages.
Xhprof is a PHP extension from facebook. Requires installation on the server and settings. Allows you to collect the execution time of each function, memory usage, waiting time, the number of calls and more. This extension is available from the PECL repository . You can read the documentation here [tyts] . Also Profiling and debugging php-applications using xhprof & FirePHP . Of the advantages, it does not heavily load the system, you can put it to battle. Free.
')
DBG (PHP Debugger and Profiler) - PHP extension. Requires installation on the server and settings. Allows you to work on a test or / and production server and debug scripts locally or remotely, from an IDE or console. Paid / free version.
ZendDebug is a PHP extension, part of Zend Studio (paid IDE). Requires installation on the server and settings. It allows almost everything, too, as xdebug, GUI in IDE Zend Studio or Zend Server. Paid. Below we consider it in more detail.
Memtrack is a PHP extension. Lets you look for memory leaks. It is convenient to check the scripts run on the crown or as a demon. Free. See [tyts]
APD Advanced PHP debugger - PHP extension. Weak competitor xdebug, but has the ability memtrack. It integrates poorly with the IDE, but it has a console interface (see [ tyts ]). Free.
DTrace + PHP is a PHP extension. Low level debugging. See [tyts] . Just do not forget about the existence of Strace and other system debuggers, which are sometimes able to show where, so to speak, "the dog rummaged." for example
strace -p 1111analysis of the system call script, with PID = 1111. Also network analyzers wireshark (Windows), ngrep , tcpdump (Linux) - for analyzing network traffic, protocols, etc.
FirePHP - class, written in php + extension for FireFox. Allows you to send debug messages to the Firebug console by calling php methods. All information is sent through the X-FirePHP-Data headers, thus not interfering with the main content of the pages. Free. See Debugging PHP with Firebug.
php-console - written in php + extension for Google Chrome. Analogue of FirePHP, only for Google Chrome, but somewhat with different functionality. Free. See php-console
PHP_Debug class, written in php. It helps in debugging PHP code, shows the script execution path, displays all variables, execution time, included files, executed requests, watch variables ... This information is collected during the script execution, and displayed when it is completed and then can be used at any time. Free.
Pinba is a real-time monitoring and statistics service. Cm
Monitor php in real time
Monitor PHP code performance with Pinba . Free
General articles:
PHP code profiling
Debugging of difficult web applications - effective bag-crusher on production-servers
Debuggers in modern CMS / CMF / Framework . They are not considered, because they are often specific and designed for a specific shell, which makes it impossible to use them from outside (IDE) or use them without significant changes in their designs.
In order to collect and analyze bottlenecks in your applications, the syslog centralized storage method can sometimes be useful, see [ tyts ].
Let's go back to ZendDebug. Since I mainly use Zend Studio, it is most convenient for me to work with it. It allows you to immediately understand the progress of the script, supports navigation through the code from the IDE. No third-party tools except IDE are needed. This is really convenient, so to speak, set up once and use it.
Debugging and profiling scripts in Zend Studio is possible in at least two ways using xdebug or ZendDebug. Only here the profiling of the site with xdebug did not work for me, it says that it is impossible so - only debugging.
About local debugging of the code was written at the time of Zend Studio 5.5 [tyts] . Since that time, little has changed. But I ran into a problem when the web server and the code being debugged are on a remote server. Often these sandboxes are closed from the outside, and only the ports required for operation are opened. But if such a sandbox has access via SSH, then you can still configure ZendDebug without interfering with the firewall to perform its function.
Looking ahead, I note that for this you will need to create an SSH tunnel. It is a little about why SSH tunnel is needed in this case.
By default, Zend Studio initiates a remote debugging session by sending an HTTP request to the debug server. This request contains the return address parameters (IP address and port number), which ZendDebug (installed on the server) uses when starting a new connection to Zend Studio to relay debug information. By the way, you can initialize the debugging session itself from both the IDE and the browser by installing the component that comes with Zend Studio will be quite convenient.
A regular debugging session will take place, for example, in the case when the code, WEB server and IDE are on the local computer.
But often the WEB server is shared with IDE firewalls, routers, proxy servers, etc. This is where the SSH tunnel comes in handy.
In the case of a tunnel, the debug session setup process consists of two main steps:
- create SSH tunnel;
- Zend Debugger settings, to send your traffic through the SSH tunnel.
The scheme of the debug session via the SSH tunnel will look like:
Normal debug session via SSH tunnel
Zend Studio, by default, opens port 10137. We will use it in the examples below. You can also assign another port if necessary.
Creating an SSH tunnel in Linux or Mac OS X is possible on the command line:
ssh <Zend Studio Port>: 127.0.0.1: <port to open debug server> @ example:
user@workstation:~> ssh -R 10137:127.0.0.1:10137 user@debugserver user@debugserver's password: <enter user's password on the debug server> Welcome to the Debug Server! user@debugserver:~$ To create an SSH tunnel in Microsoft Windows, you can use PuTTY . After creating a working SSH connection, you need to further configure the tunnel.
From the IDE side, check that the port 10137 and the local IP address are 127.0.0.1
The practice of traffic deduction may come in handy for other purposes. For example, using local utilities to do SQL dumps of the DBMS, when the remote database allows connection only with 127.0.0.1, etc.
I think from the list above everyone will be able to find a convenient tool for themselves every day. And what development would bring even more pleasure, and on a question - “What happened? Why are we lying? ”Was always a prompt response.
Enjoy your debugging and error-free scripts, thank you for your attention.
udp added php-console, thanks Arik
Source: https://habr.com/ru/post/210202/
All Articles