We had 540 points, 120 merchandisers, 30 TPs, 2 supervisors, 5 tables in XLS and one package for the routing software
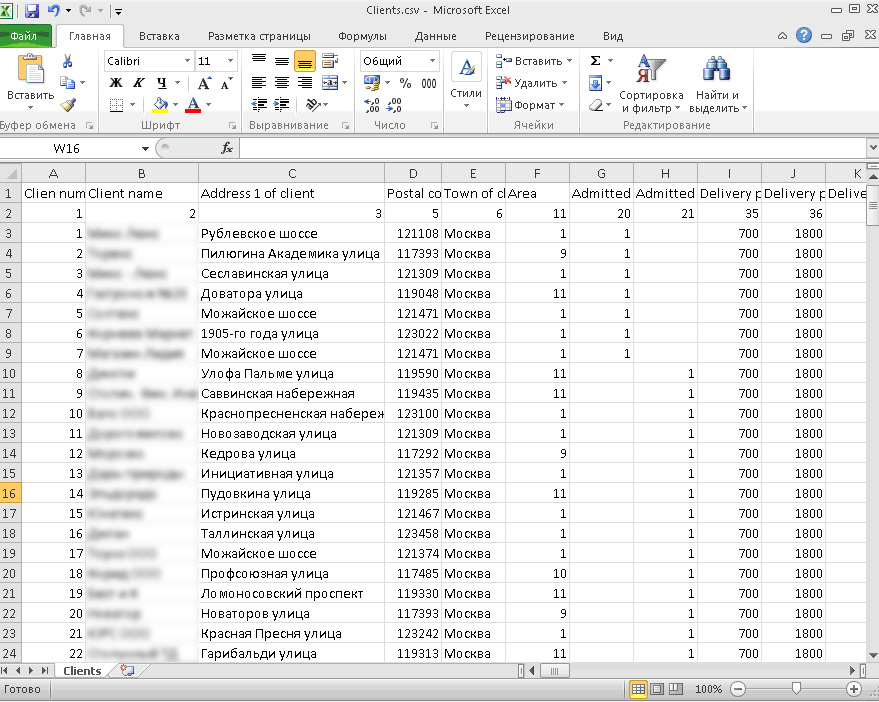
An example of an XLS table that is used prior to system implementation is great as a source of raw data.
There is such a cool type of math problem - routing sales representatives (TP) . Well known to anyone studying discrete mathematics.
In practice, the fact is that your favorite chocolates in supermarkets, stalls and cafes do not appear just like that. First, the requirements of consumers, the capabilities of manufacturers, as well as the wishes of a specific point and suppliers in the presentation of a certain position in the market are identified. Based on these identified parameters, a task pool appears to serve each point by a sales representative. He brings goods to a point for demonstration, agrees to expand the range of sales, provides a sales service, plus controls the workflow and makes calculations. And from time to several times a week, the merchandiser visits the place of sales to correct the calculation and make sure that everything is in order.
')
In fact, the task boils down to two:
- The generalized traveling salesman (TSP) problem.
- And building an optimal schedule.
At the same time, the tasks also take into account available resources (for example, availability of machines, their capacity, road traffic and so on), parameters of points (time of its work points, frequency of visits, list of tasks that need to be solved at this point, etc.), changes For example, the sudden move of one stall to the other end of the city. Well, the final touch - quite often this task is solved by a supervisor with a higher humanitarian education.
As it usually happens
Imagine that you are a chocolate supervisor. You represent the manufacturer of chocolates, and you are interested in selling them as much as possible through various retail chains, kiosks, small shops and so on. Fortunately, the invisible hand of the market has long shown the right way: we need regular rounds of points by representatives for agreements and merchandazers to control the situation and make quick edits.
You have 30 sales representatives - they drive your / their cars, carry with them chocolates and various equipment (racks for goods, shop windows, advertising materials, etc.). Their main task is to maintain and expand the sales network. For example, for a grocery store near your home, TP tasks might be:
- Check the layout and the full range of chocolates on the shelves. Negotiate with the representative points about expanding the range of chocolates.
- Solve the financial issue of the debts of the owner.
- Prepare everything for the upcoming marketing campaign: placing and decorating additional windows and racks, etc.
In addition to sales representatives, there are merchandisers whose duties include a narrower range of tasks: correcting the display and sounding the alarm if they don’t find your chocolates in the exact place of the shelf you received under an agreement with the supermarket. But they do not agree on the delivery, but just check everything.
So, you have 30 TPs, 120 merchandisers, 540 points (among which there are huge supermarkets, and stalls, and all kinds of HoReCa establishments, for example, a cafe). And you need until tomorrow to plan the work of your employees for the upcoming quarter, taking into account the specifics of each point, agreements to work with it, planned marketing campaigns and other factors. At the entrance - 5 plates in the XLS, which led your predecessor.
Possible solutions
The first suggestion is that you give each sales representative 4 merchandisers to subordinates, single out a district of the city and say: “Perform reciprocating movements as you wish, but the spice should come in.” And set a plan for profit. This option comes from the 40s, and it is clearly non-optimal. Why? Because the areas are different, the coverage of the points will not be optimal, the consumption of resources is unpredictable, and people simply have the ability to act around the points by greedy algorithms instead of more progressive options like at least imitation annealing. There is also a high probability of a non-optimal distribution of resources according to tasks and points, in the people such a situation is called “either thickly, now empty”.
The second option is to try to solve this problem centrally, evenly distributing the burden on employees and covering the widest possible list of tasks. You take one district, and prescribe the main points:
- Tasks that need to be done at each point and the frequency of their implementation (for example: talking about money once a month, watching a display twice a week, delivering goods once a week), as well as the planned duration of the tasks (for example, correcting the layout in the supermarket - 20 minutes, and in a stall - 5 minutes)
- Then prescribe the parameters of the points (for example, time, location, etc.).
- Carefully look at the map of your area and draw a graph between these points, indicating the time. Just in case, you also indicate when and which road is less passable due to traffic jams, as well as taking into account road restrictions (signs, speed, direction, etc.).
As a result, overnight calculations you get something more or less optimal for one area. But to raise all areas of the city is so extremely difficult. And it's not a fact that you made the right division at the very beginning - after all, obviously, zones with a large number of points must be served by a large number of people.
And in practice, people are usually not 120, but several thousand.
Next round
You come to the manufacturer of chocolates and say: "I think there is something to optimize." And, counting on your knee the possible benefits, you buy a license for software that specializes in such tasks .
In the end, you want:
- For an adequate time (from 10 minutes to an hour, depending on the region, amount of resources, and other conditions), get an optimal quarterly / semi-annual work plan for TP and merchandisers.
- Make the load on each person in the team uniform (so that he does not recycle and do not sit just like that), optimize the number of involved employees and technical resources
- Optimize the use of transport (for example, due to more thoughtful routes).
- To achieve the ability to solve each of the tasks of the plan at the right time.
- If the input data changes, you can quickly make plans.
What is at the entrance?
First of all, you have point parameters at the entrance: you entered them and took them into account earlier, remember? The data is the same - the time of work, time to solve the problem, the type of task and the resource needed to solve it (human qualification, machine, and so on).
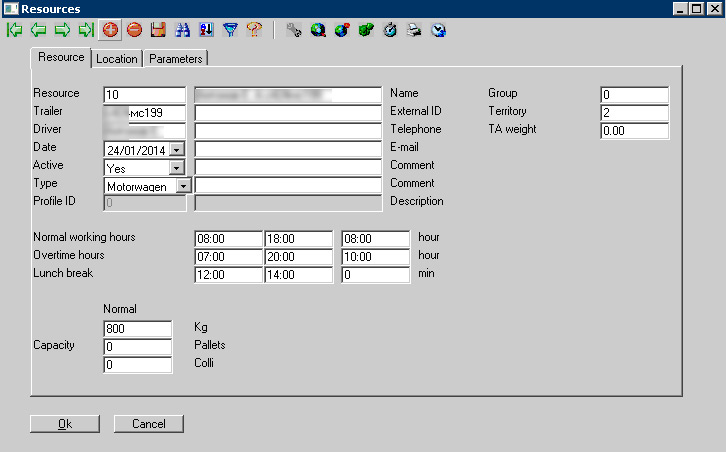
Sample employee card with vehicle
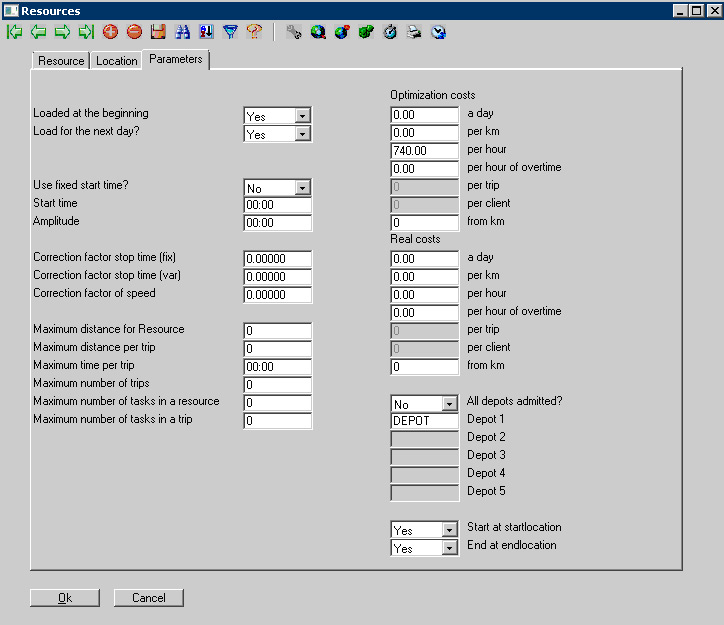
Resource Settings
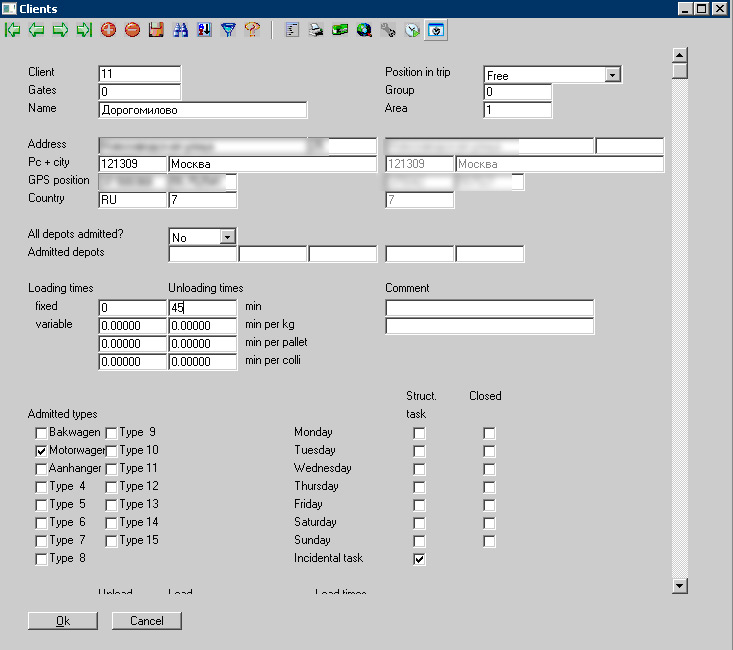
Card point. For example, the card takes into account such parameters of the point as the exact address, the time spent on it, the possible days of receiving the goods, the frequency of visits of the representative, and so on.
Secondly, you have electronic maps of the area containing road data. The most valuable thing on the maps is the ability to build routes from point to point with knowledge of their travel time and observance of traffic rules. First of all, we are interested in the characteristics of the roads (coverage, direction and average speed on them). In some cases, there are statistics on traffic jams - for example, traffic in the evening will be conducted with a speed factor of 0.3. Many card providers provide users with an opportunity (with a certain level of access) to make changes, for example, information has appeared on repair work on a section of the road lasting a month.
Treatment
The first step is the division of the entire territory into service areas by one or another employee, but in such a way as to obtain areas with an even distribution of workload. Since the specifics of the operation of TP and merchandisers are different, as well as the time costs of each of them, the division into areas may also be different.
Such optimization in terms of resources, by the way, can put you in front of the fact that a quarter of people in a team just don’t need: it happens (alas - for them, and a joy for someone who paid them a salary). You can change these patches with your hands, you can just agree.
Next, a plan for visiting points is formed taking into account the distribution by zones. It can be transferred to a corporate management or accounting system, for example, via xml format files or using web services.
Monitoring the work of the staff can be performed:
- in on-line mode, for the purpose of operative control and response to situations,
- carrying out a plan-factual analysis for a certain period in the context of different criteria of interest to us, for example, comparing the planned and actual lengths of the route, determining deviations from time indicators (both visiting intervals and duration), identifying the fact of being at a point (not according to TP) and so on.
Influence of reality
It is clear that the plan is an ideal situation. It happens, subway stations are closed, roads are blocked, there are various accidents, emergencies, store closures and anything else. Another frequent case - when someone leaves, and he does not have time to find a replacement on time - you need to redistribute work.
In such cases, you need to recalculate the piece of the plan that was affected by the impact of this factor. The data is simply transferred to the input, and the software produces corrections. They can also be made by hand.
What does this give?
The most important thing is that the tool allows you to save time and money due to various factors, for example:
- a better, more even distribution of TP areas of responsibility,
- building more optimal routes for visiting TP points and merchandisers. This allows you to reduce transportation costs and increase the number of serviced points without attracting additional resources,
- monitoring the operation of TP and merchandisers. Due to this, the inappropriate use of their time is reduced, plus here we get real reports on the actual performance of tasks by staff on-line, rather than waiting for the TP to produce its report (also check the accuracy of its report).
- staff redundancy, including no need to keep a large number of supervisors.
- on average, you can get from 15% to 40% savings that were spent on organizing the activities of sales representatives and merchandisers.
Questions
Everything. If interested - ask questions, ready to answer in the comments or by mail AGoncharova@croc.ru.
Source: https://habr.com/ru/post/210030/
All Articles