Successful or unsuccessful, that is the question: other crowdfunding statistics
At one point, before the new year, I decided that it was time for a project to try crowdfunding. I think the New Year is holidays, there must be a good time to attract donations.
But before that I decided to test my hypothesis on dry figures. And below is a small article about it.
For the analysis I chose three crowdfunding platforms: one local Ukrainian, one Russian and the well-known Kickstarter. Having run through their sites in search of statistics, I realized that I could not get more than the data on the attracted amounts by category. And even then, only Kickstarter found such statistics. Therefore, the collection of the necessary data engaged himself.
The result can be taken for your own research here:
https://github.com/CityScale/Crowdfunding/raw/master/CrowdFunding_ProjS_Data_CSV.zip .
')
Separately, it must be said that in the collected data, in addition to such obvious things as the start and end dates of the campaign, the amount collected and others, there is also a number of videos and pictures in the project description. They, as well as the volume of the text, were planned to be used to analyze the structure of a successful description. But this time it was decided to leave the idea for later.
And as it turned out, the decision was shrewd, since Recently on this topic appeared an interesting study publication (Eng.). So within the framework of this work, the connection between the phrases used on the project page, as well as other control parameters, and its success on Kickstarter was tested. I recommend also to get acquainted with it.
So, there is data - let's analyze them.
Recalling the task, we will calculate the statistics by months of the year, applying the following rules:
- if the campaign is not completed, then the date of its termination is considered the date of statistics collection;
- if the campaign is stopped or canceled, the date of the event is considered the date of its termination;
- amounts are reduced to the same currency (there are both hryvnias, and rubles, and dollars);
- the collected amount is scattered evenly over the months of the campaign;
- It is considered the average amount for all projects for a particular month.
As a result, we get the graphics below.
Fig. 1: the average amount (in dollars) allocated to the project by months.

About conclusions - at the end of the article.
Let's look at pic. 2, to assess the possible impact of the number (diversity) of projects on the amount of donations.
Fig. 2: the number of active projects by month.
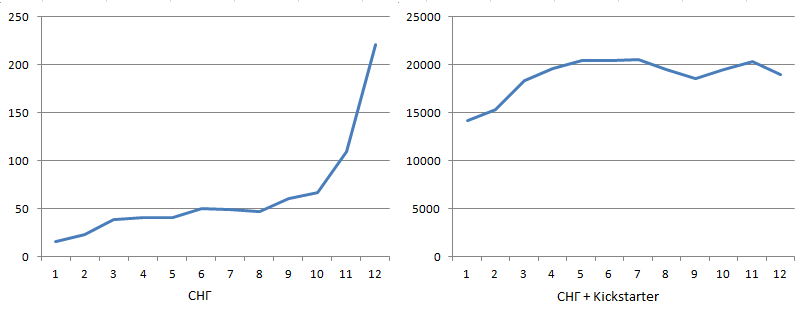
A small number of projects and a sharp increase in CIS platforms can be explained by the initial stage of their development, which continues during the last year.
On the other hand, it is allowed to say that the number of active projects, if it affects the amount of donations, is very weak.
In addition to statistics by month, I also tried to analyze statistics by days of the year, but everything turned out to be more difficult, so this case was postponed.
Well, in conclusion, the initial hypothesis of greater generosity during the holidays did not seem to be justified. And even on the contrary, the New Year and Christmas period (December-January) turned out to be the most meager on donations. And in general, we can say that the level of financial support for projects is associated with the level of ordinary business activity.
Does it then make sense to go out with your project in times of business calm? .. I think yes, firstly, people don’t completely stop supporting projects, and secondly, the competition between projects will be lower, i.e. higher chance of getting into attention. But in this case, it is worthwhile to make the duration of the campaign more in order to neutralize low activity. In addition, there are many other factors that influence success (see the link to the publication above).
But before that I decided to test my hypothesis on dry figures. And below is a small article about it.
Preparation and data collection
For the analysis I chose three crowdfunding platforms: one local Ukrainian, one Russian and the well-known Kickstarter. Having run through their sites in search of statistics, I realized that I could not get more than the data on the attracted amounts by category. And even then, only Kickstarter found such statistics. Therefore, the collection of the necessary data engaged himself.
The result can be taken for your own research here:
https://github.com/CityScale/Crowdfunding/raw/master/CrowdFunding_ProjS_Data_CSV.zip .
')
Separately, it must be said that in the collected data, in addition to such obvious things as the start and end dates of the campaign, the amount collected and others, there is also a number of videos and pictures in the project description. They, as well as the volume of the text, were planned to be used to analyze the structure of a successful description. But this time it was decided to leave the idea for later.
And as it turned out, the decision was shrewd, since Recently on this topic appeared an interesting study publication (Eng.). So within the framework of this work, the connection between the phrases used on the project page, as well as other control parameters, and its success on Kickstarter was tested. I recommend also to get acquainted with it.
Analysis
So, there is data - let's analyze them.
Recalling the task, we will calculate the statistics by months of the year, applying the following rules:
- if the campaign is not completed, then the date of its termination is considered the date of statistics collection;
- if the campaign is stopped or canceled, the date of the event is considered the date of its termination;
- amounts are reduced to the same currency (there are both hryvnias, and rubles, and dollars);
- the collected amount is scattered evenly over the months of the campaign;
- It is considered the average amount for all projects for a particular month.
As a result, we get the graphics below.
Fig. 1: the average amount (in dollars) allocated to the project by months.
About conclusions - at the end of the article.
Let's look at pic. 2, to assess the possible impact of the number (diversity) of projects on the amount of donations.
Fig. 2: the number of active projects by month.
A small number of projects and a sharp increase in CIS platforms can be explained by the initial stage of their development, which continues during the last year.
On the other hand, it is allowed to say that the number of active projects, if it affects the amount of donations, is very weak.
In addition to statistics by month, I also tried to analyze statistics by days of the year, but everything turned out to be more difficult, so this case was postponed.
Conclusion
Well, in conclusion, the initial hypothesis of greater generosity during the holidays did not seem to be justified. And even on the contrary, the New Year and Christmas period (December-January) turned out to be the most meager on donations. And in general, we can say that the level of financial support for projects is associated with the level of ordinary business activity.
Does it then make sense to go out with your project in times of business calm? .. I think yes, firstly, people don’t completely stop supporting projects, and secondly, the competition between projects will be lower, i.e. higher chance of getting into attention. But in this case, it is worthwhile to make the duration of the campaign more in order to neutralize low activity. In addition, there are many other factors that influence success (see the link to the publication above).
Source: https://habr.com/ru/post/209744/
All Articles