Team work on interfaces
Over the past six years, while I was building an interface design team, starting with independent activities and ending with a team of 11 people, I saw how much design research can affect product development. Previously, we had little time to survey customers and test convenience. Basically, we acted spontaneously: listened to what the tech support said and redid everything on the go.
Today we conduct a huge amount of usability testing, user surveys and benchmarking, as well as create detailed reports summarizing everything we discovered. But this led us to a new problem: without the ability to save and combine our results, the findings rather quickly eluded us, as documents were lost on the hard disk or neglected by someone from another department.
')
As a result, we began to live in a world of looped studies like in the movie “ Groundhog Day ”, asking the same questions and rarely using what we already know.
Now we need connections - a way to tie together different points of qualitative and quantitative data, long research histories into one information exchange center, which different teams will be able to share, study and maintain. After several years of research (and this is exactly what the MailChimp company began to do), open access to such information is not a solution to the problem, but strengthened the connection between the teams and supported the general culture of research.
It all began with a personal crisis.
In my mail came a mountain of letters with user reviews left through the form on the site MailChimp . Hundreds of letters suggested ideas for new features or ways to improve. I enjoy reading them, but last summer I began to feel overwhelmed. I read hundreds of emails every day, some of which contained helpful reviews, but were not worth adding them to our strategic plan. Maybe, in the end, the question could have reached a critical mass, but for the time being they remained in limbo.
From this, my productivity declined and my head was spinning. A friend of mine who helped many people work with mail and prioritize their work recommended that I simply delete all the letters and close the form. “If you cannot process the information, then stop wasting your time!” But intuition told me that these reviews have their own value, I just did not know how to use them.
In Gmail, I marked all relevant reviews with an asterisk, which would be nice to review later, and installed a script to send them to the email address associated with your Evernote account. Now they were organized and stored in a searchable database, which allowed me to clear my mailbox - but still I had no plan how to use this data.
The months went by. Ben Chestnut , co-founder and CEO of MailChimp, sent me an email one evening asking me what I know about clients using the RSS-to-Email feature (RSS-to-Email). We made plans for our strategy, and we needed an analytical picture that would help us re-work both functions so that they better serve clients. After spending some time studying in detail, I turned to my basket of reviews to see if the search would help me understand something.
A simple search for “RSS to Email” yielded 45 really useful reviews on this topic, in each of which users left their email address when filling out the feedback form. Usually, when conducting research, searching for users to participate in the survey was similar to fishing with a large network. We left posts on Twitter or even used the service to find users that match our criteria. It had to spend a lot of time. But with the help of a database of reviews from an e-mail, the search for participants became similar to underwater hunting. In a few seconds we found the right people to interview.
Ideas came in a few hours, not weeks. I understood what people suffer from and how simple changes can be made to improve convenience. I communicated with several clients via e-mail to clarify details, and quickly managed to build a plan on how to significantly improve this part of the application.
It was a moment of enlightenment, which made me wonder what ideas could have come if we had more data with the ability to search.
I told this story to my colleagues, Gregg Bernstein , Jenna Downs and Fernando Godina , each of whom had data that they would be willing to enter. Gregg transferred to Evernote transcripts and recording interviews with users. Jenn added interface test results, and Fernando, God bless him, reviewed more than 10,000 closed accounts to find those that would tell us why people are deleting the MailChimp account. We got a great little collection of different types of data.
Ben sent us a letter again asking for ideas about the new feature. “It seems that most people are interested in a simpler way to insert YouTube videos into a letter. Your guys do not know if there is any movement in this direction? ".
Usually such a question could remain unanswered, since it is not sufficiently weighty to guarantee in-depth research - but now we could find quantitative answers in a few seconds. Gregg looked over our data basket and, of course, a small trend was found there.
- 11 - said Gregg to Ben.
- eleven? - answered Ben.
- Yes, that was the number of people who mentioned the insertion of a YouTube video in reviews, reasons for deleting an account, usability testing and customer surveys.
We were amazed at this success. But we knew that our database still did not show the full picture. What other data could be found in the bins of the company?
We talked with the tech support team, data experts, analysts, social network specialists and the mail delivery team, each of whom had a lot of valuable information. Soon a huge amount of information appeared, and the database was transferred from the ownership of the user interface development team to the entire company. The technical support team shared the templates they found in letters and chats. Engineers wrote scripts that collected general data about popular paths in the applications and demographics of our users and sent them to the database every week. Since Google Analytics allows you to schedule emails with individual reports, we could collect data on the use of mobile devices and the percentage of important workflows completed. Tweets, Facebook and blog comments allowed us to collect even more user reviews. Research data, email delivery statistics, industry research and notes from each release of our application - we added everything possible to the database to expand our horizons.
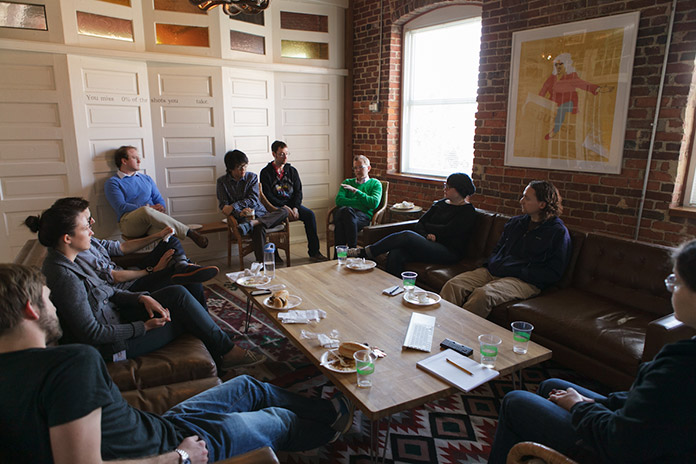
As soon as we opened the data for all the teams, an interesting thing happened. People who did not usually meet in order to talk began to regularly cross over to compare notes and share what they learned. Our “data lovers” are now getting together for lunch and sharing stories about the projects they are working on. Data sharing leads to a new type of collaboration that we never dreamed of.
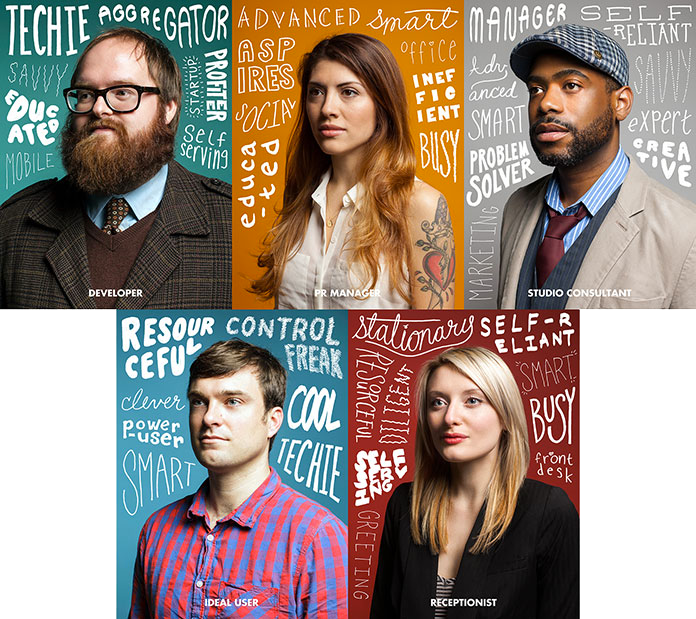
Design research specialists have worked with DesignLab to turn many months of user research into a series of great posters that illustrate the main archetypes of MailChimp users . After the recent changes to the design of the application, the technical support and design teams collected customer reviews, printed them and pinned notes under each character's poster - thereby helping us sort questions from different customers and quickly find solutions.
Each character has a name and a set of character traits. When we conduct user surveys, we save the transcripts of conversations and notes to our large database and mark each file with a personal name, which allows us to see solutions by user type. What can Andre say about coding email templates in HTML? How did Ada respond to the new design? Now we can answer such questions by performing a search, both by tags and by keywords.
Although we have no dramatic political struggles in our team, close cooperation between the teams definitely helps us bring people together and build respect for the work we do.
We found that when people have the opportunity and platform to share data or do something new with already existing data, they become proud, understanding that their work is important for others. It is pleasant to see that what you do benefits the various areas of the company. Each of us wants his work to be appreciated and respected.
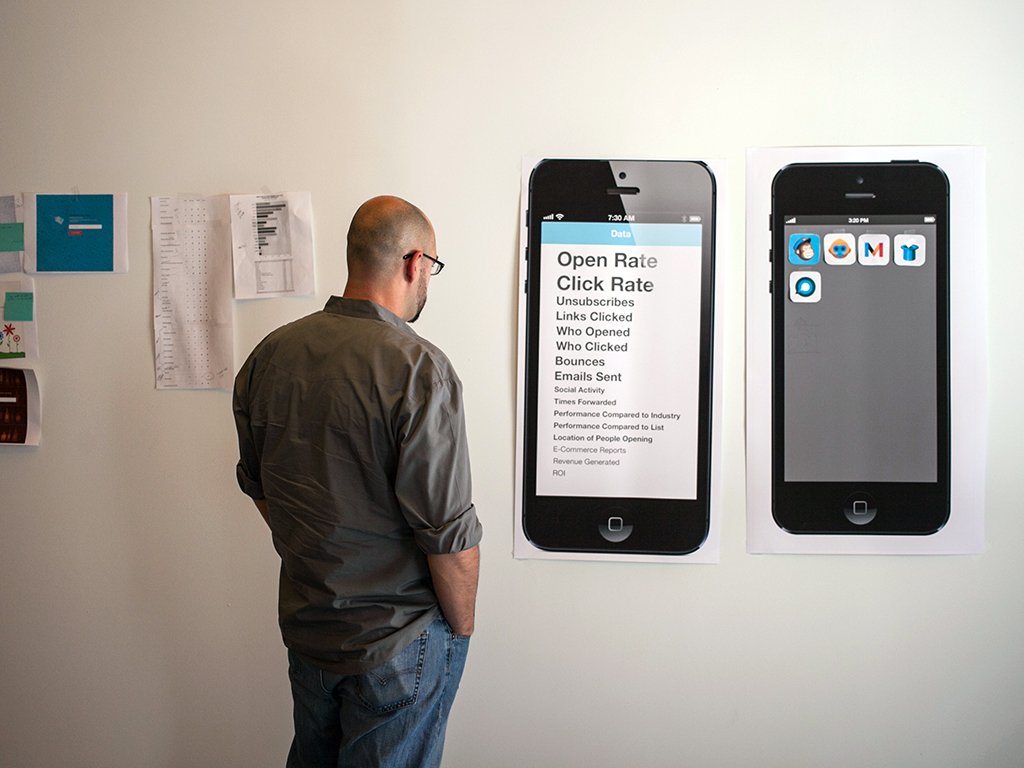
If you share an Evernote account with everyone in the company who needs access, you’ll get scenarios for exploring an environment in which people from all departments use our research and encounter ideas that they didn’t even know existed. When Stephen Martin , the designer from our MobileLab team, was working on a new interface for iOS, he wondered which statistics were most important for customers viewing campaign reports. He took advantage of the fast search in Evernote and came across a graph of our 2013 study sent out to thousands of users. He saw a clear distribution of the statistics that users use most often. Using this data, he created a poster displaying a hierarchy that helped him make a more rational design decision based on user research.
Mobile Designer Steven Martin turned the data into information design.
Now that everyone has access to the data, everyone can be a researcher.
Despite the fact that the team experience has quite a lot of power, ideas can easily get lost in the unknown, unless you regularly pull them out and show them to the team.
Instead of waiting for a project that will create such a motivation, every week we compose a letter that disperses throughout the company and talks about interesting indicators and steady trends. The authors change each time to make sure that different points of view are presented. Each email includes an invitation to start adding data — or just browsing out of curiosity.
We tried many solutions until we stopped at Evernote as a hub of information. Wiki and standard databases always seemed too technical, and were required to weed out some people who would love to add their data or simply read. For your organization, the best choice would be to install Drupal or a standard database. The data storage tool doesn't really matter, as long as it helps you comply with these basic principles:
Combining a variety of data, you will find trends in things incompatible at first glance. That is what struck us. We find ideas among departments and users. We store all the data together, not dividing it into different streams or commands that work with them.
From the ideas that we collect bit by bit, there are new strategies for our company, based on research. For us, this is new, and it completely changed our work style in just a few short months. This made our company more rational and helped create more informed design strategies. We no longer lose research results and are better acquainted with the collective knowledge that we have. What we build is much more than just merged data; it is a merged company.
This kind of experience made me think - are other teams using the same collective approach to research? What ideas have you discovered, and what tools do you use? Do you have a story you would like to share? I would love to listen .
This is a translation of an article titled " Connected UX " by Aarron Walter . Translated at UXDepot with the approval of the publication A List Apart . Especially for Habrahabr and UXFox .
PS from translators : I hope you enjoyed the article. We will be happy if you point us to errors in the translation so that we can correct them promptly. Write us at editor@uxfox.ru , please.
Today we conduct a huge amount of usability testing, user surveys and benchmarking, as well as create detailed reports summarizing everything we discovered. But this led us to a new problem: without the ability to save and combine our results, the findings rather quickly eluded us, as documents were lost on the hard disk or neglected by someone from another department.
')
As a result, we began to live in a world of looped studies like in the movie “ Groundhog Day ”, asking the same questions and rarely using what we already know.
Now we need connections - a way to tie together different points of qualitative and quantitative data, long research histories into one information exchange center, which different teams will be able to share, study and maintain. After several years of research (and this is exactly what the MailChimp company began to do), open access to such information is not a solution to the problem, but strengthened the connection between the teams and supported the general culture of research.
It all began with a personal crisis.
Moment of crisis
In my mail came a mountain of letters with user reviews left through the form on the site MailChimp . Hundreds of letters suggested ideas for new features or ways to improve. I enjoy reading them, but last summer I began to feel overwhelmed. I read hundreds of emails every day, some of which contained helpful reviews, but were not worth adding them to our strategic plan. Maybe, in the end, the question could have reached a critical mass, but for the time being they remained in limbo.
From this, my productivity declined and my head was spinning. A friend of mine who helped many people work with mail and prioritize their work recommended that I simply delete all the letters and close the form. “If you cannot process the information, then stop wasting your time!” But intuition told me that these reviews have their own value, I just did not know how to use them.
In Gmail, I marked all relevant reviews with an asterisk, which would be nice to review later, and installed a script to send them to the email address associated with your Evernote account. Now they were organized and stored in a searchable database, which allowed me to clear my mailbox - but still I had no plan how to use this data.
The months went by. Ben Chestnut , co-founder and CEO of MailChimp, sent me an email one evening asking me what I know about clients using the RSS-to-Email feature (RSS-to-Email). We made plans for our strategy, and we needed an analytical picture that would help us re-work both functions so that they better serve clients. After spending some time studying in detail, I turned to my basket of reviews to see if the search would help me understand something.
A simple search for “RSS to Email” yielded 45 really useful reviews on this topic, in each of which users left their email address when filling out the feedback form. Usually, when conducting research, searching for users to participate in the survey was similar to fishing with a large network. We left posts on Twitter or even used the service to find users that match our criteria. It had to spend a lot of time. But with the help of a database of reviews from an e-mail, the search for participants became similar to underwater hunting. In a few seconds we found the right people to interview.
Ideas came in a few hours, not weeks. I understood what people suffer from and how simple changes can be made to improve convenience. I communicated with several clients via e-mail to clarify details, and quickly managed to build a plan on how to significantly improve this part of the application.
It was a moment of enlightenment, which made me wonder what ideas could have come if we had more data with the ability to search.
More data
I told this story to my colleagues, Gregg Bernstein , Jenna Downs and Fernando Godina , each of whom had data that they would be willing to enter. Gregg transferred to Evernote transcripts and recording interviews with users. Jenn added interface test results, and Fernando, God bless him, reviewed more than 10,000 closed accounts to find those that would tell us why people are deleting the MailChimp account. We got a great little collection of different types of data.
Ben sent us a letter again asking for ideas about the new feature. “It seems that most people are interested in a simpler way to insert YouTube videos into a letter. Your guys do not know if there is any movement in this direction? ".
Usually such a question could remain unanswered, since it is not sufficiently weighty to guarantee in-depth research - but now we could find quantitative answers in a few seconds. Gregg looked over our data basket and, of course, a small trend was found there.
- 11 - said Gregg to Ben.
- eleven? - answered Ben.
- Yes, that was the number of people who mentioned the insertion of a YouTube video in reviews, reasons for deleting an account, usability testing and customer surveys.
We were amazed at this success. But we knew that our database still did not show the full picture. What other data could be found in the bins of the company?
Data avalanche
We talked with the tech support team, data experts, analysts, social network specialists and the mail delivery team, each of whom had a lot of valuable information. Soon a huge amount of information appeared, and the database was transferred from the ownership of the user interface development team to the entire company. The technical support team shared the templates they found in letters and chats. Engineers wrote scripts that collected general data about popular paths in the applications and demographics of our users and sent them to the database every week. Since Google Analytics allows you to schedule emails with individual reports, we could collect data on the use of mobile devices and the percentage of important workflows completed. Tweets, Facebook and blog comments allowed us to collect even more user reviews. Research data, email delivery statistics, industry research and notes from each release of our application - we added everything possible to the database to expand our horizons.
Team unification
As soon as we opened the data for all the teams, an interesting thing happened. People who did not usually meet in order to talk began to regularly cross over to compare notes and share what they learned. Our “data lovers” are now getting together for lunch and sharing stories about the projects they are working on. Data sharing leads to a new type of collaboration that we never dreamed of.
Design research specialists have worked with DesignLab to turn many months of user research into a series of great posters that illustrate the main archetypes of MailChimp users . After the recent changes to the design of the application, the technical support and design teams collected customer reviews, printed them and pinned notes under each character's poster - thereby helping us sort questions from different customers and quickly find solutions.
Each character has a name and a set of character traits. When we conduct user surveys, we save the transcripts of conversations and notes to our large database and mark each file with a personal name, which allows us to see solutions by user type. What can Andre say about coding email templates in HTML? How did Ada respond to the new design? Now we can answer such questions by performing a search, both by tags and by keywords.
Although we have no dramatic political struggles in our team, close cooperation between the teams definitely helps us bring people together and build respect for the work we do.
We found that when people have the opportunity and platform to share data or do something new with already existing data, they become proud, understanding that their work is important for others. It is pleasant to see that what you do benefits the various areas of the company. Each of us wants his work to be appreciated and respected.
Everyone can be a researcher
If you share an Evernote account with everyone in the company who needs access, you’ll get scenarios for exploring an environment in which people from all departments use our research and encounter ideas that they didn’t even know existed. When Stephen Martin , the designer from our MobileLab team, was working on a new interface for iOS, he wondered which statistics were most important for customers viewing campaign reports. He took advantage of the fast search in Evernote and came across a graph of our 2013 study sent out to thousands of users. He saw a clear distribution of the statistics that users use most often. Using this data, he created a poster displaying a hierarchy that helped him make a more rational design decision based on user research.
Mobile Designer Steven Martin turned the data into information design.
Now that everyone has access to the data, everyone can be a researcher.
Regular distribution of ideas
Despite the fact that the team experience has quite a lot of power, ideas can easily get lost in the unknown, unless you regularly pull them out and show them to the team.
Instead of waiting for a project that will create such a motivation, every week we compose a letter that disperses throughout the company and talks about interesting indicators and steady trends. The authors change each time to make sure that different points of view are presented. Each email includes an invitation to start adding data — or just browsing out of curiosity.
Tool doesn't matter
We tried many solutions until we stopped at Evernote as a hub of information. Wiki and standard databases always seemed too technical, and were required to weed out some people who would love to add their data or simply read. For your organization, the best choice would be to install Drupal or a standard database. The data storage tool doesn't really matter, as long as it helps you comply with these basic principles:
Easy entry, easy exit
Any obstacle, regardless of how small it is, preventing someone from adding data, will kill the whole process. People do not have to learn new systems to participate. The ideal option is to add data via email, as this does not require additional training. You can also use custom software solutions, as many people will interact with them. Eliminate all barriers to participation to involve as many people as possible.Ubiquitous access
We all know that mobile devices are sold more actively than computers and expand the experience of working with computers to all spheres of our life. Having made the data available from various devices, you will find that ideas will appear much more often - in a line at a store, at a meeting or on the sofa in the evening. Ubiquitous access makes learning the environment much easier.Data for all and data for all
Give access to data to all employees of your company and constantly insist on updating information. It is very important that the data are open and shared, so that the teams have a desire to cooperate. Thanks to this collaboration, you will find the most vivid ideas that you would never have found otherwise.Destruction of borders
Combining a variety of data, you will find trends in things incompatible at first glance. That is what struck us. We find ideas among departments and users. We store all the data together, not dividing it into different streams or commands that work with them.
From the ideas that we collect bit by bit, there are new strategies for our company, based on research. For us, this is new, and it completely changed our work style in just a few short months. This made our company more rational and helped create more informed design strategies. We no longer lose research results and are better acquainted with the collective knowledge that we have. What we build is much more than just merged data; it is a merged company.
This kind of experience made me think - are other teams using the same collective approach to research? What ideas have you discovered, and what tools do you use? Do you have a story you would like to share? I would love to listen .
This is a translation of an article titled " Connected UX " by Aarron Walter . Translated at UXDepot with the approval of the publication A List Apart . Especially for Habrahabr and UXFox .
PS from translators : I hope you enjoyed the article. We will be happy if you point us to errors in the translation so that we can correct them promptly. Write us at editor@uxfox.ru , please.
Source: https://habr.com/ru/post/209742/
All Articles