The basics of color theory. CIE XYZ system
 On Habré, periodically articles appear that somehow relate to the concept of color: its general theory , the use of color profiles and color management systems , the selection of harmonious color combinations in a design, a description of the problems that arise when working with images, and many other topics, for example, on the subject of image processing, in one way or another they touch upon questions of color and color reproduction. But, unfortunately, most of these articles describe the concept of color and features of its reproduction very superficially or they make hasty conclusions or even mistakes. The number of articles and questions in specialized forums about the practical aspects of accurate color reproduction, as well as many incorrect attempts to give answers to these questions even by experienced specialists themselves, suggests that problems with working with color occur quite often, and to find reasoned and clear answers to them difficult.
In my opinion, insufficient or erroneous knowledge of most IT specialists regarding color reproduction is explained by the fact that very little time is spent on studying color theory, because its basics are deceptively simple: since there are three types of cones on the retina, then you can mix certain colors no problem to get the whole rainbow of colors, as evidenced by the RGB or CMYK controls in some program. For most, this seems to be enough, and their craving for knowledge in this area is ending. But, the processes of obtaining, creating and reproducing images prepare you a lot of nuances and possible problems, which can be solved by understanding the theory of color, as well as the processes that underlie it. This topic is intended to fill the gap of knowledge in the field of color, and will be useful to most designers, photographers, programmers, and also, I hope, to other IT specialists.
Try to answer the following questions:
- Why can't physics define color?
- Which of the seven basic units of measurement of SI is based on the properties of the human visual system?
- What color tone is not in the spectrum?
- How did you manage to measure the sensation of color by man 90 years ago?
- Where are colors that do not have brightness?
If at least one of the questions you have not found the answer, I recommend to look under the cat, where you can find answers to all these questions.
')
Definition of color. His measurement
We all know that science cannot do without measurements and units of measurement, and the science of color is no exception. Therefore, we will first try to define the concept of color, and based on this definition we will try to find ways to measure it.
No one will be surprised to hear that colors are perceived by us with the help of eyes, which capture the light of the world around us for this. Light is the electromagnetic radiation of the wavelength range of 390-740 nm (visible to the eye), so we will try to find the key to the methods of measuring color in the properties of these rays, assuming that color is a feature of the light that came into our eyes. This does not contradict our reflections: it is the light that gets into the eyes that makes a person perceive color.
Physics knows and easily measures such light parameters as power and its spectral composition (i.e., power distribution over wavelengths — spectrum). Measuring the spectrum of reflected light, for example, from the blue and red surfaces, we see that we are on the right path: the power distribution graphs will differ significantly, which confirms our assumption that color is a property of visible radiation, since these surfaces are of different colors. The first difficulty that lurks us is the need to record at least 35 numerical values of the spectrum (visible wavelength range of 390-740 nm with a step of 10 nm) to describe one color. Before we even begin to think about ways to solve this minor problem, we will find that the spectra of some samples of identical color behave strangely (red and green graph):
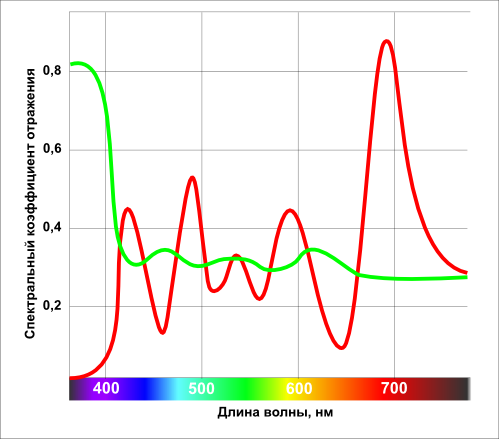
We see that the spectra differ significantly, despite the unmistakably identical color of the samples (in this case, gray; these two radiations are called metameric). The formation of the sensation of the color of these samples is influenced only by the light that is reflected from them (we miss the influence of the background color, the level of adaptation of the eye to the light and other minor factors), because its spectral distribution is all that physical measurements of our samples can give us. In this case, two substantially different spectral distributions determine the same color.
We give a second example of the problem of spectral color description. We know that the rays of each part of the visible spectrum are colored for us in a certain color: from blue in the region of 400 nm, through blue, green, yellow, orange to red with a wavelength of 650 nm and above. Yellow is somewhere around 560-585 nm. But we can pick up such a mixture of red and green radiation, which will be perceived yellow despite the complete absence of any radiation in the "yellow" range of 560-585 nm.
It turns out that no physical parameters can explain the color identity in the first and the presence of yellow rays in the second situation. Strange situation? Where did we make a mistake?
Conducting an experiment with the measurement of spectra, we assumed that color is a property of radiation, but our results refute this, because there were different rays of light across the spectrum, which are perceived as the same color. If our assumption were correct, every noticeable change in the spectrum curve would cause perceived color changes, which is not observed. Since now we are looking for ways of color measurements, and we saw that measuring spectra cannot be called a color measurement, we need to look for other ways by which this will be feasible.
In fact, in the first case, two experiments were conducted: one using a spectrometer, which resulted in two graphs, and the other - a visual comparison of samples by man. The first method measures the spectral composition of light, and the second compares sensations in the human mind. In view of the fact that the first method does not suit us, we will try to use a person to measure color, assuming that color is a sensation that a person experiences when exposed to light on his eyes. But how to measure the sensations of a person, understanding the complexity and uncertainty of this concept? Electrodes in the brain or encephalogram do not offer, because such methods even now do not provide the necessary accuracy for such a subtle concept as color. Moreover, this problem was successfully solved in the 20s of the twentieth century without the presence of most of the current technologies.
Brightness
The first problem to solve which it became necessary to numerically express the human sensations, was the task of measuring the brightness of light sources. Measuring the radiation power of the lamps (namely, the radiation power, in joules, or watts, and not the consumed electrical power) did not give an answer to this question, because, firstly, a person does not see radiation with wavelengths less than 380 and more than 780 nm, and therefore Any radiation outside this range does not affect the brightness of the source. Secondly, as we have already seen with spectra, the sensations of color (and brightness) are more complex than simply recording the characteristics of light that came into our eyes: human vision is more sensitive to some areas of the spectrum, and less to others. For example, green radiation is much brighter than identical blue power. Obviously, to solve the problem of numerical expression of the brightness of light sources, it is necessary to quantify the sensitivity of the human visual system for all individual waves of the spectrum, which can then be used to calculate the contribution of each source wavelength to its total brightness. Like the color measurement task raised above, this also boils down to the need to measure the sensation of brightness by a person.
It was possible to measure the sensation of brightness from the radiations of each wavelength by visual comparison of radiation intensities with known powers by a person. It is quite simple: controlling the intensity of radiation, it is necessary to equalize the brightness of two monochromatic (spectrally maximally narrow) fluxes, while measuring their power. For example, to equalize the brightness of monochromatic radiation with a wavelength of 555 nm with a power of one watt, you need to use two-arm radiation with a wavelength of 512 nm. That is, our visual system is twice as sensitive to the first radiation. In practice, for a high accuracy of the results, a more complex experiment was conducted, but this does not change the essence of what was said (the process is described in detail in the original scientific work of 1923 ). The result of a series of such experiments for the entire visible range is the spectral luminous efficiency curve (you can also find the name "visibility curve"):
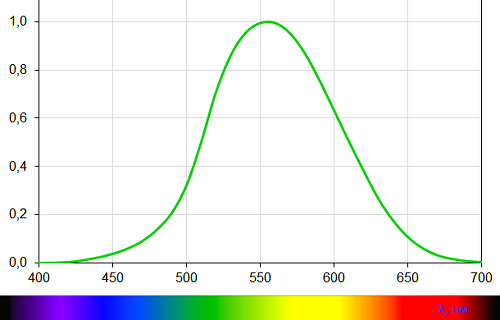
the X-axis shows the wavelengths, the Y-axis the relative sensitivity of the human visual system to the corresponding wavelength.
Having a device with the same spectral sensitivity, you can easily determine the brightness of the desired light emission on it. It is precisely under such a curve that the sensitivity of various photometers, luxmeters and other instruments is carefully adjusted, in which the determination of human perceived brightness is important. But the sensitivity of such devices is always only an approximation to the curve of the spectral light efficiency of a person and for more accurate measurements of brightness using the spectral distribution of the light source of interest.
The spectral distribution is obtained by dividing the radiation into narrow spectral zones and measuring the power of each of them separately. We can consider the brightness of our source as the sum of the brightness of all these spectral zones, and for this we determine the brightness of each of them (the formula for those who are not interested in reading my explanations on the fingers): multiply the measured power by the sensitivity of our visual system corresponding to this wavelength ( Y and X axes of the previous graph, respectively). Summing up the thus obtained brightness of all zones of the spectrum, we obtain the brightness of our primary radiation in photometric units, which give an accurate idea of the perceived brightness of certain objects. One of the photometric units is included in the Basic SI units - candela , which is determined through the spectral luminous efficiency curve, that is, it is based on the properties of the human visual system. The relative sensitivity curve of the human visual system was adopted as the international standard in 1924 by the International Commission on Illumination (the abbreviation MCO is found in Soviet literature), or CIE - Commission Internationale de l'Éclairage.
CIE RGB system
But, the spectral luminous efficiency curve gives us an idea only about the brightness of light radiation, and we can call its other characteristics, for example, saturation and color tone, which cannot be expressed with its help. By the way of measuring brightness, we now know that a person can “measure” color only directly (remember that color is a sensation) or some model of his reaction, such as a spectral luminous efficiency curve that allows you to express numerically sensations of brightness. Suppose that in order to measure color, it is necessary experimentally with the help of a person to create, by analogy with the luminous efficiency curve, a certain system that will display the color response of the visual system to all possible variants of the spectral distribution of light.
One property of light rays has long been known (in fact, this is a feature of our visual system): if you mix two different-colored radiations, you can get a color that is completely different from the original ones. For example, by directing a green and red light of a certain power to a single sheet of paper at one point, you can get a pure yellow spot without any admixtures of green or red hues. By adding the third radiation, and the existing two are better suited to blue (because it can not be obtained with a mixture of red and green), we get a system that allows us to get a lot of colors.
If we visually equalize some kind of test radiation in such a device, we get three indicators: the intensity of the red, green and blue emitters, respectively (as the voltage applied to the lamps, for example). That is, with the help of our instrument (called a visual colorimeter), which reproduces color, and our visual system, we were able to obtain the numerical values of the color of a certain radiation, which is what we wanted. These three values are often referred to as color coordinates , because they are conveniently presented as coordinates of three-dimensional space.
Similar experiments were successfully conducted in the 1920s by scientists independently of each other, John Guild (John Guild) and David Wright (David Wright). Wright used monochromatic radiations of red, green, and blue with wavelengths of 650, 530, and 460 nm, respectively, as the main radiations, and Guild used more complex (not monochromatic) radiations. Despite the significant differences in the equipment used and the fact that the data were averaged over only 17 observers with normal vision (10 for Wright and 7 for Guild), the final results of both researchers turned out to be very close to each other, which indicates a high accuracy of measurements conducted by scientists. Schematically, the measurement procedure is shown in the figure:
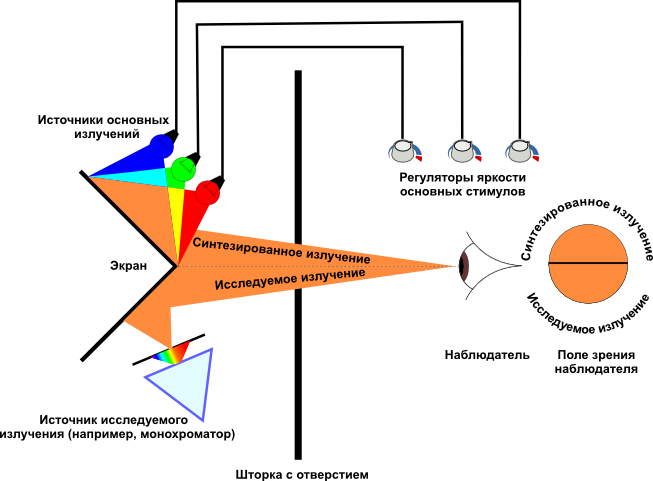
A mixture of radiation from three sources is projected onto the upper part of the screen, and the radiation under study is projected onto the lower part, and the participant in the experiment sees them simultaneously through a hole in the blind. The researcher sets the task for the participant to equalize the color between the fields of the device, and directs the radiation under study to the lower field. The participant regulates the power of the three radiations until he succeeds, and the researcher records the intensity indicators of the three sources.
In some cases, it is not possible to equalize certain monochromatic radiations in this experiment: the test field at any position of the regulators of the three radiations remains more saturated than the mixture used. But, due to the fact that the purpose of the experiment is to obtain color coordinates, and not to reproduce it, the researchers went for a trick: they mixed one main radiation of the device not with the other two, but sent it to the bottom of the screen, that is, they mixed it with test radiation :
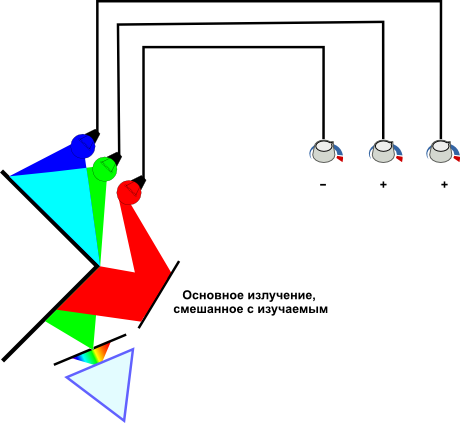
Further adjustment is carried out as usual, but the amount of radiation that is mixed with the studied one will be considered negative. Here you can draw an analogy with a change of sign when transferring a number to another part of the usual equation: since visual equality is established between the two parts of the colorimeter screen, its upper part can be viewed as one part of the equation, and the lower part as the other.
Both researchers conducted visual measurements of all individual monochromatic emissions of the visible spectrum. Studying in this way the properties of the visible spectrum, scientists assumed that their results could be used to describe any other radiation. Scientists operated with the power of three independent radiations and the result of a series of such experiments are three curves, and not one as it was done when creating the luminous efficiency curve.
To create a convenient and universal color specification system, the CIE committee averaged the measurement data of Gild and Wright, recalculating their data for the three main emissions with wavelengths of 700, 546.1 and 435.8 nm (red, green and blue, red, green, blue - RGB). Knowing the ratio of the brightness of the main emissions of such an average system, which are needed to reproduce white (respectively 1: 4.5907: 0.0601 for red, green and blue rays, which was established experimentally with subsequent recalculation) and using the spectral efficiency curve , which show the required number of three basic radiations of this system for the equation of any monochromatic radiation with a power of one watt:

the X-axis shows the wavelengths, and the Y-axis the necessary quantities of three radiations necessary to reproduce the color caused by the corresponding wavelength. The negative portions of the graphs correspond to those monochromatic radiations that cannot be reproduced by the three main radiations used in the system, and for their specification it is necessary to resort to the above-described trick during equalization.
To construct such a system, one can choose any other three radiations (remembering that none of them should be reproduced by a mixture of two others), which will give us other specific curves. The main emissions selected in the CIE RGB system reproduce a large number of spectrum emissions, and its specific curves were obtained with great accuracy and standardized.
Specific color coordinate curves eliminate the need to use a cumbersome visual colorimeter, with its slow visual adjustment method to obtain color coordinates using a person, and allow them to be calculated only from the spectral distribution of radiation, which can be obtained quite quickly and simply using a spectrometer. Such a method is possible, because any radiation can be represented as a mixture of monochromatic rays whose powers correspond to the intensity of the corresponding zone of the spectrum of this radiation.
Now let's check our two samples, in front of which the physicist surrendered, showing different spectra for monochrome objects, using the following specific coordinate curves: we will alternately multiply the spectral power distribution of the light reflected from the samples by three specific curves and sum up the results for each of them spectral distribution, but three curves are used here). The result will be three numbers, R, G and B, which are the color coordinates in the CIE RGB system, that is, the number of three radiations of this system, the mixture of which is identical in color to the measured one. We get three identical RGB indicators for our two samples, which corresponds to our identical color sensation and confirms our assumption that color is a sensation and can be measured only with the participation of our visual system, or its model in the form of three curves of the CIE RGB system or some another, whose specific coordinates are known (another such system based on other primary colors will be discussed in detail a little later). Using the CIE RGB colorimeter to measure the light reflected from the samples directly, that is, visually equalizing the color of the mixture of three emissions of the system with the color of each sample, we get the same three RGB coordinates.
It should be noted that in colorimetric systems it is customary to normalize the number of basic radiations so that R = G = B = 1 corresponds to the white color adopted in the system. For the CIE RGB system, this white color assumes the color of a hypothetical energy source that emits uniformly at all wavelengths of the visible spectrum. Without such a normalization, the system turns out to be inconvenient, because the brightness of the blue source is very low - 4.5907: 0.0601 against green, and in the graphs most colors would “stick” to the blue axis of the diagram. Introducing such a normalization (respectively 1: 4.5907: 0.0601 for the red, green and blue rays of the system), we move from photometric to colorimetric units that will make such a system more convenient.
It should be noted that the CIE RGB system is not based on any theory of color vision, and specific color coordinate curves are not the spectral sensitivity of three types of human retina cones, as they are often mistakenly interpreted. Such a system easily dispenses with data about the properties of pigments of the cones of the retina and without any data about the most complex processes of processing visual information in our brain. This speaks of the exceptional ingenuity and foresight of the scientists who created such a system despite the insignificant information about the properties of the human visual apparatus at that time. Moreover, the CIE RGB system underlies the science of color with virtually no changes so far, despite the enormous progress of science in the past tense.
It should also be noted that although the monitor also uses three emissions to reproduce color, as does the CIE RGB system, the three values of the monitor's color components (RGB) will not strictly specify the color, because different monitors reproduce color differently with a rather large variation and, moreover, the main emissions of monitors are quite different from the main emissions of the CIE RGB system. That is, one should not perceive the RGB values of the monitor as a kind of absolute color definition.
For a better understanding, it should be noted that by saying “radiation / source / wavelength / lamp is green”, we actually mean that “radiation / source / wavelength / lamp causes a green feeling ”. Radiation of the visible range is only a stimulus for our visual system, and color is the result of the perception of this stimulus and the color properties should not be attributed to electromagnetic waves. For example, as in the example above, no waves from the yellow range of the spectrum appear when red and green monochromatic rays are mixed, but we perceive their mixture as yellow.
Unreal colors. CIE XYZ system
In 1931, at Trinity College, University of Cambridge (UK), at the next meeting of the CIE, the system based on the data of Gilda and Wright was adopted as an international standard. Also, a group of scientists, led by American Dean B. Judd, in order not to wait for the next committee meeting, which will occur no earlier than a year later, proposed a different color specification system, the final data of which were calculated only on the night before the meeting. The proposed system turned out to be so convenient and successful that it was adopted by the committee without any serious discussions.
To understand on the basis of what such a system was created, the color must be represented as a vector, because the addition of two or more colors obeys the same rules as the addition of vectors (this emerges from the laws of Grassmann ). For example, the result of mixing red radiation with green can be represented as the addition of two vectors with lengths that are proportional to the brightness of these radiations:
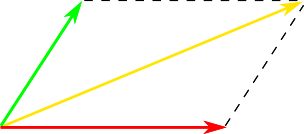
The brightness of the mixture will be equal to the length of the added vector, and the color will depend on the ratio of the brightness of the radiation used. The more the ratio is in favor of one of the primary colors, the more the resulting radiation will be closer in color to this radiation:

Let's try to graphically depict color mixing in a colorimeter used to create a CIE RGB system in a similar way. As we remember, it uses three radiations of red, green and blue. No color of this triple will be obtained by the sum of the two others, therefore, it will be necessary to represent all possible mixtures of these radiations in three-dimensional space, which does not prevent us from using the vector color addition properties:

It is not always convenient to draw three-dimensional diagrams, so they often use a simplified graph, which is a projection of all the necessary colors onto a single plane (highlighted in blue) of a three-dimensional scheme:

The result of such a projection of the color vector will be a point on the diagram, the axes of which will be the sides of the triangle, which are given by the dots of the primary colors of the CIE RGB system:

Such a point will have coordinates in the system of this triangle in the form of a distance from any two of its sides (the third coordinate is superfluous, since in a triangle any point can be determined from two distances from vertices or sides).The coordinates in such a triangle are called chromaticity coordinates, and they define such color parameters as color tone (blue, blue, green, etc.) and saturation (gray, pale, saturated, etc.). Due to the fact that we have moved from a three-dimensional to a flat diagram, it does not allow us to show the third color parameter - brightness, but for many cases, determining only the chromaticity value will suffice.
In order not to be confused, we single out that the color coordinates are the position of the end of the color vector in the three-dimensional system, and they are indicated by capital letters (RGB, XYZ, for example), and the chromaticity coordinates are the position of the color point on the flat chromaticity diagram, and they are indicated by lowercase letters (rg, xy) and two of them are enough.
The use of a coordinate system in which there is no right angle between the axes is not always inconvenient, therefore, in colorimetry, such a system of three vectors is used more often, the unit plane of which forms a right triangle. Its two sides near the right angle are used as axes of the chromaticity diagram:

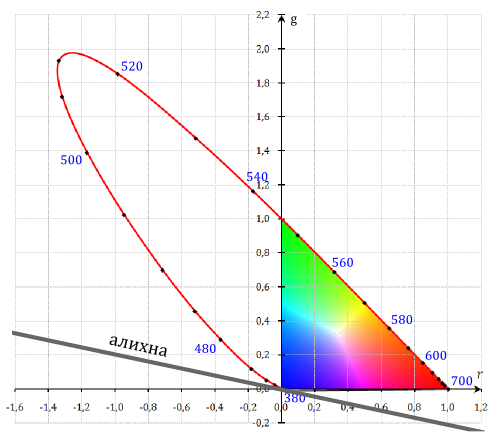
We now place on the diagram all possible chromaticities, the limit of which will be a line of spectrally pure radiations with a line of purple chromaticities, often referred to as a locus, which restricts the region of real colors on the diagram (red line):
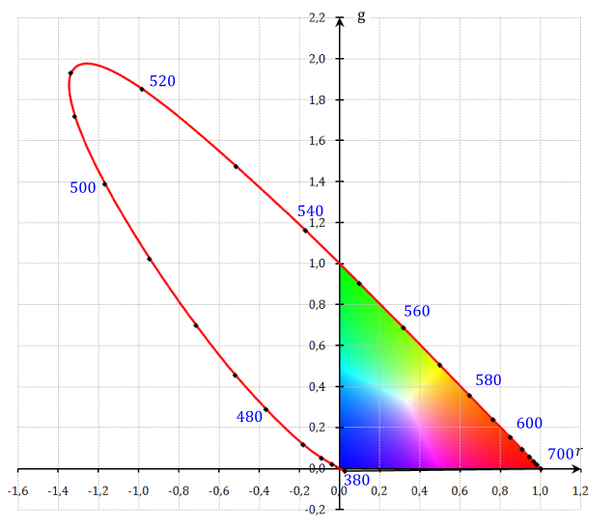
The line of purple chromaticity lies between the chromaticity of the radiation of the extreme blue and red ends of the spectrum. Purple colors, we can not compare any area of the spectrum, as it can be done with any other color, because the sensations of purple color occur when the simultaneous action on our visual system of blue and red rays, and not some one.
A significant part of the locus (in the area of 380-546 nm) goes beyond the triangle bounded by the chromaticity of the main radiations, that is, it has negative chromaticity coordinates, because this part of the spectral radiations could not be equalized using a CIE colorimeter. This corresponds to specific color coordinate curves in which the same part of the spectrum has negative coordinates (in the 380-440 nm range these are small values invisible on the graph).
The presence of negative coordinates of color and color transformed colorimetric calculations into a difficult task: in the 1920s and 1930s, most calculations were carried out using a slide rule, and the amount of calculations in colorimetric works was rather big.
The previous diagram shows us that all the positive coordinates have only colors that lie within the triangle, which is formed by the chromaticities of the basic radiations used in this system. If the locus was in the middle of a triangle, all colors would have positive coordinates, which would significantly simplify the calculations. But to find such three points on the locus that could incorporate it completely impossible, due to its convex shape. Later it was found that the reason for this form of the locus lies in the features of the spectral sensitivity of three types of cones of our eye, which overlap each other and any radiation excites cones that are responsible for another area of the spectrum, which lowers the level of color saturation.
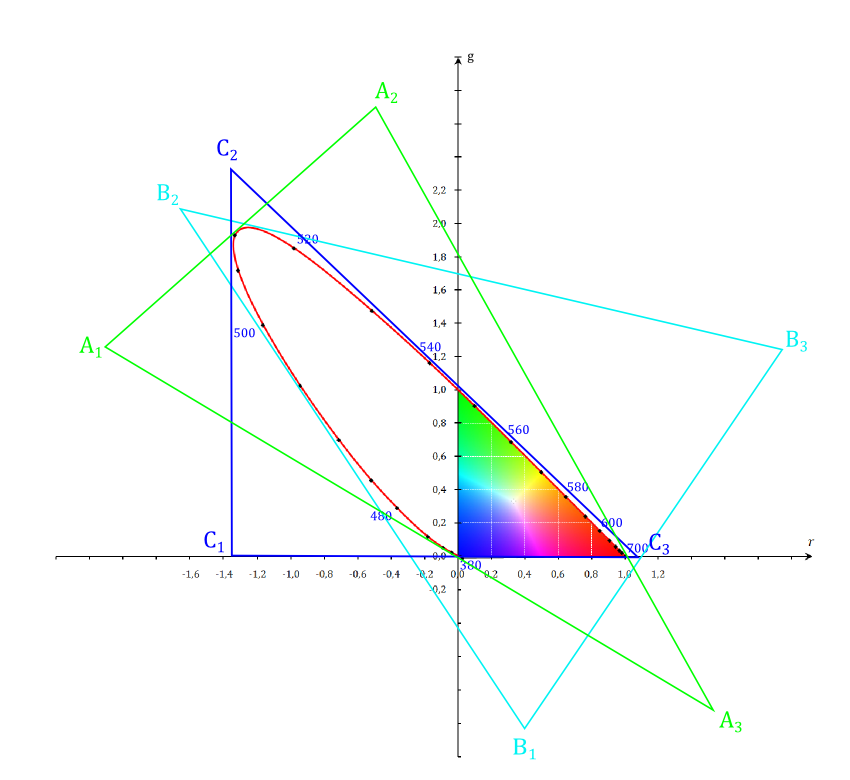
But what if you go beyond the locus, and use colors that cannot be reproduced and seen, but whose coordinates can be easily used in equations along with the coordinates of real colors? Since we have already moved from experiments to calculations, nothing prevents us from using such unreal colors, because all the properties of color mixing are preserved at the same time! We can use any three colors whose triangle can include the real color locus, and without difficulty we can draw many such triples of unreal primary colors (it would be expedient to build such a triangle as tightly as possible around the locus, so there will be fewer unnecessary areas in the diagram):
Having such freedom in choosing the points of the new primary colors, the scientists decided to extract from this some useful opportunities for the new three-color system. For example, the ability to determine the photometric brightness directly using the created system without additional calculations or measurements (in the CIE RGB system, the brightness needs to be calculated), that is, combine it in some way with the 1924 photometric standard.
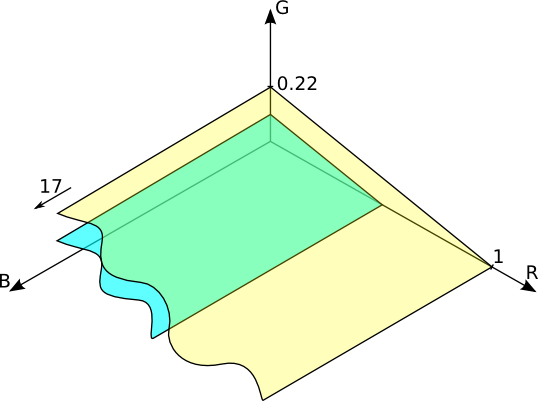
To substantiate the choice of the three new colors (remember that they exist only in the calculations), which were eventually chosen for this by scientists, let us return to our volumetric chart of color coordinates. For clarity and ease of understanding, we will use the usual rectangular coordinate system. Place a plane on it on which all colors will have the same photometric brightness. As we remember, the unit brightness of the red, green and blue main emissions in the CIE RGB system correlate as 1: 4.5907: 0.0601, and to go back to the photometric units you need to take them in proportion 1/1 to 1 / 4.59 to 1/0, 0601, that is, 1: 0.22: 17 which will give us a color plane with the same photometric brightness in the CIE RGB colorimetric system (the intersection point of the plane with the B axis is outside the figure at position 17):

All colors whose coordinates are on this plane will have the same photometric brightness. If we draw a parallel plane twice lower than the previous one (0.5: 0.11: 8.5), we get the position of the colors with half the brightness:
Similarly, below you can draw a new parallel plane that crosses the origin of coordinates, on which all colors with zero brightness will be placed, and even lower negative brightness planes can be drawn below. This may seem absurd, but recall that we work with the mathematical representation of the tricolor system, where everything is possible in the equations, which we will use.
Let us go back to the plane diagram of rg, projecting on it a plane of zero brightness. The projection will be a line of zero brightness - Alihna, which intersects the origin:
On the alichne there are chromaticities that do not have brightness, and if you use the color placed on it in color equalization (not real, with the mixing of light fluxes, but in the equations, where such colors are possible), it will not affect the brightness of the resulting mixture. If we place two colors of the three-color system on Alikhne, then the brightness of the whole mixture will be determined by only one color remaining.
Let me remind you that we are looking for the color coordinates of these three hypothetical colors that can equalize the colors of all real radiation without using negative values (the triangle should include the entire locus) and at the same time, the new system will include the photometric brightness standard directly. Placing two colors on Alikhne (called X and Z), and the third above the locus (Y), we will solve both problems:
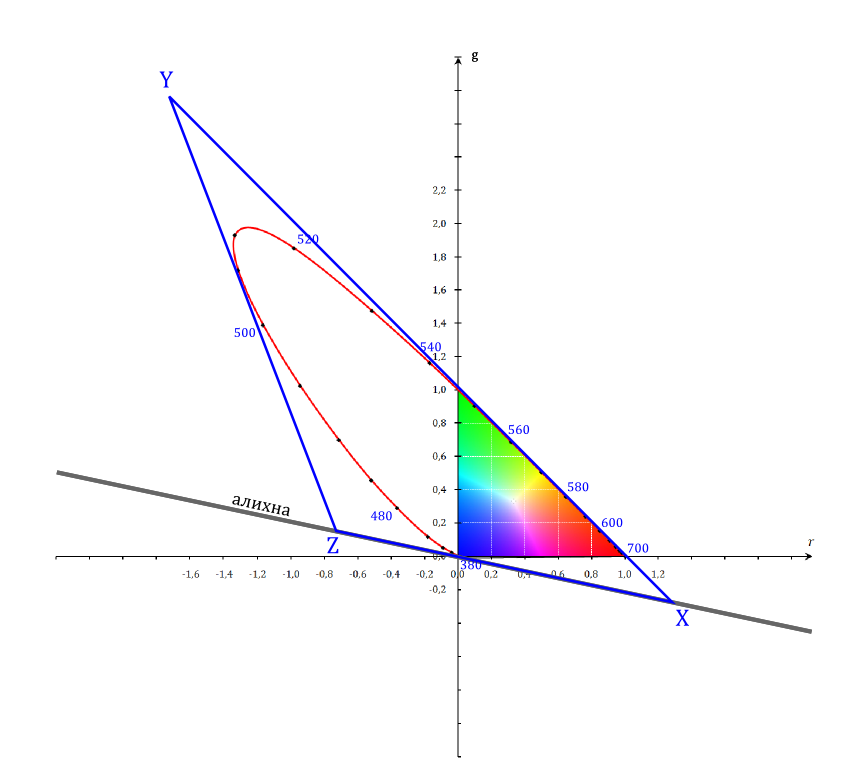
The locus of real colors is completely in a triangle, which is limited to three selected colors, and the brightness has completely passed to one of three components of the system - Y. Depending on the normalization of the values and the nature of measurements, the Y coordinate can express the brightness directly in candelas per m 2 , percent from the maximum brightness of a system (display, for example), the percentage of transmission (transparent samples, slides, for example) or the brightness relative to a certain reference (when measuring reflective samples).
Transforming the resulting triangle into a rectangular one, we get the xy diagram familiar to many:

It must be remembered that the xy diagram is a projection of the system with the main points XYZ on the unit plane, similarly, the diagram rg and the system RGB. This diagram allows us to illustrate in a convenient form the chromaticities of various radiations, for example, the color coverage of various devices. The diagram has one useful property: the chromaticity coordinates of the mixture of two radiations will be strictly on the line that connects the points of these two radiations on the diagram. Therefore, the color gamut of the monitor, for example, on such a diagram will be a triangle.
The xy chart also has one flaw that needs to be remembered: equal segments in different parts of the chart do not mean the same perceived difference in color. This is illustrated by the two white lines in the previous figure. The lengths of these segments correspond to the feeling of the same difference in color, but the segments differ in length by three times.
We calculate the curves of the specific coordinates of the color of the obtained system, which show the required number of three primary colors XYZ for the equation of any monochromatic radiation with a power of one watt:

We see that there are no negative sections in the curves (as was observed in the RGB system), which was one of the goals of creating the XYZ system. Also, the y curve (with a dashed line above) completely coincides with the spectral luminous efficiency of a person’s vision (discussed above in explaining the definition of the brightness of light emission), so the Y value determines the brightness of the color directly - it is calculated in an identical way same curve. This is achieved by placing the other two colors of the system on the plane of zero brightness. Therefore, the colorimetric standard of 1931 includes the photometric standard of 1924, which allows you to do without unnecessary calculations or measurements.
These three curves define the Standard Colorimetric Observer - a standard that is used in the colorimetric interpretation of spectral measurements and it underlies the whole science of color with little or no change until now. Although the XYZ visual colorimeter cannot physically exist, its properties make it possible to perform color measurements with high accuracy and it helps many industries to predictably reproduce and transmit color information. On the XYZ system, all further advances in the science of color are based, for example, the CIE L * a * b * system, familiar to many, and similar to it, as well as the latest CIECAM systems that use modern color profile building programs .
Results
- Accurate work with color requires its measurement, which is also necessary as the measurement of length or weight.
- ( ) , (, , ) .
- , . , (, ), .
- — ( ) , , . ( ).
- ( ) , . CIE RGB.
- , ( ) , .
- , .
- CIE XYZ CIE RGB — , . XYZ — «» , .
- The main reason for creating the XYZ system is to facilitate calculations. The color and chromaticity coordinates of all possible light emissions will be positive. Also, the color coordinate Y expresses the photometric brightness of the stimulus directly.
Conclusion
The closest to IT professionals areas of activity, which are based on the principles and systems described in this article, is the processing of images and their reproduction in various ways: from photography to web design and printing. Color management systems directly use colorimetric systems and color measurements in their work, which allows predictable reproduction of color in various ways. But this topic is already beyond the scope of this article, because the fundamental aspects of color theory, and not color reproduction, are touched upon here.
This topic does not pretend to give exhaustive and complete information about the topic raised, but is only a “picture to attract attention” for IT specialists, many of whom are simply obliged to understand the basics of color science. To facilitate understanding, much here is simplified or laid out in passing, therefore, I cite a list of sources that will be interesting to those who want to learn more about color theory (all books can be found on the web):
- Judd D., Vyshetski G. Color in science and technology. - “Mir”, 1978. Book of one of the authors of the XYZ system. In the original - "Color in business, science, and industry"
- Gurevich M.M. Color and its dimension. - Publishing House of the Academy of Sciences of the USSR, 1950. The fundamentals of the science of color are described in detail; explained many nuances that other sources miss
- Noboru Ohta, Alan Robertson. Colorimetry: Fundamentals and Applications. - Wiley, 2005.
- RWG Hunt, MR Pointer. Measuring Color, 4th Edition. - Wiley, 2011.
Source: https://habr.com/ru/post/209738/
All Articles