Modify, but verify: the role of web analytics in interface design
Not so long ago, I attended one event where local Internet businessmen shared their experiences and chewing about their projects on the Internet.
And it so happened that a certain guy was the highlight of the program, let's call him Semyon, who introduced himself as the manager of an online toy store with a daily attendance of more than 17,000 people. And it was true.
Semyon held one of the most important positions in this project and could influence many aspects of the business. The question he addressed to the audience sounded like this: “Friends, we have a rather successful online toy store, but I don’t like its design. For example, here is this thing, or this. I would like to hear your opinion that we can be changed or improved? ”
')
The audience did not wait long and immediately began to spew out a variety of ideas, to offer the development of functionality or the rejection of something.
The only problem is that no one was interested, but what is happening with this store now, what is its conversion? Semyon answered this question somewhat vaguely. He thought or rather guessed about a 2% conversion in what I could hardly believe.
With a number of precise questions, I managed to bring Seeds to the thought that, just like that, it would be of no use what could be changed or improved with a finger to the sky, and maybe even to the detriment.
The meaning of this story is that the overwhelming majority of the current large and small owners of online businesses do exactly the same.
Semyon believed that his personal views and tastes fully meet the expectations of the audience. Therefore, all changes were carried out chaotically according to the principle “but it would not be bad”.
The problem of this approach is to create a universal interface for everyone and, therefore, for anyone. As a result, the site either does not sell at all, or it sells badly. And since almost all sites sell poorly, a magic conversion rate of 1% -2% is considered quite normal. And what happens to the other 98-99% of visitors, why did they leave?
The answer to this question and to the problems of Seeds gives strangely enough web analytics. Recently, every beginner and experienced businessman understands the need to install Google Analytics, but its use, unfortunately, is often limited only to viewing the amount of traffic and may even some kind of trivial data.
In the right hands, information from Google Analytics can provide answers to many questions, in particular, point out the bottlenecks in the interface that really require changes.
After installing the Google Analitycs code, you can immediately track quite a lot of data, but for a complete picture you need to do some more work.
Events allow you to track interface interaction points. For example, on your product description page there are three “Buy” buttons. To find out which of them brings the maximum effect, and which is not effective at all, it is enough to assign a unique event identifier for each of them. For example, like this:
<a href = "/ product / buy" onclick = "_ gaq.push (['_ trackEvent', 'BuyButtons', 'BuyMain', 'Product Name']);" > Buy
Where:
Thus, when you click on any of the buttons, we will know exactly which of them works.
Later, in Google Analitycs reports, the information collected can be seen in the report: “Reports / Behavior / Events / Overview”.
The value of events in terms of interface design is the ability to track the effectiveness of all interactive interface elements. And on the basis of the data of use already cost hypotheses about the necessary changes.
If event settings can still be ignored, then goal tracking should be configured immediately after installing the Google Analitycs code. For the effectiveness of achieving goals is the most important characteristic of the site.
There may be many goals, but it is important to know the measure and not to create stupid goals, such as the length of time spent, the number of pages viewed or a visit to the Payment and Delivery page.
For example, for an online store, logical goals are a visit to the “Basket” page, each page of the checkout process and the final “Thank You Page”. In addition, you can also customize the goals for other lidogenerirovat elements: the question form on the product, callback, and so on.
Unlike events, goals are configured via the Google Analitycs interface: “Admin / Goals / Create Goals”
When creating a goal, you can also specify the sequence of visits to previous pages, for example, the ordering process. Then in the Reports / Conversions / Objectives / Visual Sequence report you can see such a great sales funnel:

In my example, the funnel consists of only two pages.
Having information about the goals, you can quite accurately see where in the sales process you have problems, be it a product card, a shopping cart, an ordering process, or that even with “one right stroke” improve sales on your website.
If your site is an online store, the need to enable and configure e-commerce is just as important as setting goals.
The difference between goals and e-commerce is that the goals speak about the fact of purchase, while the trade says exactly what you bought.
In terms of interface design, e-commerce reports provide such useful information about the audience as the average bill, the time to purchase, the quantity of goods in the order, and can serve as excellent control points to track the effectiveness of the implemented changes.
Now that you have customized events, goals, and e-commerce you can approach the construction of hypotheses about the need for certain changes.
Looking through the reports you can clearly notice such anomalies as intermittent conversions on the way to the final goal or understand that some kind of functional and very beautiful unit does not work, because it does not generate any events.
Based on the identified problems, you can safely remove unnecessary, not working elements, reducing redundant functionality and making the life of your users a little better. Alternatively, pay close attention to the page where a large percentage of interruptions occur and be sure to find the reason that will immediately affect the increase in conversion.
Nevertheless, in spite of its seeming simplicity, it is recommended to make any changes in an already running project through split testing. Thus, firstly, you can protect yourself from incorrect changes, secondly, you can accurately assess the effectiveness of the implemented changes.
A / B testing allows you to test the effectiveness of several page variations. For example, you decided to test the hypothesis that increasing the size of the “Buy” button and its color to bright, contrasting can increase the likelihood of its pressing.
To do this, you need to create a copy of the page with embedded changes and available, for example, by the GET parameter? Split.
That is, if the user opens the page: _http: // site / category / product - he sees the old content, and at _http: // site / category / product? Split opens a page with a large and bright button.
Now, using the Reports / Behavior / Experiments / Create Experiment tool, you can launch your experiment very quickly and test the hypothesis.
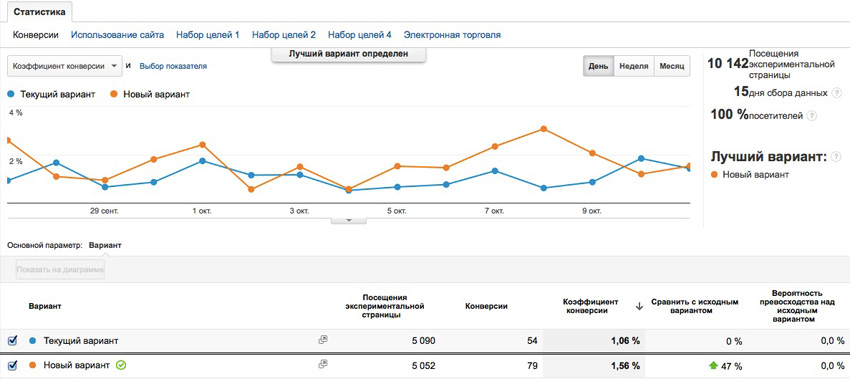
The mechanism of the A / B test is to randomly show the selected audience size of one of the tested options and measure the effectiveness of achieving the goal chosen for the experiment.
Here is one of the reports:
In general, I recommend checking absolutely all changes, whether it is the introduction of a completely new page design or a change in the product description text. But best of all, A / B tests work on small changes, since in the case of changing the entire page, it will be difficult to understand what influences the result.
Returning to the story of Semen, it now becomes clear why his attempts at blind change could turn into a real failure of the entire business.
Any change in a project that is already running should be based on analytical data and verified using tests. This is especially important for highly visited projects with an established core of the audience, as is the case with Semen. After all, what a wonderful and perfect interface would not be implemented on its website, most of the audience would still be terribly unhappy, because the habits are already formed, and the point improvement would be perceived much better. Remember at least iOS7.
PS The material describes the principles of working with classic Google Analitycs, but it is already being replaced by Universal Analitycs, where the method of registering events is somewhat different.
PPS If you find the material interesting, write in the comments what you would like to know more - I’ll be happy to share my practical experience in interface design.
And it so happened that a certain guy was the highlight of the program, let's call him Semyon, who introduced himself as the manager of an online toy store with a daily attendance of more than 17,000 people. And it was true.
Semyon held one of the most important positions in this project and could influence many aspects of the business. The question he addressed to the audience sounded like this: “Friends, we have a rather successful online toy store, but I don’t like its design. For example, here is this thing, or this. I would like to hear your opinion that we can be changed or improved? ”
')
The audience did not wait long and immediately began to spew out a variety of ideas, to offer the development of functionality or the rejection of something.
The only problem is that no one was interested, but what is happening with this store now, what is its conversion? Semyon answered this question somewhat vaguely. He thought or rather guessed about a 2% conversion in what I could hardly believe.
With a number of precise questions, I managed to bring Seeds to the thought that, just like that, it would be of no use what could be changed or improved with a finger to the sky, and maybe even to the detriment.
The meaning of this story is that the overwhelming majority of the current large and small owners of online businesses do exactly the same.
What are the problems Seeds?
Semyon believed that his personal views and tastes fully meet the expectations of the audience. Therefore, all changes were carried out chaotically according to the principle “but it would not be bad”.
The problem of this approach is to create a universal interface for everyone and, therefore, for anyone. As a result, the site either does not sell at all, or it sells badly. And since almost all sites sell poorly, a magic conversion rate of 1% -2% is considered quite normal. And what happens to the other 98-99% of visitors, why did they leave?
The answer to this question and to the problems of Seeds gives strangely enough web analytics. Recently, every beginner and experienced businessman understands the need to install Google Analytics, but its use, unfortunately, is often limited only to viewing the amount of traffic and may even some kind of trivial data.
In the right hands, information from Google Analytics can provide answers to many questions, in particular, point out the bottlenecks in the interface that really require changes.
What to track?
After installing the Google Analitycs code, you can immediately track quite a lot of data, but for a complete picture you need to do some more work.
Set up event tracking
Events allow you to track interface interaction points. For example, on your product description page there are three “Buy” buttons. To find out which of them brings the maximum effect, and which is not effective at all, it is enough to assign a unique event identifier for each of them. For example, like this:
<a href = "/ product / buy" onclick = "_ gaq.push (['_ trackEvent', 'BuyButtons', 'BuyMain', 'Product Name']);" > Buy
Where:
- BuyButtons - a group that will merge your events (the name can be arbitrary)
- BuyMain - event identifier, that is, which button was pressed (the name can be arbitrary)
- Product Name - the name of the product for more accurate analytics.
Thus, when you click on any of the buttons, we will know exactly which of them works.
Later, in Google Analitycs reports, the information collected can be seen in the report: “Reports / Behavior / Events / Overview”.
The value of events in terms of interface design is the ability to track the effectiveness of all interactive interface elements. And on the basis of the data of use already cost hypotheses about the necessary changes.
Set goals
If event settings can still be ignored, then goal tracking should be configured immediately after installing the Google Analitycs code. For the effectiveness of achieving goals is the most important characteristic of the site.
There may be many goals, but it is important to know the measure and not to create stupid goals, such as the length of time spent, the number of pages viewed or a visit to the Payment and Delivery page.
For example, for an online store, logical goals are a visit to the “Basket” page, each page of the checkout process and the final “Thank You Page”. In addition, you can also customize the goals for other lidogenerirovat elements: the question form on the product, callback, and so on.
Unlike events, goals are configured via the Google Analitycs interface: “Admin / Goals / Create Goals”
When creating a goal, you can also specify the sequence of visits to previous pages, for example, the ordering process. Then in the Reports / Conversions / Objectives / Visual Sequence report you can see such a great sales funnel:
In my example, the funnel consists of only two pages.
Having information about the goals, you can quite accurately see where in the sales process you have problems, be it a product card, a shopping cart, an ordering process, or that even with “one right stroke” improve sales on your website.
Set up e-commerce
If your site is an online store, the need to enable and configure e-commerce is just as important as setting goals.
The difference between goals and e-commerce is that the goals speak about the fact of purchase, while the trade says exactly what you bought.
In terms of interface design, e-commerce reports provide such useful information about the audience as the average bill, the time to purchase, the quantity of goods in the order, and can serve as excellent control points to track the effectiveness of the implemented changes.
I did everything, what's next?
Now that you have customized events, goals, and e-commerce you can approach the construction of hypotheses about the need for certain changes.
Looking through the reports you can clearly notice such anomalies as intermittent conversions on the way to the final goal or understand that some kind of functional and very beautiful unit does not work, because it does not generate any events.
Based on the identified problems, you can safely remove unnecessary, not working elements, reducing redundant functionality and making the life of your users a little better. Alternatively, pay close attention to the page where a large percentage of interruptions occur and be sure to find the reason that will immediately affect the increase in conversion.
Nevertheless, in spite of its seeming simplicity, it is recommended to make any changes in an already running project through split testing. Thus, firstly, you can protect yourself from incorrect changes, secondly, you can accurately assess the effectiveness of the implemented changes.
A / B Testing
A / B testing allows you to test the effectiveness of several page variations. For example, you decided to test the hypothesis that increasing the size of the “Buy” button and its color to bright, contrasting can increase the likelihood of its pressing.
To do this, you need to create a copy of the page with embedded changes and available, for example, by the GET parameter? Split.
That is, if the user opens the page: _http: // site / category / product - he sees the old content, and at _http: // site / category / product? Split opens a page with a large and bright button.
Now, using the Reports / Behavior / Experiments / Create Experiment tool, you can launch your experiment very quickly and test the hypothesis.
The mechanism of the A / B test is to randomly show the selected audience size of one of the tested options and measure the effectiveness of achieving the goal chosen for the experiment.
Here is one of the reports:
In general, I recommend checking absolutely all changes, whether it is the introduction of a completely new page design or a change in the product description text. But best of all, A / B tests work on small changes, since in the case of changing the entire page, it will be difficult to understand what influences the result.
Epilogue
Returning to the story of Semen, it now becomes clear why his attempts at blind change could turn into a real failure of the entire business.
Any change in a project that is already running should be based on analytical data and verified using tests. This is especially important for highly visited projects with an established core of the audience, as is the case with Semen. After all, what a wonderful and perfect interface would not be implemented on its website, most of the audience would still be terribly unhappy, because the habits are already formed, and the point improvement would be perceived much better. Remember at least iOS7.
PS The material describes the principles of working with classic Google Analitycs, but it is already being replaced by Universal Analitycs, where the method of registering events is somewhat different.
PPS If you find the material interesting, write in the comments what you would like to know more - I’ll be happy to share my practical experience in interface design.
Source: https://habr.com/ru/post/209592/
All Articles