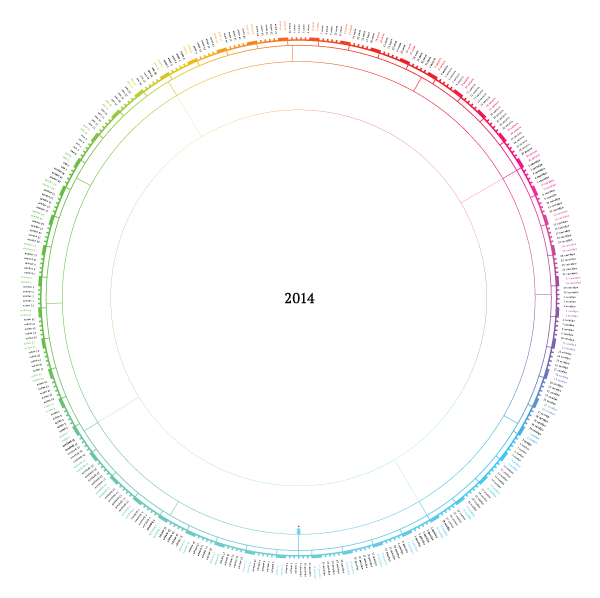
Kruglendar for 2014
Hello, friends!
Last year I made the first captainer .
We continue, we experiment.
The idea of the project is to create a calendar that allows you to see all the days of the year, recall the pleasant moments of the past and the expected events of the future.
There are a lot of analogues , the peculiarity of this project is minimalism and emptiness, because the foreground should be the doodle of the owner.
')
• Download from Github (or git clone github.com/illus0r/kruglendar2014.git )
• We print on A1 format
• We hang on the wall in a convenient place (especially good - in the toilet), next - a felt-tip pen on a thread.
• Did something interesting happen? Famously draws a captainer! By the end of the year it will be fun to watch.

Also, like the previous one, this calendar is published under the Creative Commons Attribution 3.0 license 3.0 Unported.
Happy New Year!
Under the cut a little about the process of creation.
Process
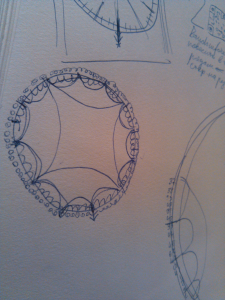
This year it all started with sketches. I thought to do something heaped up and fractal, with the lunar calendar in the appendage. But back to the first minimalist sketch.

As a real bummer, I decided to write a script that does the lion’s share of the work. So the opportunity to play in sizes, thicknesses and, of course, fonts.
At first I set the radii and thickness of the circles by hand, but then I decided that it would be much more natural and pleasant if they were determined by a geometric progression.
Over the flowers for a long time did not think. In Photoshop, I opened the color selection window and switched to the mode with the same Lightness Lab color scheme (it takes into account human perception of color and the intensity of colors will be similar).
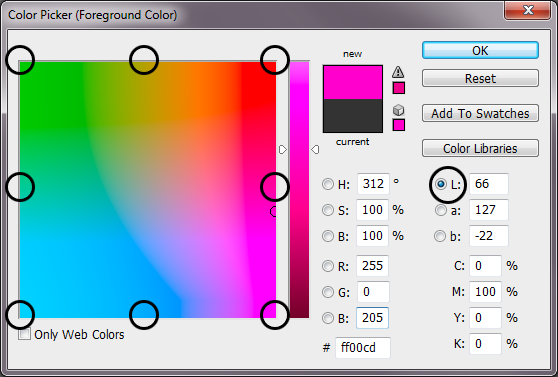
There are several points, the rest are obtained by interpolation. Well, I chose not the easiest way, and I could get by with the mask in the illustrator. But so fun!
The script itself
# -*- coding: utf-8 -*- import svgwrite, math, numpy def frange(x, y, jump): while x < y: yield x x += jump if __name__ == '__main__': # Calendar parameters textAngleShift = -(0.26*math.pi*2/365) canvasSize = (500,707) mid = canvasSize[0]/2.0, canvasSize[1]/2.0 dayFontFamily = "PT Sans" dayFontSize = "1.8pt" svgFileName = 'calendar_03.svg' # we will interpolate rainbow gradient through these points rainbowGradient = [[ 0, 0, 0,239,255,255, 0, 0], # Red [254,248,246,194, 0, 0,211,254], # Green [255,193, 0, 0, 0,210,255,255]] # Blue rainbowGradientPoints = [math.pi*2/7*0, math.pi*2/7*1, math.pi*2/7*2, math.pi*2/7*3, math.pi*2/7*4, math.pi*2/7*5, math.pi*2/7*6, math.pi*2/7*7 ] #======================================= # Calendar circle parameters #======================================= k = 3.0 # multiplication koef. delta = 1.9 # first step in progression initRad = canvasSize[0]*0.3684 # initial size radiusProgression = [initRad] for i in range(4): nextValue = initRad-delta*pow(k,i) radiusProgression += [nextValue] R_dates = 1.2*canvasSize[0]*0.312 R_days_end, \ R_days_beg, \ R_weeks_beg, \ R_mounthes_beg, \ R_seasons_beg = radiusProgression #R_weekend_end = R_days_beg + 20; R_weekend_end = R_days_end; # Stroke width stroke_k = 1.8 stroke_thinest = 0.15 dayLineStrokeWidth, \ weekLineStrokeWidth, \ mounthLineStrokeWidth, \ seasonLineStrokeWidth = [0.1*(stroke_k**i) for i in range(4,0,-1)] weekendStrokeWidth = 6.7 #======================================= # Filling mounth arrays #======================================= dayAngle = math.pi*2/365 weekAngle = dayAngle*7 mounthes = [u'',\ u'',\ u'',\ u'',\ u'',\ u'',\ u'',\ u'',\ u'',\ u'',\ u'',\ u''\ ] mounthDays = [31,28,31,30,31,30,31,31,30,31,30,31] # days in each mounth yearDays = ["%d %s"%(i+1, mounthes[index]) \ for index, m in enumerate(mounthDays) \ for i in range(m)] # array with marks for yearDays: # 1 means first day of mounth # 2 means first day of mounth and of season allFirstDates = [ 0 if i!=0 else \ 1 if (index+1)%3!=0 else \ 2 \ for index, m in enumerate(mounthDays) \ for i in range(m)] mounthAngles = [d*dayAngle for d in mounthDays] #======================================= # Making svg and groups #======================================= dwg = svgwrite.Drawing(svgFileName, profile='tiny') textGroup = dwg.g(font_family=dayFontFamily, \ font_size=dayFontSize,\ text_anchor="start" ) dayLineGroup = dwg.g(stroke_width=dayLineStrokeWidth, fill='none') weekLineGroup = dwg.g(stroke_width=weekLineStrokeWidth, fill='none') mounthLineGroup = dwg.g(stroke_width=mounthLineStrokeWidth, fill='none') seasonLineGroup = dwg.g(stroke_width=seasonLineStrokeWidth, fill='none') weekendGroup = dwg.g(stroke_width=weekendStrokeWidth, fill='none') #======================================= # Drawing in defined groups #======================================= for index, angle in enumerate(frange(0,math.pi*2,dayAngle)): # interpolation will help us to find # all necessary segments for every segment of circles colorTuple = (int(numpy.interp(angle, rainbowGradientPoints, \ rainbowGradient[0])), \ int(numpy.interp(angle, rainbowGradientPoints, \ rainbowGradient[1])), \ int(numpy.interp(angle, rainbowGradientPoints, \ rainbowGradient[2]))) color = "rgb%s"%(str(colorTuple)) sinus = math.sin(angle) cosinus = math.cos(angle) # Draw a week segment if (index-5)%7 == 0: weekLineGroup.add (dwg.line( (mid[0]-R_weeks_beg*sinus, \ mid[1]+R_weeks_beg*cosinus), \ (mid[0]-R_days_beg *sinus,mid[1]+R_days_beg *cosinus), \ stroke=color) ) # Draw a weekend sinus_weekend = math.sin(angle-dayAngle) cosinus_weekend = math.cos(angle-dayAngle) weekendGroup.add (dwg.line( (mid[0]-R_days_beg*sinus_weekend, \ mid[1]+R_days_beg*cosinus_weekend), \ (mid[0]-R_weekend_end *sinus_weekend,mid[1]+R_weekend_end *\ cosinus_weekend), \ stroke=color) ) #if (index-) weekLineGroup.add (dwg.line( (mid[0]-R_weeks_beg*sinus, \ mid[1]+R_weeks_beg*cosinus), \ (mid[0]-R_days_beg *sinus,mid[1]+R_days_beg *cosinus), \ stroke=color) ) # Draw a mounth+season segments if allFirstDates[index]!=0: mounthLineGroup.add (dwg.line( (mid[0]-R_mounthes_beg*sinus,mid[1]+\ R_mounthes_beg*cosinus), \ (mid[0]-R_weeks_beg *sinus,mid[1]+R_weeks_beg*cosinus), \ stroke=color) ) # Draw a season segments if allFirstDates[index]==2: seasonLineGroup.add (dwg.line( (mid[0]-R_seasons_beg*sinus,mid[1]+\ R_seasons_beg*cosinus), \ (mid[0]-R_mounthes_beg *sinus,mid[1]+R_mounthes_beg*cosinus), \ stroke=color) ) # Draw a day segments dayLineGroup.add (dwg.line( (mid[0]-R_days_beg*sinus,mid[1]+\ R_days_beg*cosinus), \ (mid[0]-R_days_end *sinus,mid[1]+R_days_end *cosinus), \ stroke=color ) ) # Draw a day name if (index-4)%7 == 0 or (index-3)%7 == 0: fillColor = color #"rgb(255,255,255)" #fontWeight = "bold" weekendMargin = 2.0 else: fillColor = "rgb(0,0,0)" #fontWeight = "normal" weekendMargin = 0 wordGroup = dwg.g(transform="rotate(%f, %f, %f) translate(%f,0)" \ %( math.degrees(angle+dayAngle+textAngleShift)+90, \ mid[0], mid[1], +R_dates+weekendMargin ) \ ) wordGroup.add( dwg.text( '%s'%(yearDays[index]), \ insert=mid, fill=fillColor \ #,style="font-weight: %s;"%(fontWeight) )) textGroup.add(wordGroup) #======================================= # Dray a circle segments #======================================= sinus_end = math.sin(angle+dayAngle) cosinus_end = math.cos(angle+dayAngle) dayLineGroup.add( dwg.line( (mid[0]-R_days_beg*sinus, \ mid[1]+R_days_beg*cosinus), \ (mid[0]-R_days_beg*sinus_end,mid[1]+R_days_beg*cosinus_end), \ stroke=color ) ) weekLineGroup.add( dwg.line((mid[0]-R_weeks_beg*sinus, \ mid[1]+R_weeks_beg*cosinus), \ (mid[0]-R_weeks_beg*sinus_end,mid[1]+R_weeks_beg*cosinus_end), \ stroke=color ) ) mounthLineGroup.add( dwg.line((mid[0]-R_mounthes_beg*sinus, \ mid[1]+R_mounthes_beg*cosinus), \ (mid[0]-R_mounthes_beg*sinus_end,mid[1]+R_mounthes_beg*cosinus_end), \ stroke=color ) ) seasonLineGroup.add( dwg.line((mid[0]-R_seasons_beg*sinus, \ mid[1]+R_seasons_beg*cosinus), \ (mid[0]-R_seasons_beg*sinus_end,mid[1]+R_seasons_beg*cosinus_end), \ stroke=color ) ) #======================================= # Simple circles for quick testing #======================================= #dayLineGroup.add( dwg.circle(center=mid, r=R_days_end, stroke='black' ) ) #dayLineGroup.add( dwg.circle(center=mid, r=R_days_beg, stroke='black' ) ) #weekLineGroup.add( dwg.circle(center=mid, r=R_weeks_beg, stroke='black' ) ) #mounthLineGroup.add( dwg.circle(center=mid, r=R_mounthes_beg, stroke='black' ) ) #seasonLineGroup.add( dwg.circle(center=mid, r=R_seasons_beg, stroke='black') ) dwg.add(dayLineGroup) dwg.add(weekLineGroup) dwg.add(mounthLineGroup) dwg.add(seasonLineGroup) dwg.add(weekendGroup) dwg.add(textGroup) # As I didn't learn how to set document width and height, just draw a rect dwg.add(dwg.rect((0, 0), canvasSize, stroke='gray', fill="none")) dwg.add(dwg.text("2014", insert=(mid[0],mid[1]+4), \ text_anchor="middle", font_family="PT Serif", font_size="10pt")) #======================================= # Finaly, draw it! #======================================= dwg.save() At the output we get such a SVG file , which remains to be slightly modified with a

Oh, la! Kruglendar ready. We make a group in contact to get feedback, write readme for GitHub and an article on Habr.
Thank you all for your attention, I will be glad to your comments.
Source: https://habr.com/ru/post/209550/
All Articles