New features for profiling Windows Store applications in Visual Studio 2013

Performance is one of the most important characteristics of any application, along with functionality and design. It is also one of the common reasons for the failure of the certification process and the publication of the application in the Windows Store.
A good application should be fast, work smoothly and economically use hardware resources. For this, performance needs attention, as well as design and functionality.
')
Visual Studio 2013 introduced new profiling and performance analysis features that allow you to quickly find common bottlenecks in applications.
Profiling capabilities
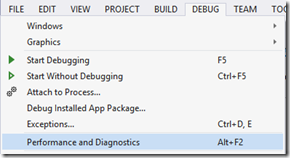
In Visual Studio 2013, pre-existing capabilities for profiling Windows Store applications and new, added features were transferred to a special wizard, Performance and Diagnostics Hub . It allows developers to collect data and analyze the use of hardware resources, interface performance and application code.
You can find it in the Debug or Analyze menu.
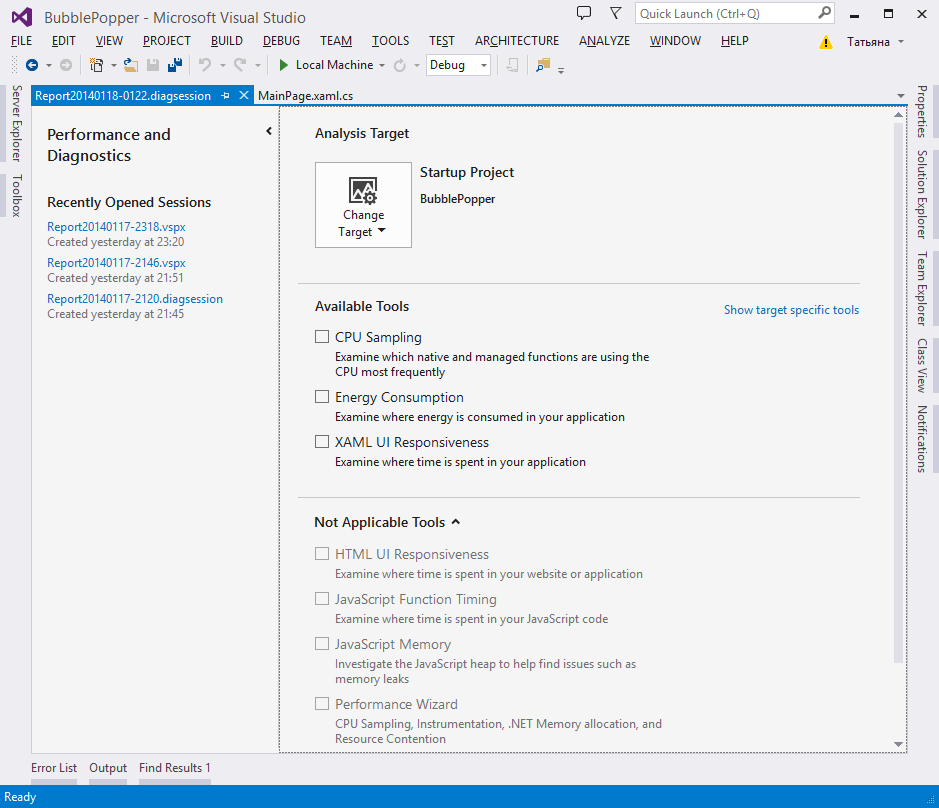
So, you have the following options:
- CPU Sampling . Collect CPU usage data.
- Energy Consumption . Collecting statistics of energy consumption, which is especially important for RT devices, without using any additional iron.
- HTML UI Responsiveness . Collection of statistics on the response time of pages and controls for HTML \ JavaScript applications.
- XAML UI Responsiveness . Collect statistics on the response time of pages and controls for XAML \ C # applications.
- Javascript memory . Collect statistics on memory usage. Allows you to find memory leaks in JavaScript applications.
- JavaScript function timing . Displays information on the execution time of javascript functions.
- Performance Wizard . It still exists. Used mainly for profiling classic client applications or ASP.NET applications.
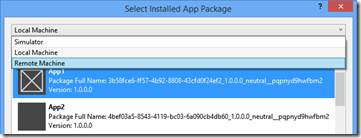
You can profile not only an open application in the studio, but also any other installed application, as well as an ASP.NET application or an exe file.

If you choose an already installed application, then you have the opportunity to profile it not only on your local computer, but also on any other remote computer available .
Profiling Windows 8.1 applications
Now let's see how to use and apply new features to diagnose performance problems with an application.
We will explore the possibilities of profiling using the example of a simple toy BubblePopper .
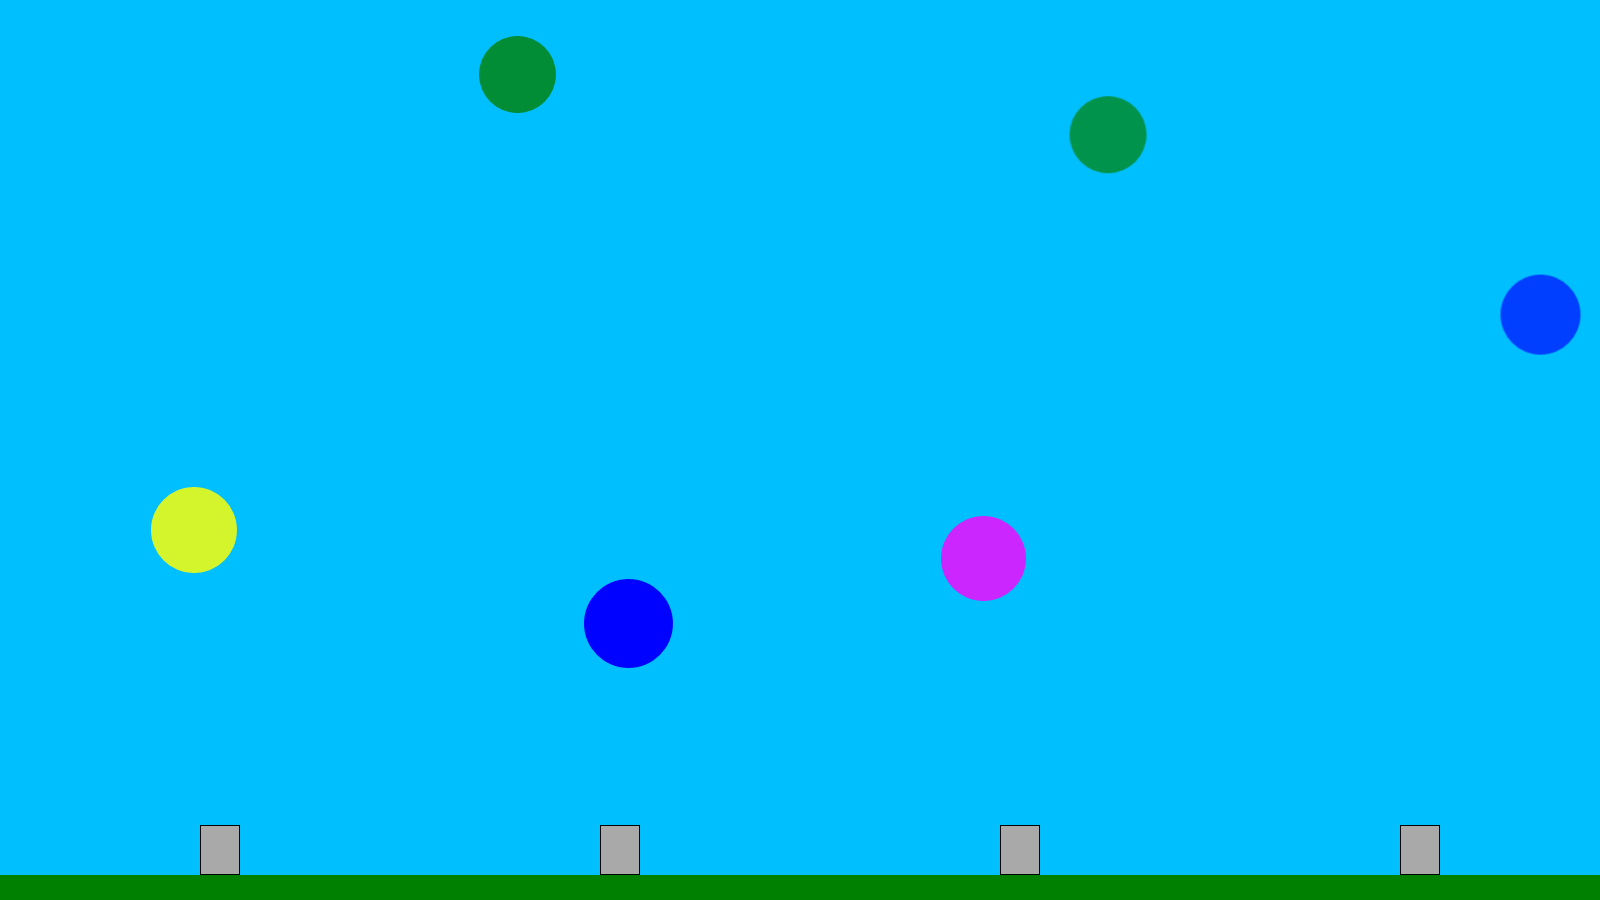
The toy generates balls that must be “crushed” before they reach the “ceiling”.
Download the source code for the experiments here: http://sdrv.ms/1bgyAwP
CPU usage
Data collection
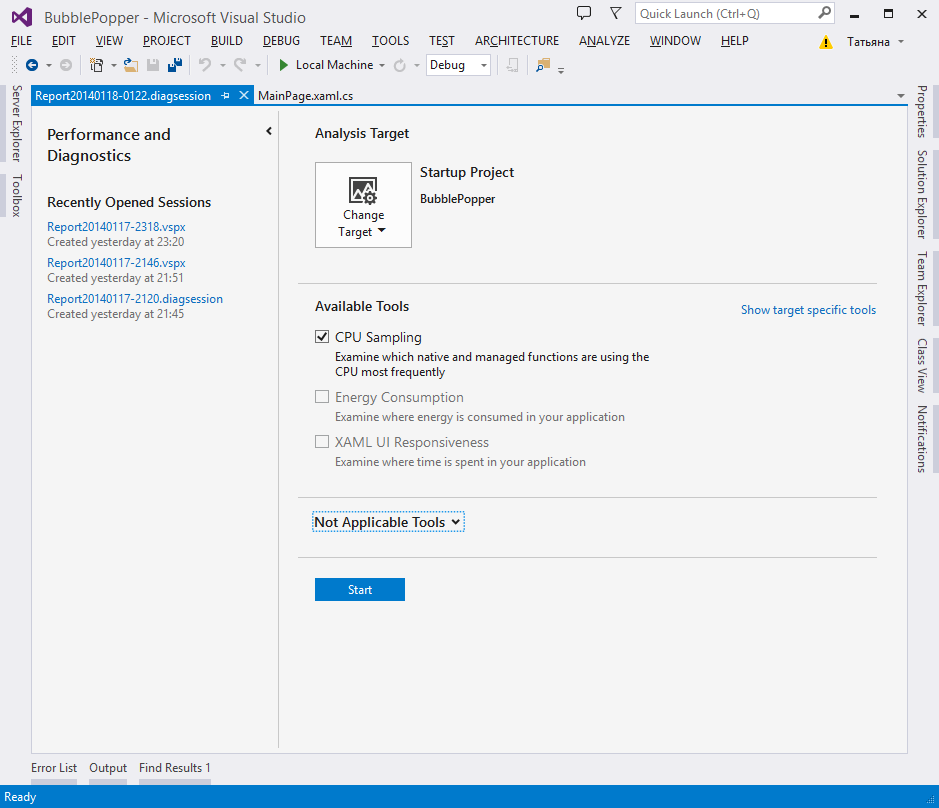
Open the BubblePopper application in Visual Studio 2013. In the top menu, select Analyze - Performance and Diagnostics . In the window that opens, check the CPU Sampling box and click the Start button.
The application will start and begin collecting data.
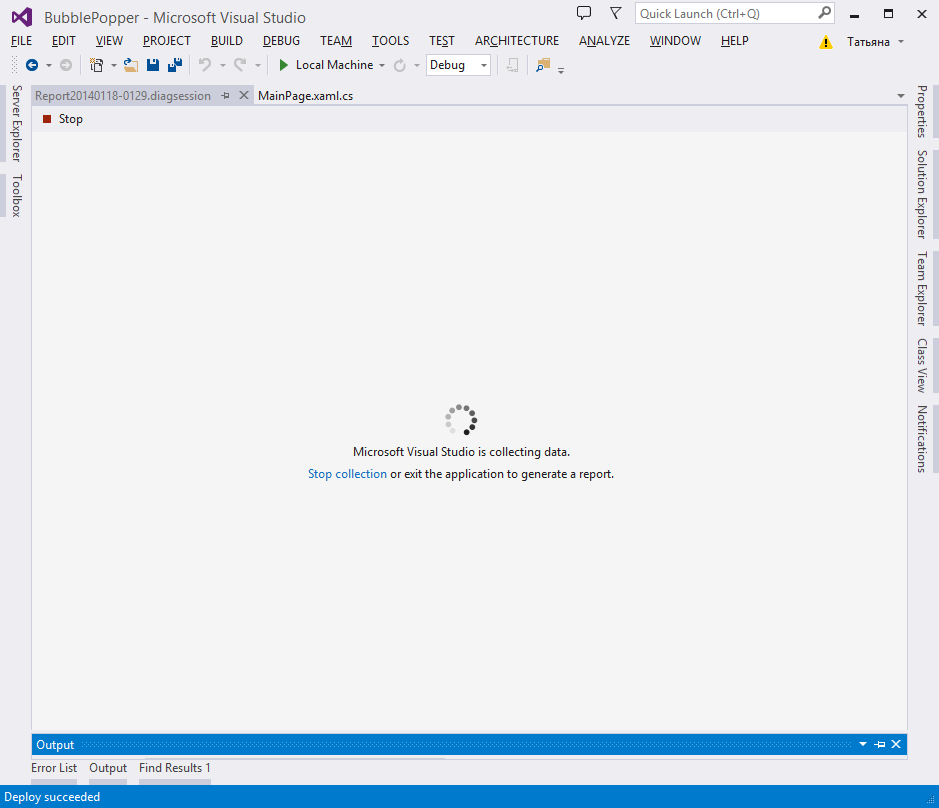
Use the app for a minute or so, and then stop debugging and data collection.
Analysis
After the analysis and data processing are completed, a report will open containing the following information blocks:
- CPU chart : shows the percentage of CPU usage by the application. When we actively "crushed" the balls, the processor is used a little more, when less actively - a little less. The report shows that we have no problems and sharp peaks.
- Hot path : displays the call stack of the application and the execution time of the methods.
- Functions doing the most individual work : the functions for which the most CPU time was spent.
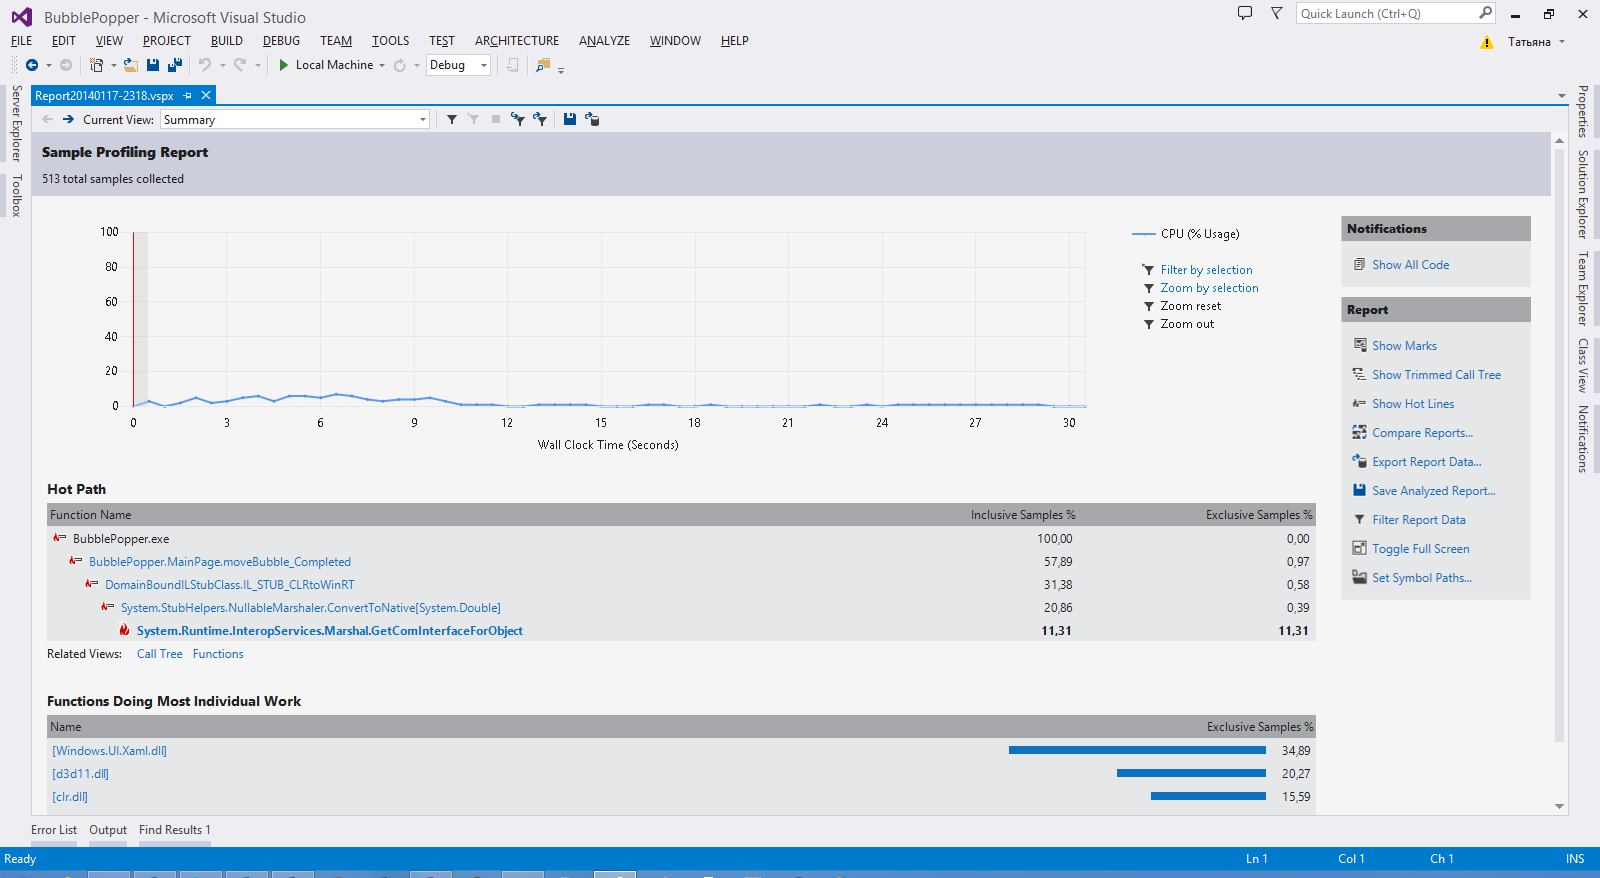
Nothing criminal, you say. If you pay attention, the MainPage.moveBubble_Completed method has been running longer than others and is even marked with a special icon with a twinkle. Click on it. You will be taken to the Function Details report.
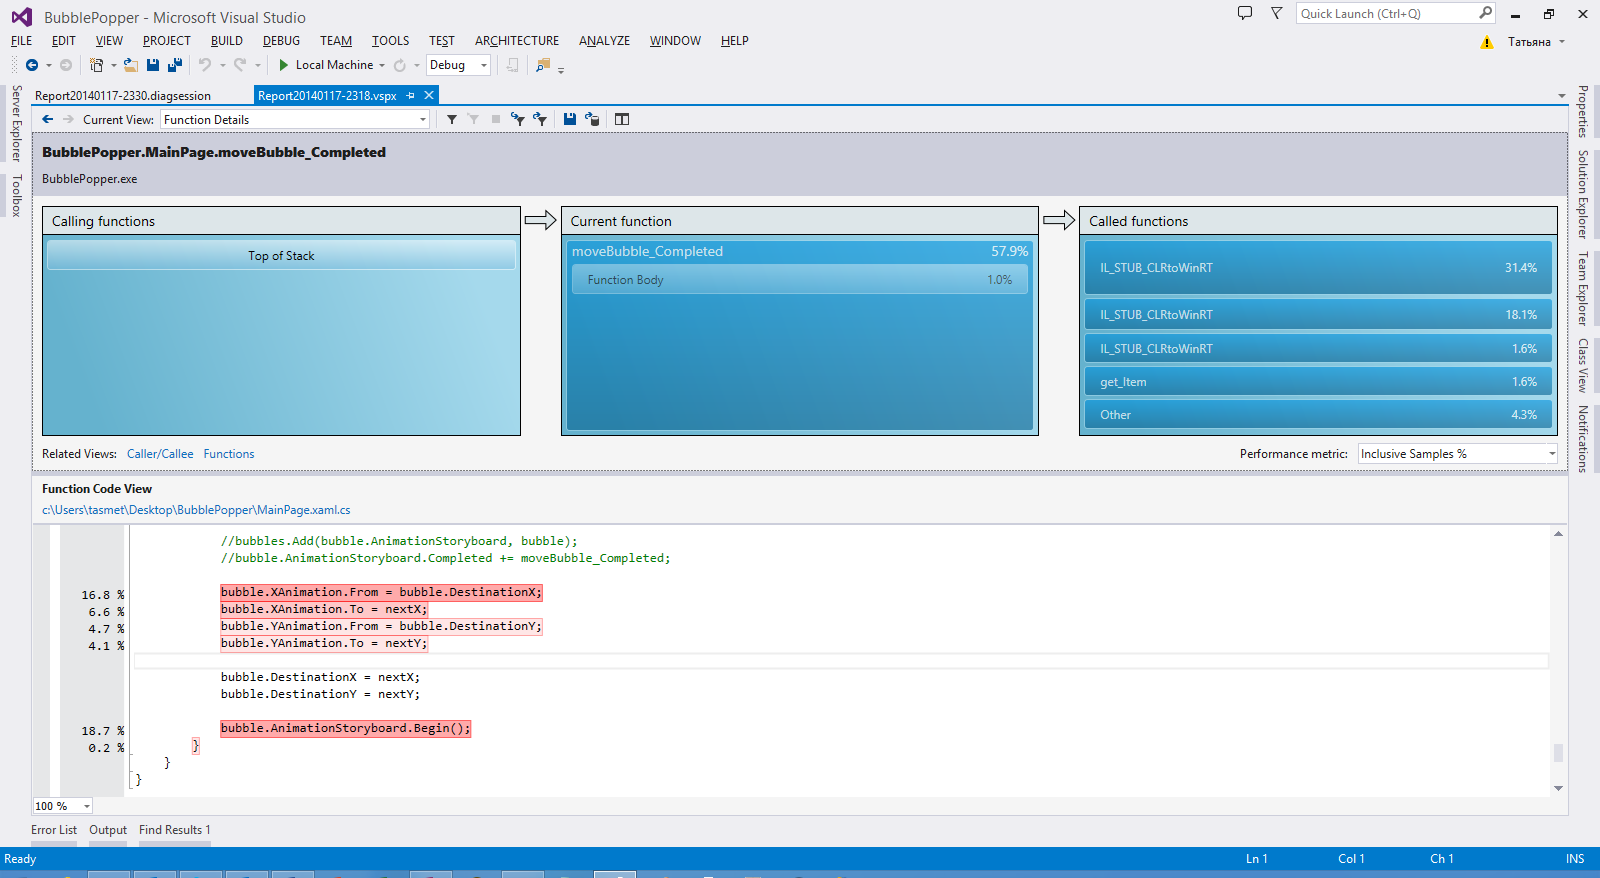
Function Details, in my opinion, is the most useful part of the CPU report. The report shows where our method is called from and who it calls. But the most interesting thing is that it shows exactly which lines of your code are running the longest. This will allow you to work purposefully and optimize only the slowest parts of the code without spending a lot of time searching.
power usage
Data collection
Open the BubblePopper application in Visual Studio 2013. In Solution Explorer, open the MainPage.xaml.cs file and uncomment the call in the moveBubble_Completed method:
void moveBubble_Completed(object sender, object e) { … OpenWebSite("http://microsoft.com"); } This will allow us for test purposes to generate http traffic visible on the report.
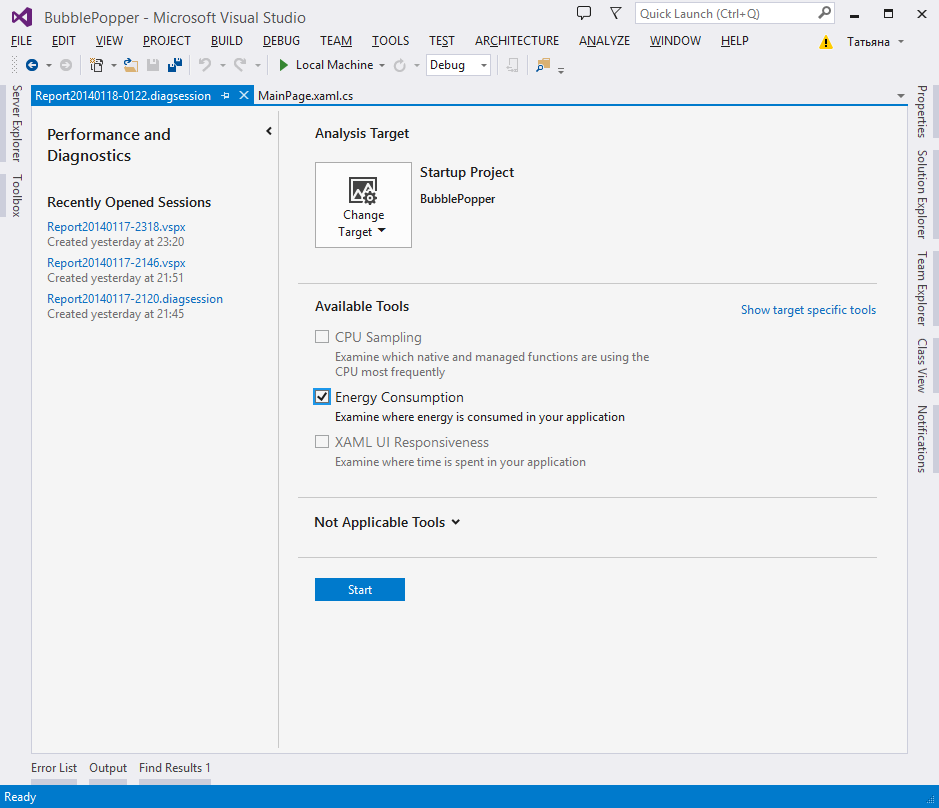
Next, in the top menu, select Analyze - Performance and Diagnostics .
In the window that opens, tick the Energy Consumption checkbox and click the Start button.
The application will start and begin collecting data.

Use the app for a minute or so, and then stop debugging and data collection.
Analysis
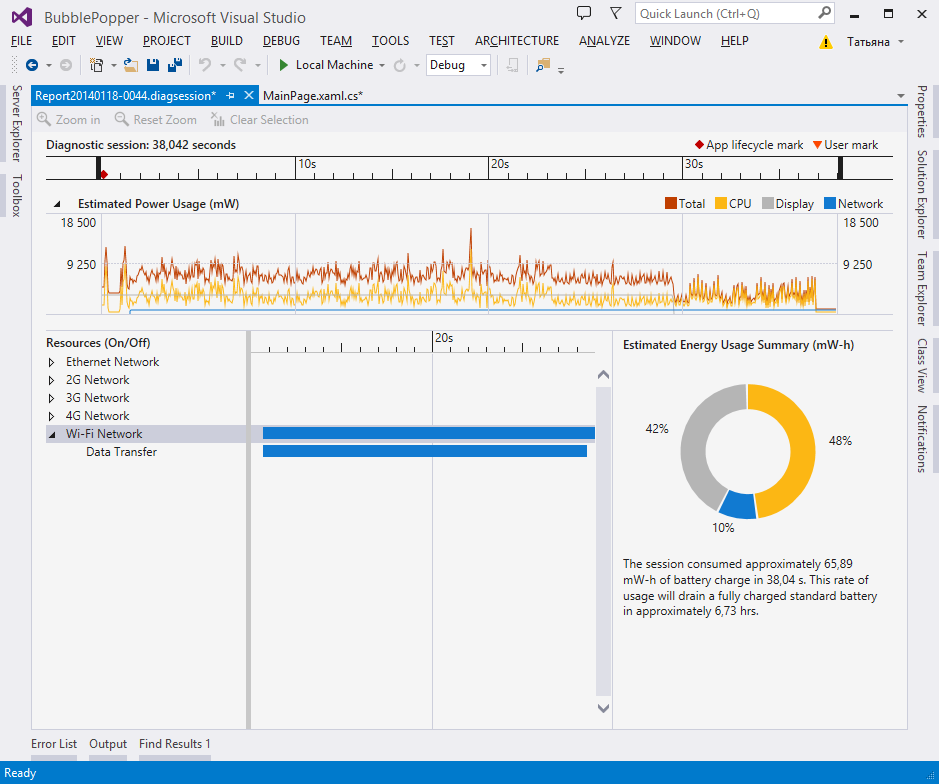
After the analysis and data processing is completed, a report will open containing information on the use of the processor, network and battery.
Our report looks fine, nothing critical, but let's do an experiment and slightly optimize our code to see the difference.
Open the MainPage.xaml file and replace the moveBubble_Completed method with the following:
void moveBubble_Completed(object sender, object e) { Storyboard oldStoryBoard = (Storyboard)sender; Bubble bubble = (Bubble)bubbles[oldStoryBoard]; double? xTo = bubble.DestinationX; double? yTo = bubble.DestinationY; double nextX = BubbleResources.NextXPoint(xTo); double nextY = BubbleResources.NextYPoint(yTo); //Check to see if the buble is off the top of of the screen if (yTo < 0 - bubble.BubbleEllipse.ActualHeight) { //Remove the old storyboard bubbles.Remove(bubble.AnimationStoryboard); //Remove the ellipse from the XAML tree LayoutRoot.Children.Remove(bubble.BubbleEllipse); return; } bubble.XAnimation.From = bubble.DestinationX; bubble.XAnimation.To = nextX; bubble.YAnimation.From = bubble.DestinationY; bubble.YAnimation.To = nextY; bubble.DestinationX = nextX; bubble.DestinationY = nextY; bubble.AnimationStoryboard.Begin(); } We optimized the work of the method and removed the generation of network activity. Let's restart the app and collect Energy Consumption data. As a result, we get the following report.

As you can see, the use of network resources has ceased, and the use of the battery has also been reduced from 48% to 43% due to the optimization of the application code.
UI performance
Data collection
Open the BubblePopper application in Visual Studio 2013 (it is advisable to open the application version without code fixes).
In the top menu, select Analyze - Performance and Diagnostics . In the window that opens, tick the XAML UI Responsiveness and click the Start button. If we had an HTML / JavaScript application, then this place would be the HTML UI Responsiveness setting.

The application will start and begin collecting data.

Use the app for a minute or so, and then stop debugging and data collection.
Analysis
After the analysis and data processing are completed, a report will open containing information on the page loading time, controls and code execution. All this in relation to the life cycle of the application.

In the report you can see that a lot of resources are spent on executing the application code, compared to the interface.
Let's conduct an experiment and optimize our code in the same way as in the previous example.
Open the MainPage.xaml file and replace the moveBubble_Completed method with the following:
void moveBubble_Completed(object sender, object e) { Storyboard oldStoryBoard = (Storyboard)sender; Bubble bubble = (Bubble)bubbles[oldStoryBoard]; double? xTo = bubble.DestinationX; double? yTo = bubble.DestinationY; double nextX = BubbleResources.NextXPoint(xTo); double nextY = BubbleResources.NextYPoint(yTo); //Check to see if the buble is off the top of of the screen if (yTo < 0 - bubble.BubbleEllipse.ActualHeight) { //Remove the old storyboard bubbles.Remove(bubble.AnimationStoryboard); //Remove the ellipse from the XAML tree LayoutRoot.Children.Remove(bubble.BubbleEllipse); return; } bubble.XAnimation.From = bubble.DestinationX; bubble.XAnimation.To = nextX; bubble.YAnimation.From = bubble.DestinationY; bubble.YAnimation.To = nextY; bubble.DestinationX = nextX; bubble.DestinationY = nextY; bubble.AnimationStoryboard.Begin(); } Restart the app and collect the XAML UI Responsiveness data. As a result, we get the following report.

The report shows that the code began to work significantly faster.
There is another useful feature in this report. View statistics on the performance of pages and controls. To view statistics, click on the Parsing link.

In this view, it is convenient to look for not optimally working controls and components.
By the way, this is not all the features of Performance and Diagnostics Hub, but the main and most applicable and useful.
Conclusion
In this article, we focused on the profiling and performance analysis of Windows Store applications in VisualStudio 2013, such as:
- CPU usage.
- Power usage.
- UI performance.
I hope this information will help you to get acquainted and start using the capabilities of VisualStudio 2013 to improve the performance of your Windows Store applications.
Useful materials
Channel 9: Performance and Diagnostics Hub
Build 2013: Diagnosing Issues in JavaScript Windows Store Apps with Visual Studio 2013
Build 2013: Developing High Performance Performance Tools
Build 2013: Visual Studio 2013 Diagnostics Tools for XAML-Based Windows Store Apps
MSDN: Configure remote profiling on the remote device
Source: https://habr.com/ru/post/209538/
All Articles