Fast graphics output in Matlab
The author wants to share his experience in organizing quick redrawing of graphs (more precisely, images,) in Matlab on the example of organizing a radar indicator of a circular view (PPI, it is in the PPI English literature).
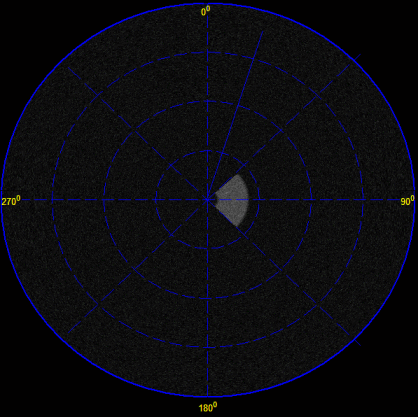
The bottom line is that in the same Matlab a simulator of the radar signal was sent, sending data over the network. And, on the other hand, for testing, I connected the machine with Matlab, which received the data over the network and displayed it on an IKO-like indicator. Even those who are far from the radar theme, probably saw the ICE at least in the movies. In Matlab this thing looks like this:

The angular slider represents the position of the radar antenna beam. The real radar antenna made a complete turn in 4-6 seconds and the task was to achieve the display speed as close as possible to real-time.
But how to display such an image on a graph? Use operator Matlab polar? Not really, the output speed will be just snail.
At the beginning, an attempt was made to display an image using standard Matlab tools: image instructions (well, or, imagesc). The result was sad: image allowed to make one complete rotation on the screen for 2 minutes, i.e. 20 times slower than required.
')
But a way out was found. It turned out that there is a much faster way to display the image on the screen. For this, the image command is given only once and the link to it is remembered.
Next - a matrix is created - a copy of the image. The initial load of this matrix can be made from the properties of the object h like so:
The necessary calculations and changes to the ImageMatrix matrix are performed. After that, the new matrix is displayed on the screen with commands
This conclusion is at least an order of magnitude (and actually more) faster than when the image command is called each time.
In order not to redraw the markup and the slider (especially since the gray palette was used, so it would be problematic to draw them with colored) lines, distance circles, corner slider and numbers were drawn with the commands line, text, ellipse, etc. The only problem that arose with this was the recalculation of coordinates (the graph and lines, alas, live in different worlds in Matlab). And, becauseit was very lazy there was no time to thoroughly deal with these recalculations was done as follows: by turning on the “Annotation” menu, markup elements were drawn by hand and transferred to the code automatically. As a result, there are some inaccuracies: the picture shows that the beginning of the corner slider slightly misses the center of the PPI.
In the end, on a machine with an i7 processor, 16GB of RAM and a GeForce 690 video card, the program fit into real-time using the CUDA capabilities of the video card, even though the object-oriented programming style was used in Matlab. This made it possible to avoid the tedious stage of transferring the program from Matlab to C / C ++ or Delphi.
I hope this technique is useful to someone.
The bottom line is that in the same Matlab a simulator of the radar signal was sent, sending data over the network. And, on the other hand, for testing, I connected the machine with Matlab, which received the data over the network and displayed it on an IKO-like indicator. Even those who are far from the radar theme, probably saw the ICE at least in the movies. In Matlab this thing looks like this:

The angular slider represents the position of the radar antenna beam. The real radar antenna made a complete turn in 4-6 seconds and the task was to achieve the display speed as close as possible to real-time.
But how to display such an image on a graph? Use operator Matlab polar? Not really, the output speed will be just snail.
At the beginning, an attempt was made to display an image using standard Matlab tools: image instructions (well, or, imagesc). The result was sad: image allowed to make one complete rotation on the screen for 2 minutes, i.e. 20 times slower than required.
')
But a way out was found. It turned out that there is a much faster way to display the image on the screen. For this, the image command is given only once and the link to it is remembered.
h = image(... Next - a matrix is created - a copy of the image. The initial load of this matrix can be made from the properties of the object h like so:
ImageMatrix = get(h,'CData'); The necessary calculations and changes to the ImageMatrix matrix are performed. After that, the new matrix is displayed on the screen with commands
set(h,'CData',ImageMatrix); drawnow; This conclusion is at least an order of magnitude (and actually more) faster than when the image command is called each time.
In order not to redraw the markup and the slider (especially since the gray palette was used, so it would be problematic to draw them with colored) lines, distance circles, corner slider and numbers were drawn with the commands line, text, ellipse, etc. The only problem that arose with this was the recalculation of coordinates (the graph and lines, alas, live in different worlds in Matlab). And, because
In the end, on a machine with an i7 processor, 16GB of RAM and a GeForce 690 video card, the program fit into real-time using the CUDA capabilities of the video card, even though the object-oriented programming style was used in Matlab. This made it possible to avoid the tedious stage of transferring the program from Matlab to C / C ++ or Delphi.
I hope this technique is useful to someone.
Source: https://habr.com/ru/post/209506/
All Articles