NetApp FAS storage testing using IOMeter load generator
During the testing of storage systems, specialists often encounter performance problems due to the nuances of tuning the entire complex. For load testing of storage systems, it is not enough just to run the load simulator, you need to configure the storage system, network and host. The bulk of the settings, as a rule, is performed on the host.
The purpose of this article is to assist system administrators and system integrators in understanding the settings and nuances when testing NetApp storage systems. I also want to note that this article did not have the task of obtaining the highest possible performance of NetApp FAS 2240 controllers, since at the time of testing the demo equipment there were not enough disks (144 maximum) for the storage system , and there was only one server available. Those. Maximum performance is considered here in the context of a specific configuration of the demo stand, in other words, with a larger number of disks, servers and network connections, it is possible to get even better results with the same 2240 controllers. Although all the graphs with performance results are taken from actual configurations of end customers using in tests 2240 controllers, in some tests four SSD 100GB MLC disks were used.
Below is a comprehensive description of load testing of storage systems : IOMeter simulator settings, NetApp FAS host and storage configuration methods, load statistics removal, and interpretation of the results. Using the example of an existing demo stand, the methods of setting up all its components, as well as other possible configuration options using NetApp FAS, will be considered.
')
NetApp FAS HA2240-2 with 4x FC 8 ports 24x600x10k SAS , ONTAP 7-Mode 8.2
SAN switch
Cisco UCS C210 intel Xeon EM64T 64-bit 2x6 cores 1,999 GHz 32 GB of RAM , VMWare ESXi 5.1
Windows 2008 R2 x64 RDM virtual machine connecting to the LUN .
All disks are divided equally between the controllers: 12 to one and 12 to another. On each disk set, one aggr0 unit is created, on each unit there is one system partition vol0 and one partition vol1 occupying all the free space on the unit, one moon is created on each partition occupying all available free on it. As a rule, it is recommended to create the largest aggregate of the longest raid groups. When creating the moon, the geometry was chosen corresponding to the host to which the LUN will be presented.
For monitoring and troubleshooting the SAN switch, it is convenient to use the free Brocade SANHealth utility. So a clogged fiber-optic connector can lead to performance problems. From real life: a multipassing driver with the included Round-Robin policy, due to a broken link, created huge queues on an HBA adapter, which resulted in large delays in the I / O system and high CPU utilization.
Also do not forget that the FC link itself, for example, 4G can physically miss no more than 400 MB / s. When generating more traffic, you will also notice an increase in the utilization of your host’s CPU . It is easy to calculate the bandwidth of the link, considering that the coding scheme 8b / 10b is used for FC 1/2/4/8 G we lose overhead 20%. For FC 16G, a more economical 64b / 66b coding scheme is used. Below is an example of calculating the maximum throughput for the FC 4G link.
4Gbit = 500 MByte; 500 MByte * 8/10 = 400 Mbyte is the theoretical maximum throughput of such a channel.
It is recommended to install a set of utilities for collecting statistics by displaying it in the form of graphs on Oncommand Core host not performing load testing. Available for download from support.netapp.com under Downloads Software (Requires NetApp NOW ID account). The login and password for logging into the NetApp Managment Console corresponds to the login and password of the host.
Requires a free license from NetApp storage users. Performs monitoring of FAS systems. During installation, choose " Standart Edition ", not " Express ", to enable the function of collecting statistics and displaying graphs.


Windows 2008 R2 x64
issued 6 processors and 16GB of RAM
Guest OS for RDM given both LUN
Windows has the NetApp Host Utilities 6.0.2 utility package installed.
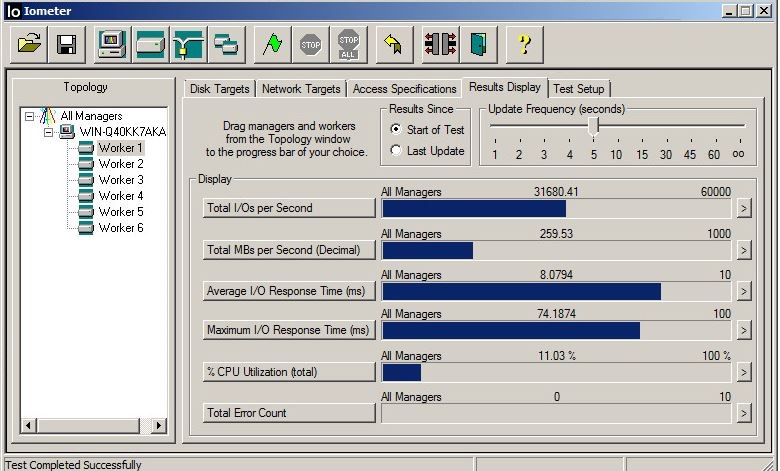
In some cases, VMFS shows better performance than RDM . So, in the test with the load index described in the text, IOmeter showed almost 300 MByte / sec using VMFS (see the figure at the very top of the text) and about 200 MByte / sec with RDM .
All the patterns of the database server, Web server, VDI and virtualization server are for IOMeter in the spoiler below. Start notepad and save the contents of the spoiler, to a file with the icf extension.
Workers (load generating processes) can run on the same machine as the IOMeter graphical interface, and on other machines (including heterogeneous, for example Linux and Solaris) managed from a single interface like a bot-net.
At the end of the load, IOMeter will report as a CSV file. But practice has shown that this report is not worth believing too much. IOMeter is good for generating load but not for collecting load statistics.
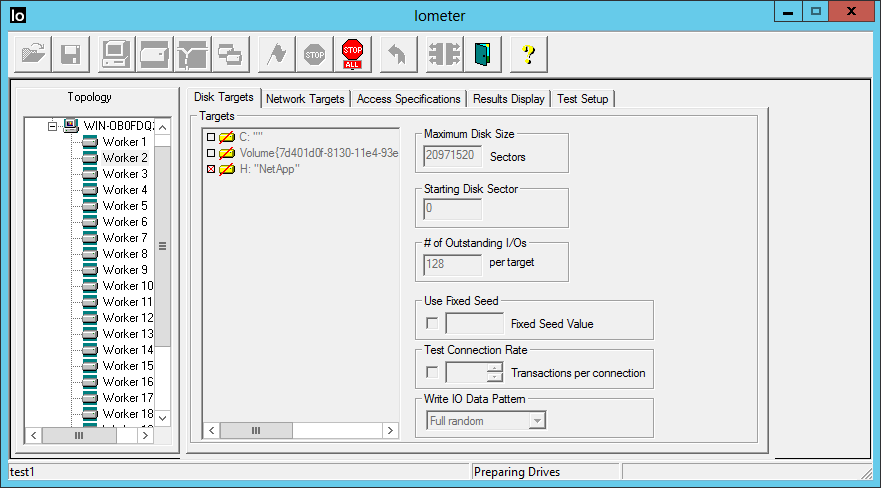
IOMeter is launched, two workers are created, one LUN is given to each.
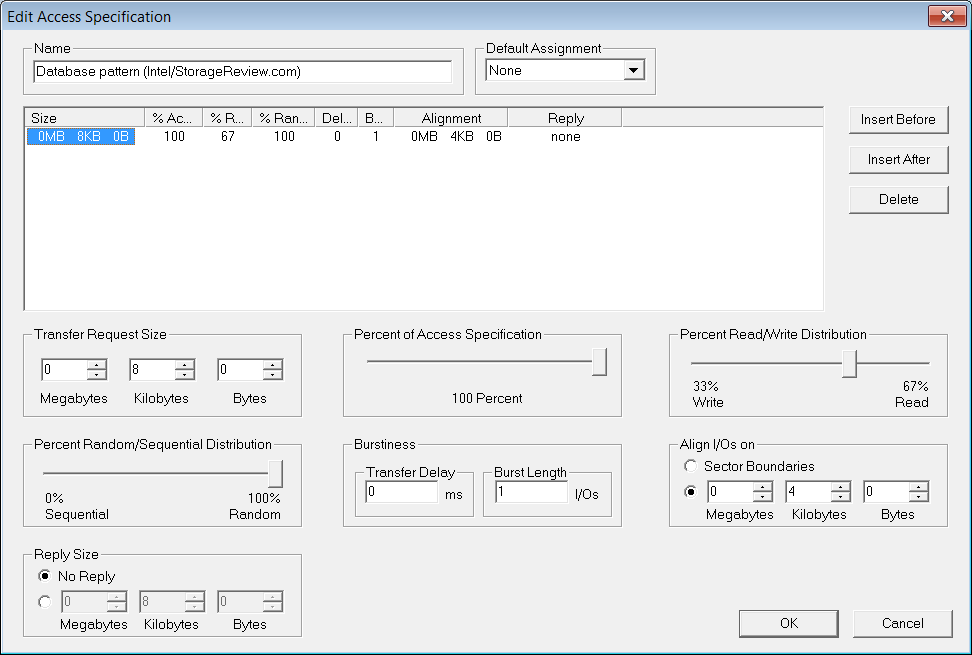
Align I / O on should always be 4K, as the most suitable in the case of modern operating systems and storage systems.
Maximum 256 for Outstanding I / O , the number 128 for a parameter means a high load similar to a high-loaded database . We create two workers and give one one LUN , the second second.
Set the maximum size of the test file “Maximum Disk Size” (0 means all free space on the disk), the value is set in sectors, for example 204800 sectors (where one sector is 512 Byte, so 204800 sectors will give 100MByte). And we set the load pattern in the “Write IO Data Patern” field.
I had to upgrade from DataOntap 8.1.4 7-Mode to 8.2, update the HBA FirmWare on the host. You also need to set the timeout for the hard disk ( RDM LUN 'a) in the ESXi environment.
I only got 7 variants based on the demo stand described above. The first of them approached me. I open and compare that everything converges. Make extensive use of the compatibility matrix in your practice to reduce potential problems in the data center infrastructure.
Do not ignore this item. The toolkit sets the correct delays, queue size for HBAs, and other settings on the host. Displays the connected LUNs and their detailed information from the storage side. The set of utilities is free and can be downloaded from the Netta technical support website. After installation, run the utility.
She is to be
for solaris
/ opt / NTAP / SANToolkit / bin /
for linux
/ opt / netapp / santools /
for Windows, settings will be added automatically during installation.
After that, most likely, you will need to restart the host.
For Windows 2008, you need to select the “Windows 2008” disk geometry when creating a LUN .
When initializing a disk with the MBR table, it can be used as a block device without formatting or creating a file system or file system during the test with IOMeter.
For Windows 2003 with GPT , when creating a LUN, you need to select the “Windows GPT ” disk geometry by creating a file system on it and generating a load by creating a test file (creating the file can take a long time), in such a test the file system layer will be added.
So far, not supported by IOmetr as a block device on the newest version 1.1.0 .
IOMeter does not know how to work with block devices initialized as GPT . Therefore, we have two ways:
in Solaris, as a rule, there is a utility that collects detailed statistics on the state of the host
The graph with statistics about the load ESXi host, usually coincides with MS perfmon. Since it does not require separate installation and configuration is very convenient for the initial assessment of the generated load. From the command line, a handy feature is available for collecting statistics on the size of blocks that the host operates on using the command:
And the load on the disk subsystem for I / O and latency can be collected using the command:
You can download the ESXplot utility to analyze the resulting log on the VMware website, which can convert output into several formats, including the built-in Windows perfmon utility, which is very convenient.

If you do not have a NetApp NOW ID, then you can start it; you do not need storage for this. Also, to obtain the utilities listed in this post, you can contact your NetApp Distributor, who will download and transfer the most recent versions of them.
sio
fio
Oracle Orion
MS SQLIO Disk Subsystem Benchmark Tool
Iozone
ATTO Disk Benchmark
Microsoft Diskspd
oracle vdbench
Comments on errors in the text and suggestions please send to the LAN .
The purpose of this article is to assist system administrators and system integrators in understanding the settings and nuances when testing NetApp storage systems. I also want to note that this article did not have the task of obtaining the highest possible performance of NetApp FAS 2240 controllers, since at the time of testing the demo equipment there were not enough disks (144 maximum) for the storage system , and there was only one server available. Those. Maximum performance is considered here in the context of a specific configuration of the demo stand, in other words, with a larger number of disks, servers and network connections, it is possible to get even better results with the same 2240 controllers. Although all the graphs with performance results are taken from actual configurations of end customers using in tests 2240 controllers, in some tests four SSD 100GB MLC disks were used.
Below is a comprehensive description of load testing of storage systems : IOMeter simulator settings, NetApp FAS host and storage configuration methods, load statistics removal, and interpretation of the results. Using the example of an existing demo stand, the methods of setting up all its components, as well as other possible configuration options using NetApp FAS, will be considered.
')
Demo Equipment
NetApp FAS HA2240-2 with 4x FC 8 ports 24x600x10k SAS , ONTAP 7-Mode 8.2
SAN switch
Cisco UCS C210 intel Xeon EM64T 64-bit 2x6 cores 1,999 GHz 32 GB of RAM , VMWare ESXi 5.1
Windows 2008 R2 x64 RDM virtual machine connecting to the LUN .
Storage system
All disks are divided equally between the controllers: 12 to one and 12 to another. On each disk set, one aggr0 unit is created, on each unit there is one system partition vol0 and one partition vol1 occupying all the free space on the unit, one moon is created on each partition occupying all available free on it. As a rule, it is recommended to create the largest aggregate of the longest raid groups. When creating the moon, the geometry was chosen corresponding to the host to which the LUN will be presented.
SAN network
For monitoring and troubleshooting the SAN switch, it is convenient to use the free Brocade SANHealth utility. So a clogged fiber-optic connector can lead to performance problems. From real life: a multipassing driver with the included Round-Robin policy, due to a broken link, created huge queues on an HBA adapter, which resulted in large delays in the I / O system and high CPU utilization.
Also do not forget that the FC link itself, for example, 4G can physically miss no more than 400 MB / s. When generating more traffic, you will also notice an increase in the utilization of your host’s CPU . It is easy to calculate the bandwidth of the link, considering that the coding scheme 8b / 10b is used for FC 1/2/4/8 G we lose overhead 20%. For FC 16G, a more economical 64b / 66b coding scheme is used. Below is an example of calculating the maximum throughput for the FC 4G link.
4Gbit = 500 MByte; 500 MByte * 8/10 = 400 Mbyte is the theoretical maximum throughput of such a channel.
Oncommand Core + Perfomance Adviser
It is recommended to install a set of utilities for collecting statistics by displaying it in the form of graphs on Oncommand Core host not performing load testing. Available for download from support.netapp.com under Downloads Software (Requires NetApp NOW ID account). The login and password for logging into the NetApp Managment Console corresponds to the login and password of the host.
Requires a free license from NetApp storage users. Performs monitoring of FAS systems. During installation, choose " Standart Edition ", not " Express ", to enable the function of collecting statistics and displaying graphs.
Guest OS
Windows 2008 R2 x64
issued 6 processors and 16GB of RAM
Guest OS for RDM given both LUN
Windows has the NetApp Host Utilities 6.0.2 utility package installed.
In some cases, VMFS shows better performance than RDM . So, in the test with the load index described in the text, IOmeter showed almost 300 MByte / sec using VMFS (see the figure at the very top of the text) and about 200 MByte / sec with RDM .
Iometer
All the patterns of the database server, Web server, VDI and virtualization server are for IOMeter in the spoiler below. Start notepad and save the contents of the spoiler, to a file with the icf extension.
iometer_v110_4k_ALL.icf
Version 1.1.0
'TEST SETUP =============================================== =====================
'Test Description
'Run time
'hours minutes seconds
0 0 0
'Ramp Up Time (s)
0
'Default Disk Workers to Spawn
NUMBER_OF_CPUS
'Default Network Workers to Spawn
0
'Record Results
ALL
'Worker Cycling
'start step step type
1 1 LINEAR
'Disk Cycling
'start step step type
1 1 LINEAR
'Queue Depth Cycling
'start end step step type
1 32 2 EXPONENTIAL
'Test Type
NORMAL
'END test setup
'RESULTS DISPLAY =============================================== ================
'Record Last Update Results, Update Frequency, Update Type
DISABLED, 0, WHOLE_TEST
'Bar chart 1 statistic
Total I / Os per Second
'Bar chart 2 statistic
Total MBs per Second (Decimal)
'Bar chart 3 statistic
Average I / O Response Time (ms)
'Bar chart 4 statistic
Maximum I / O Response Time (ms)
'Bar chart 5 statistic
% CPU utilization (total)
'Bar chart 6 statistic
Total Error Count
'END results display
'ACCESS SPECIFICATIONS =============================================== ==========
'Access specification name, default assignment
Default, NONE
'size,% of size,% reads,% random, delay, burst, align, reply
4096,100,67,100,0,1,4096,0
'Access specification name, default assignment
4 KiB; 100% Read; 0% random, NONE
'size,% of size,% reads,% random, delay, burst, align, reply
4096,100,100,0,0,1,4096,0
'Access specification name, default assignment
4 KiB; 75% Read; 0% random, NONE
'size,% of size,% reads,% random, delay, burst, align, reply
4096,100,75,0,0,1,4096,0
'Access specification name, default assignment
4 KiB; 50% Read; 0% random, NONE
'size,% of size,% reads,% random, delay, burst, align, reply
4096,100,50,0,0,1,4096,0
'Access specification name, default assignment
4 KiB; 25% Read; 0% random, NONE
'size,% of size,% reads,% random, delay, burst, align, reply
4096,100,25,0,0,1,4096,0
'Access specification name, default assignment
4 KiB; 0% Read; 0% random, NONE
'size,% of size,% reads,% random, delay, burst, align, reply
4096,100,0,0,0,1,4096,0
'Access specification name, default assignment
4 KiB aligned; 100% Read; 100% random, NONE
'size,% of size,% reads,% random, delay, burst, align, reply
4096,100,100,100,0,1,4096,0
'Access specification name, default assignment
4 KiB aligned; 50% Read; 100% random, NONE
'size,% of size,% reads,% random, delay, burst, align, reply
4096,100,50,100,0,1,4096,0
'Access specification name, default assignment
4 KiB aligned; 0% Read; 100% random, NONE
'size,% of size,% reads,% random, delay, burst, align, reply
4096,100,0,100,0,1,4096,0
'Access specification name, default assignment
16 KiB; 100% Read; 0% random, NONE
'size,% of size,% reads,% random, delay, burst, align, reply
16384,100,100,0,0,1,4096,0
'Access specification name, default assignment
16 KiB; 75% Read; 0% random, NONE
'size,% of size,% reads,% random, delay, burst, align, reply
16384,100,75,0,0,1,4096,0
'Access specification name, default assignment
16 KiB; 50% Read; 0% random, NONE
'size,% of size,% reads,% random, delay, burst, align, reply
16384,100,50,0,0,1,4096,0
'Access specification name, default assignment
16 KiB; 25% Read; 0% random, NONE
'size,% of size,% reads,% random, delay, burst, align, reply
16384,100,25,0,0,1,4096,0
'Access specification name, default assignment
16 KiB; 0% Read; 0% random, NONE
'size,% of size,% reads,% random, delay, burst, align, reply
16384,100,0,0,0,1,4096,0
'Access specification name, default assignment
32 KiB; 100% Read; 0% random, NONE
'size,% of size,% reads,% random, delay, burst, align, reply
32768,100,100,0,0,1,4096,0
'Access specification name, default assignment
32 KiB; 75% Read; 0% random, NONE
'size,% of size,% reads,% random, delay, burst, align, reply
32768,100,75,0,0,1,4096,0
'Access specification name, default assignment
32 KiB; 50% Read; 0% random, NONE
'size,% of size,% reads,% random, delay, burst, align, reply
32768,100,50,0,0,1,4096,0
'Access specification name, default assignment
32 KiB; 25% Read; 0% random, NONE
'size,% of size,% reads,% random, delay, burst, align, reply
32768,100,25,0,0,1,4096,0
'Access specification name, default assignment
32 KiB; 0% Read; 0% random, NONE
'size,% of size,% reads,% random, delay, burst, align, reply
32768,100,0,0,0,1,4096,0
'Access specification name, default assignment
64 KiB; 100% Read; 0% random, NONE
'size,% of size,% reads,% random, delay, burst, align, reply
65536,100,100,0,0,1,4096,0
'Access specification name, default assignment
64 KiB; 50% Read; 0% random, NONE
'size,% of size,% reads,% random, delay, burst, align, reply
65536,100,50,0,0,1,4096,0
'Access specification name, default assignment
64 KiB; 0% Read; 0% random, NONE
'size,% of size,% reads,% random, delay, burst, align, reply
65536,100,0,0,0,1,4096,0
'Access specification name, default assignment
256 KiB; 100% Read; 0% random, NONE
'size,% of size,% reads,% random, delay, burst, align, reply
262,144,100,100,0,0,1,4096,0
'Access specification name, default assignment
256 KiB; 50% Read; 0% random, NONE
'size,% of size,% reads,% random, delay, burst, align, reply
262,144,100,50,0,0,1,1,4096,0
'Access specification name, default assignment
256 KiB; 0% Read; 0% random, NONE
'size,% of size,% reads,% random, delay, burst, align, reply
262,144,100,0,0,0,1,4096,0
'Access specification name, default assignment
All in one, NONE
'size,% of size,% reads,% random, delay, burst, align, reply
4096,5,100,0,0,1,4096,0
4096,5,75,0,0,1,4096,0
4096,5,50,0,0,1,4096,0
4096,5,25,0,0,1,4096,0
4096,5,0,0,0,1,4096,0
4096,5,100,100,0,1,4096,0
4096,5,50,100,0,1,4096,0
4096,5,0,100,0,1,4096,0
16384,4,100,0,0,1,4096,0
16384,4,75,0,0,1,4096,0
16384,4,50,0,0,1,4096,0
16384,4,25,0,0,1,4096,0
16384,4,0,0,0,1,4096,0,0
32768,4,100,0,0,1,4096,0
32768.4.75.0.0.1.4096.0
32768,4,50,0,0,1,4096,0
32768.4.25.0.0.1.4096.0
32768,4,0,0,0,1,4096,0
65536,4,100,0,0,1,4096,0
65536,4,50,0,0,1,4096,0
65536,3,0,0,0,1,4096,0
262,144.3,100,0,0,1,4096,0
262144,3,50,0,0,1,4,496,0,0
262,144.3.0.0.0.1.4096.0
'Access specification name, default assignment
Database pattern, NONE
'size,% of size,% reads,% random, delay, burst, align, reply
8192,100,67,100,0,1,4096,0
'Access specification name, default assignment
Fileserver pattern (Intel), NONE
'size,% of size,% reads,% random, delay, burst, align, reply
512,10,80,100,0,1,4096,0
1024,5,80,100,0,1,4096,0
2048,5,80,100,0,1,4096,0
4096,60,80,100,0,1,4096,0
8192,2,80,100,0,1,4096,0
16384,4,80,100,0,1,4096,0
32768.4.80.100.0.1.4096.0
65536,10,80,100,0,1,4096,0
'Access specification name, default assignment
Workstation pattern (StorageReview.com), NONE
'size,% of size,% reads,% random, delay, burst, align, reply
8192,100,80,80,0,1,8192,0
'Access specification name, default assignment
Webserver pattern (unknown), NONE
'size,% of size,% reads,% random, delay, burst, align, reply
512,22,100,100,0,1,4096,0
1024,15,100,100,0,1,4096,0
2048,8,100,100,0,1,4096,0
4096,23,100,100,0,1,4096,0
8192,15,100,100,0,1,4096,0
16384,2,100,100,0,1,4096,0
32768,6,100,100,0,1,4096,0
66560,7,100,100,0,1,4096,0
131072,1,100,100,0,1,4096,0
524288,1,100,100,0,1,4096,0
'Access specification name, default assignment
VDI, NONE
'size,% of size,% reads,% random, delay, burst, align, reply
4096,100,20,80,0,1,4096,0
'END access specifications
'MANAGER LIST =============================================== ===================
'Manager ID, manager name
1, MT-RAKITSKAYANB
'Manager network address
'End manager
'END manager list
Version 1.1.0
iometer_v20060727_4k_ALL.icf
Version 2006.07.27
'TEST SETUP =============================================== =====================
'Test Description
'Run time
'hours minutes seconds
0 0 0
'Ramp Up Time (s)
0
'Default Disk Workers to Spawn
NUMBER_OF_CPUS
'Default Network Workers to Spawn
0
'Record Results
ALL
'Worker Cycling
'start step step type
1 1 LINEAR
'Disk Cycling
'start step step type
1 1 LINEAR
'Queue Depth Cycling
'start end step step type
1 32 2 EXPONENTIAL
'Test Type
NORMAL
'END test setup
'RESULTS DISPLAY =============================================== ================
'Update Frequency, Update Type
5, WHOLE_TEST
'Bar chart 1 statistic
Total I / Os per Second
'Bar chart 2 statistic
Total MBs per Second
'Bar chart 3 statistic
Average I / O Response Time (ms)
'Bar chart 4 statistic
Maximum I / O Response Time (ms)
'Bar chart 5 statistic
% CPU utilization (total)
'Bar chart 6 statistic
Total Error Count
'END results display
'ACCESS SPECIFICATIONS =============================================== ==========
'Access specification name, default assignment
Default, NONE
'size,% of size,% reads,% random, delay, burst, align, reply
2048,100,67,100,0,1,4096,0
'Access specification name, default assignment
4K; 100% Read; 0% random, NONE
'size,% of size,% reads,% random, delay, burst, align, reply
4096,100,100,0,0,1,4096,0
'Access specification name, default assignment
4K; 75% Read; 0% random, NONE
'size,% of size,% reads,% random, delay, burst, align, reply
4096,100,75,0,0,1,4096,0
'Access specification name, default assignment
4K; 50% Read; 0% random, NONE
'size,% of size,% reads,% random, delay, burst, align, reply
4096,100,50,0,0,1,4096,0
'Access specification name, default assignment
4K; 25% Read; 0% random, NONE
'size,% of size,% reads,% random, delay, burst, align, reply
4096,100,25,0,0,1,4096,0
'Access specification name, default assignment
4K; 0% Read; 0% random, NONE
'size,% of size,% reads,% random, delay, burst, align, reply
4096,100,0,0,0,1,4096,0
'Access specification name, default assignment
16K; 100% Read; 0% random, NONE
'size,% of size,% reads,% random, delay, burst, align, reply
16384,100,100,0,0,1,4096,0
'Access specification name, default assignment
16K; 75% Read; 0% random, NONE
'size,% of size,% reads,% random, delay, burst, align, reply
16384,100,75,0,0,1,4096,0
'Access specification name, default assignment
16K; 50% Read; 0% random, NONE
'size,% of size,% reads,% random, delay, burst, align, reply
16384,100,50,0,0,1,4096,0
'Access specification name, default assignment
16K; 25% Read; 0% random, NONE
'size,% of size,% reads,% random, delay, burst, align, reply
16384,100,25,0,0,1,4096,0
'Access specification name, default assignment
16K; 0% Read; 0% random, NONE
'size,% of size,% reads,% random, delay, burst, align, reply
16384,100,0,0,0,1,4096,0
'Access specification name, default assignment
32K; 100% Read; 0% random, NONE
'size,% of size,% reads,% random, delay, burst, align, reply
32768,100,100,0,0,1,4096,0
'Access specification name, default assignment
32K; 75% Read; 0% random, NONE
'size,% of size,% reads,% random, delay, burst, align, reply
32768,100,75,0,0,1,4096,0
'Access specification name, default assignment
32K; 50% Read; 0% random, NONE
'size,% of size,% reads,% random, delay, burst, align, reply
32768,100,50,0,0,1,4096,0
'Access specification name, default assignment
32K; 25% Read; 0% random, NONE
'size,% of size,% reads,% random, delay, burst, align, reply
32768,100,25,0,0,1,4096,0
'Access specification name, default assignment
32K; 0% Read; 0% random, NONE
'size,% of size,% reads,% random, delay, burst, align, reply
32768,100,0,0,0,1,4096,0
'Access specification name, default assignment
64K; 100% Read; 0% random, NONE
'size,% of size,% reads,% random, delay, burst, align, reply
65536,100,100,0,0,1,4096,0
'Access specification name, default assignment
64K; 75% Read; 0% random, NONE
'size,% of size,% reads,% random, delay, burst, align, reply
65536,100,75,0,0,1,4096,0
'Access specification name, default assignment
64K; 50% Read; 0% random, NONE
'size,% of size,% reads,% random, delay, burst, align, reply
65536,100,50,0,0,1,4096,0
'Access specification name, default assignment
64K; 25% Read; 0% random, NONE
'size,% of size,% reads,% random, delay, burst, align, reply
65536,100,25,0,0,1,4096,0
'Access specification name, default assignment
64K; 0% Read; 0% random, NONE
'size,% of size,% reads,% random, delay, burst, align, reply
65536,100,0,0,0,1,4096,0
'Access specification name, default assignment
All in one, NONE
'size,% of size,% reads,% random, delay, burst, align, reply
4096,5,100,0,0,1,4096,0
4096,5,75,0,0,1,4096,0
4096,5,50,0,0,1,4096,0
4096,5,25,0,0,1,4096,0
4096,5,0,0,0,1,4096,0
16384,5,100,0,0,1,4096,0
16384,5,75,0,0,1,4096,0
16384,5,50,0,0,1,4096,0
16384,5,25,0,0,1,4096,0
16384.5,0,0,0,1,4096,0
32768,5,100,0,0,1,4096,0
32768,5,75,0,0,1,4096,0
32768,5,50,0,0,1,4096,0
32768,5,25,0,0,1,4096,0
32768,5,0,0,0,1,4096,0
65536,5,100,0,0,1,4096,0
65536,5,75,0,0,1,4096,0
65536,5,50,0,0,1,4096,0
65536,5,25,0,0,1,4096,0
65536,5,0,0,0,1,4096,0
'Access specification name, default assignment
Database pattern (Intel / StorageReview.com), NONE
'size,% of size,% reads,% random, delay, burst, align, reply
8192,100,67,100,0,1,4096,0
'Access specification name, default assignment
Fileserver pattern (Intel), NONE
'size,% of size,% reads,% random, delay, burst, align, reply
512,10,80,100,0,1,4096,0
1024,5,80,100,0,1,4096,0
2048,5,80,100,0,1,4096,0
4096,60,80,100,0,1,4096,0
8192,2,80,100,0,1,4096,0
16384,4,80,100,0,1,4096,0
32768.4.80.100.0.1.4096.0
65536,10,80,100,0,1,4096,0
'Access specification name, default assignment
Workstation pattern (StorageReview.com), NONE
'size,% of size,% reads,% random, delay, burst, align, reply
8192,100,80,80,0,1,4096,0
'Access specification name, default assignment
Webserver pattern (unknown), NONE
'size,% of size,% reads,% random, delay, burst, align, reply
512,22,100,100,0,1,4096,0
1024,15,100,100,0,1,4096,0
2048,8,100,100,0,1,4096,0
4096,23,100,100,0,1,4096,0
8192,15,100,100,0,1,4096,0
16384,2,100,100,0,1,4096,0
32768,6,100,100,0,1,4096,0
66560,7,100,100,0,1,4096,0
131072,1,100,100,0,1,4096,0
524288,1,100,100,0,1,4096,0
'Access specification name, default assignment
VDI, NONE
'size,% of size,% reads,% random, delay, burst, align, reply
4096,100,20,80,0,1,4096,0
'END access specifications
Version 2006.07.27
Workers (load generating processes) can run on the same machine as the IOMeter graphical interface, and on other machines (including heterogeneous, for example Linux and Solaris) managed from a single interface like a bot-net.
At the end of the load, IOMeter will report as a CSV file. But practice has shown that this report is not worth believing too much. IOMeter is good for generating load but not for collecting load statistics.
IOMeter is launched, two workers are created, one LUN is given to each.
- block 8K
- 67% read / 33% write
- 100% random
- Align I / O on should always be 4K
- Outstanding I / O 128
Align I / O on should always be 4K, as the most suitable in the case of modern operating systems and storage systems.
Maximum 256 for Outstanding I / O , the number 128 for a parameter means a high load similar to a high-loaded database . We create two workers and give one one LUN , the second second.
Set the maximum size of the test file “Maximum Disk Size” (0 means all free space on the disk), the value is set in sectors, for example 204800 sectors (where one sector is 512 Byte, so 204800 sectors will give 100MByte). And we set the load pattern in the “Write IO Data Patern” field.
Compatibility Matrix
I had to upgrade from DataOntap 8.1.4 7-Mode to 8.2, update the HBA FirmWare on the host. You also need to set the timeout for the hard disk ( RDM LUN 'a) in the ESXi environment.
I only got 7 variants based on the demo stand described above. The first of them approached me. I open and compare that everything converges. Make extensive use of the compatibility matrix in your practice to reduce potential problems in the data center infrastructure.
NetApp Host Utilities
Do not ignore this item. The toolkit sets the correct delays, queue size for HBAs, and other settings on the host. Displays the connected LUNs and their detailed information from the storage side. The set of utilities is free and can be downloaded from the Netta technical support website. After installation, run the utility.
host_config <-setup> <-protocol fcp|iscsi|mixed> <-multipath mpxio|dmp|non> [-noalua] She is to be
for solaris
/ opt / NTAP / SANToolkit / bin /
for linux
/ opt / netapp / santools /
for Windows, settings will be added automatically during installation.
After that, most likely, you will need to restart the host.
MBR
For Windows 2008, you need to select the “Windows 2008” disk geometry when creating a LUN .
When initializing a disk with the MBR table, it can be used as a block device without formatting or creating a file system or file system during the test with IOMeter.
GPT
For Windows 2003 with GPT , when creating a LUN, you need to select the “Windows GPT ” disk geometry by creating a file system on it and generating a load by creating a test file (creating the file can take a long time), in such a test the file system layer will be added.
So far, not supported by IOmetr as a block device on the newest version 1.1.0 .
IOMeter does not know how to work with block devices initialized as GPT . Therefore, we have two ways:
- use block access with MBR , which can not be more than 2TB, when creating LUN on netap select "Windows 2008", on the host of such a moon initialize as MBR .
- format a GPT disk and use it with the file system. The test over the block device will not work with GPT
Collecting statistics on the host
Statistics for Unix-like :
in Solaris, as a rule, there is a utility that collects detailed statistics on the state of the host
/opt/SUNWexplo/bin/explorer ESXi performance
The graph with statistics about the load ESXi host, usually coincides with MS perfmon. Since it does not require separate installation and configuration is very convenient for the initial assessment of the generated load. From the command line, a handy feature is available for collecting statistics on the size of blocks that the host operates on using the command:
vscsiStats -s -w YYYYY -i XXXX Where YYYYY would be the groupID of the virtual machine, and XXXX its Virtual SCSI Disk handleID. More in this article .And the load on the disk subsystem for I / O and latency can be collected using the command:
esxtop -b -a -d %SEC% -n %COUNT% | gzip -9c > /root/esxtop.out.gz where % SEC% is the number of seconds between measurements, % COUNT% is the number of measurements.You can download the ESXplot utility to analyze the resulting log on the VMware website, which can convert output into several formats, including the built-in Windows perfmon utility, which is very convenient.
Also pay attention to the following optimization components
PS NOW ID
If you do not have a NetApp NOW ID, then you can start it; you do not need storage for this. Also, to obtain the utilities listed in this post, you can contact your NetApp Distributor, who will download and transfer the most recent versions of them.
Other load generators
sio
fio
Oracle Orion
MS SQLIO Disk Subsystem Benchmark Tool
Iozone
ATTO Disk Benchmark
Microsoft Diskspd
oracle vdbench
Comments on errors in the text and suggestions please send to the LAN .
Source: https://habr.com/ru/post/209422/
All Articles