Server optimization for Drupal with measurement results
By itself, instructions on where to tweak something on the server so that Drupal can work faster can be found on the Internet in varying degrees of detail. However, all the articles I have encountered had a slight flaw: I did not encounter any real measurements that accompanied the setting. How does the page generation speed change numerically? How does memory usage change? What happens when the number of parallel queries increases? Let's do an experiment. Some of the recommendations outlined in the article are general in nature and may be useful for other CMS.
The basis of this article is a selection of materials Server tuning considerations , posted on the official website of Drupal. From it, it selects what is most universal in nature and can be applied to an arbitrary server on which Drupal is planned to be used (in particular, sections dealing with the configuration of PHP and MySQL). This article does not cover the fine tuning of the CMS itself.
To test the load, a certain standard heavy site was created. Drupal 7 and several popular modules were used for this, including Views and Pathauto. A numeric field was added to one of the types of material, which could take a value from 1 to 10. Using the content generation function of the Devel module, about 10 thousand pages of material of this type were created and from 0 to 15 comments to each post.
')
Next, the Views block was created and placed on the main page, selecting 100 random pages, where the field took the value 5 (that is, according to probability theory, 100 out of 1000 pages) along with comments to them. Global: Random filtering criterion was used to ensure that the page is guaranteed to be re-generated every time it is loaded. On a personal test server, the generation time of such a page was approximately 10 seconds. Also, during the preparation, a test online store based on Commerce Kickstarter was raised and about 5 thousand products were generated. However, it turned out that Global: Random is not at all friendly with the Search API, and without randomization, the page with 96 products loaded significantly faster than the previous test page. Therefore, measurements on the speed of the online store were not conducted. Test sites have been moved to ...
For the experiments, I borrowed the newly installed Intel Xeon E3-1230 3.2GHz / 2-3 GB RAM / 30 GB SSD and Intel Xeon E3-1230 / 8GB DDR3 / 4x1TB SATA2 / 100Mbps Unmetered VPS for several days in the Netherlands (VPS and E3-1230 respectively). The servers have been configured LAMP + Nginx. The main part of the measurements was performed by the ab utility with a total of 1000 queries and the number of parallel queries from 10 to 50. At the end, several Loadimpact tests were also launched.
The first measurement was made before the start of any optimization. Actually, in these measurements I stopped at 40 parallel queries. The results look like this:

On this and subsequent graphs on the X axis there will be a share of requests that were served in a time not exceeding the corresponding value on the Y axis.
In addition, for the sake of interest, I launched the free Loadimpact test, but it did not create any significant load.
The first thing to do on the server under Drupal is to set the memory_limit value at least 256M in php.ini. As a rule, this is quite enough for most sites. But sometimes 128M is not enough. However, this cannot be called optimization, it is rather a vital necessity.
To speed up websites at the PHP level, developers recommend using various caching optimizers. In other sources, APC is most often mentioned, because I turned to him. How to put it, you can read in the instructions . Now we are interested in key settings. Actually, the main parameter is the size of the cache memory segment, apc.shm_size. The heavier the page, the more different files are connected during execution, the greater must be the value. For example, 64M was enough for a test site. And the test store at this value gave an error:
Raising the value to 256M in an instant removed this problem. According to the Devel module, for one-time site views, the inclusion of caching affected the following parameters:
How the inclusion of APC influenced the results of the bombing with ab will be discussed a little later. According to publicly available public information, using php-fpm instead of Apache + mod_php gives remarkable results. However, I have not tried to compare these two configurations yet.
One of the easiest ways to optimize MySQL is to replace my.cnf with my-huge.cnf. This file is designed for systems with sufficient (2 GB and above) amount of RAM and large-scale use of MySQL. In addition, it differs from the standard config file by a significantly larger buffer size (key_buffer_size) and the inclusion of query caching (query_cache_size).
The overall change in recoil rate for sequential use looks like this.
E3-1230, 10 parallel requests
VPS, 10 parallel requests
E3-1230, 30 parallel requests
VPS, 30 parallel requests
As you can see, the gap between non-optimized MySQL and optimized is more noticeable on VPS than on E3-1230. I dare to suggest that this is due to the use of SSD drives on a VPS. Nowadays, server configurations in which databases are placed on SSDs are becoming more and more popular. Considering how much they have fallen in price recently, such a decision doesn’t afford much and in many cases makes it possible to significantly speed up the operation of sites. A plus in favor of SSD, in my opinion, are the two following graphs.
E3-1230, 50 parallel requests
VPS, 50 parallel requests
As you can see, on a server with SATA disks, buffering with caching starts to choke very quickly. At the same time, on the VPS with SSD disks, the general trend continues. On the VPS, I tried to further increase the key_buffer_size and query_cache_size values, due to which I received a slight but stable performance increase (MySQL 2 curve). However, at this stage in both configurations, the processor is already beginning to choke.
The tests carried out with the help of the ab utility do not show the actual loading of the site pages, but rather a qualitative change in performance. For some data closer to life, I conducted a couple of tests with Loadimpact .
I considered the impact on the speed of the site only two essential parameters, because I will be grateful to everyone who can give additional useful tips on the subject. In addition, somewhere 5 days after the publication, the test environments will still be alive, and if you have any other optimization recommendations or testing proposals, I will try to bring them to life and add them to the article during this period. I urge everyone to share their own optimization experience and their tricks. And thank you for reading it patiently.
Instead of the preface
The basis of this article is a selection of materials Server tuning considerations , posted on the official website of Drupal. From it, it selects what is most universal in nature and can be applied to an arbitrary server on which Drupal is planned to be used (in particular, sections dealing with the configuration of PHP and MySQL). This article does not cover the fine tuning of the CMS itself.
Experimental model
To test the load, a certain standard heavy site was created. Drupal 7 and several popular modules were used for this, including Views and Pathauto. A numeric field was added to one of the types of material, which could take a value from 1 to 10. Using the content generation function of the Devel module, about 10 thousand pages of material of this type were created and from 0 to 15 comments to each post.
')
Next, the Views block was created and placed on the main page, selecting 100 random pages, where the field took the value 5 (that is, according to probability theory, 100 out of 1000 pages) along with comments to them. Global: Random filtering criterion was used to ensure that the page is guaranteed to be re-generated every time it is loaded. On a personal test server, the generation time of such a page was approximately 10 seconds. Also, during the preparation, a test online store based on Commerce Kickstarter was raised and about 5 thousand products were generated. However, it turned out that Global: Random is not at all friendly with the Search API, and without randomization, the page with 96 products loaded significantly faster than the previous test page. Therefore, measurements on the speed of the online store were not conducted. Test sites have been moved to ...
Experimental equipment
For the experiments, I borrowed the newly installed Intel Xeon E3-1230 3.2GHz / 2-3 GB RAM / 30 GB SSD and Intel Xeon E3-1230 / 8GB DDR3 / 4x1TB SATA2 / 100Mbps Unmetered VPS for several days in the Netherlands (VPS and E3-1230 respectively). The servers have been configured LAMP + Nginx. The main part of the measurements was performed by the ab utility with a total of 1000 queries and the number of parallel queries from 10 to 50. At the end, several Loadimpact tests were also launched.
Raw server data
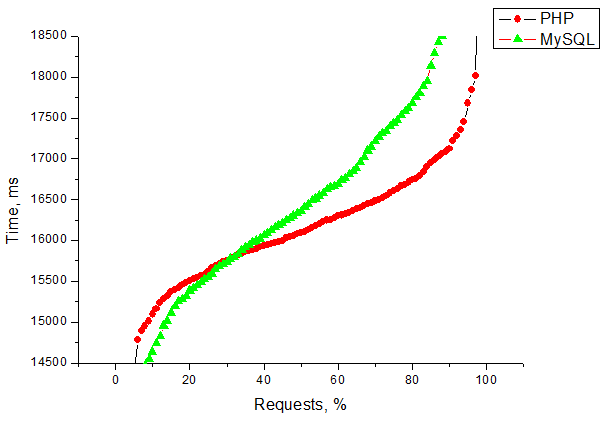
The first measurement was made before the start of any optimization. Actually, in these measurements I stopped at 40 parallel queries. The results look like this:
On this and subsequent graphs on the X axis there will be a share of requests that were served in a time not exceeding the corresponding value on the Y axis.
In addition, for the sake of interest, I launched the free Loadimpact test, but it did not create any significant load.
PHP optimization
The first thing to do on the server under Drupal is to set the memory_limit value at least 256M in php.ini. As a rule, this is quite enough for most sites. But sometimes 128M is not enough. However, this cannot be called optimization, it is rather a vital necessity.
To speed up websites at the PHP level, developers recommend using various caching optimizers. In other sources, APC is most often mentioned, because I turned to him. How to put it, you can read in the instructions . Now we are interested in key settings. Actually, the main parameter is the size of the cache memory segment, apc.shm_size. The heavier the page, the more different files are connected during execution, the greater must be the value. For example, 64M was enough for a test site. And the test store at this value gave an error:
[Mon Jan 13 21:41:46 2014] [error] [client 176.36.31.190] PHP Warning: Unknown: Unable to allocate memory for pool. in Unknown on line 0, referer: http://s2shop.1b1.info/products?page=2 Raising the value to 256M in an instant removed this problem. According to the Devel module, for one-time site views, the inclusion of caching affected the following parameters:
- page generation time was reduced by a half to two times;
- Peak memory consumption was reduced from approximately 50-55 MB to 30-32 MB for a test site and from approximately 65-70 MB to 30-32 MB for a test store.
How the inclusion of APC influenced the results of the bombing with ab will be discussed a little later. According to publicly available public information, using php-fpm instead of Apache + mod_php gives remarkable results. However, I have not tried to compare these two configurations yet.
MySQL optimization
One of the easiest ways to optimize MySQL is to replace my.cnf with my-huge.cnf. This file is designed for systems with sufficient (2 GB and above) amount of RAM and large-scale use of MySQL. In addition, it differs from the standard config file by a significantly larger buffer size (key_buffer_size) and the inclusion of query caching (query_cache_size).
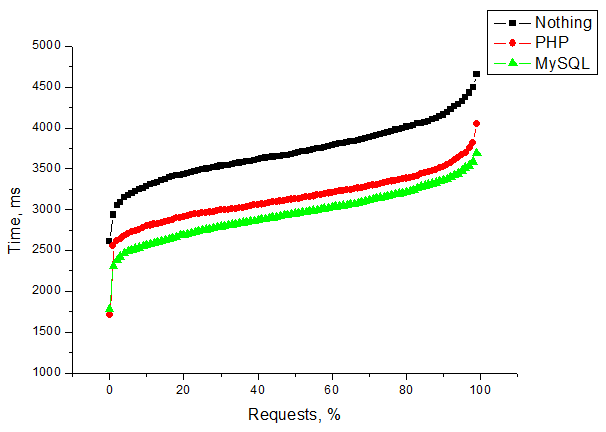
The overall change in recoil rate for sequential use looks like this.
E3-1230, 10 parallel requests
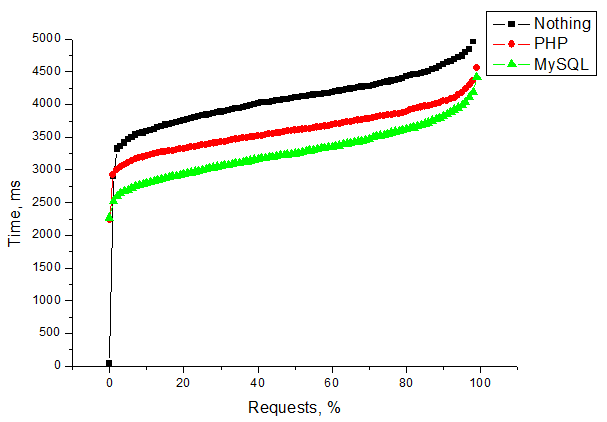
VPS, 10 parallel requests
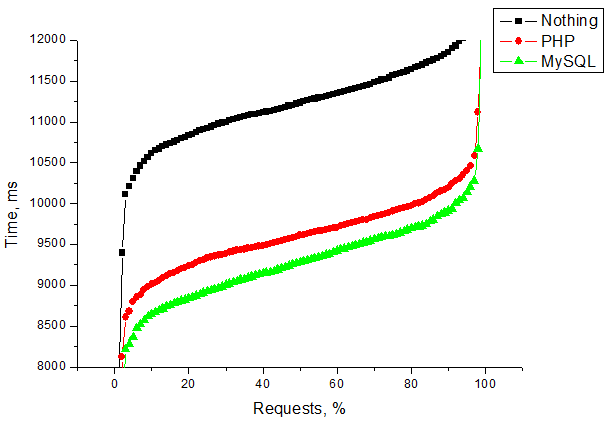
E3-1230, 30 parallel requests
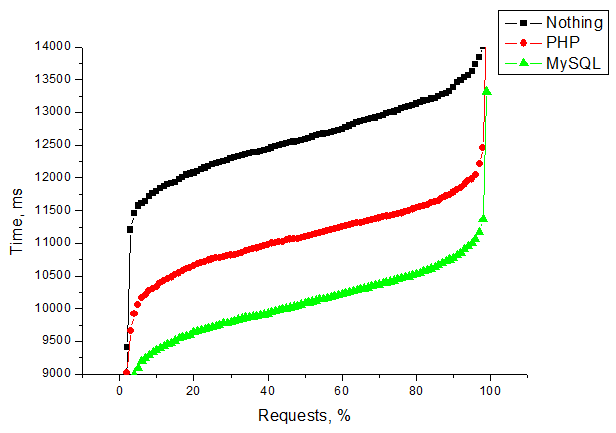
VPS, 30 parallel requests
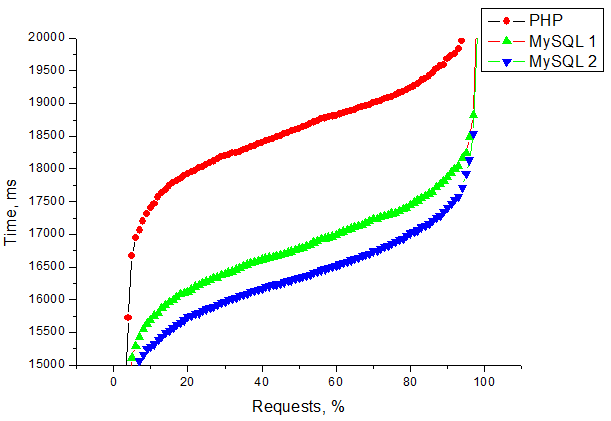
As you can see, the gap between non-optimized MySQL and optimized is more noticeable on VPS than on E3-1230. I dare to suggest that this is due to the use of SSD drives on a VPS. Nowadays, server configurations in which databases are placed on SSDs are becoming more and more popular. Considering how much they have fallen in price recently, such a decision doesn’t afford much and in many cases makes it possible to significantly speed up the operation of sites. A plus in favor of SSD, in my opinion, are the two following graphs.
E3-1230, 50 parallel requests
VPS, 50 parallel requests
As you can see, on a server with SATA disks, buffering with caching starts to choke very quickly. At the same time, on the VPS with SSD disks, the general trend continues. On the VPS, I tried to further increase the key_buffer_size and query_cache_size values, due to which I received a slight but stable performance increase (MySQL 2 curve). However, at this stage in both configurations, the processor is already beginning to choke.
LoadImpact Tests
The tests carried out with the help of the ab utility do not show the actual loading of the site pages, but rather a qualitative change in performance. For some data closer to life, I conducted a couple of tests with Loadimpact .
- The main page of the test site was set on up to 100 SBU, roughly evenly distributed in 5 different locations (2 in the USA, 2 in Europe, 1 in Australia). The summary graph does not allow you to see if the server has strained this load at least a little.
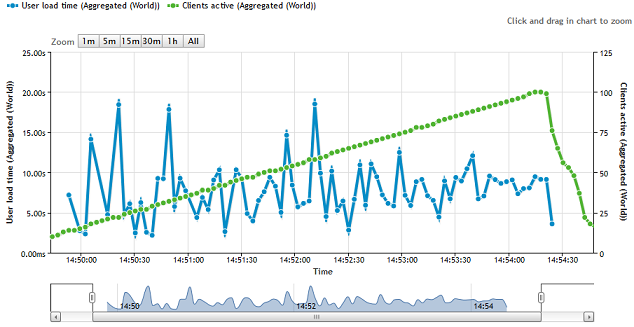
But the increase in load becomes more noticeable if you look at the graphs only on European points, with which connectivity is better.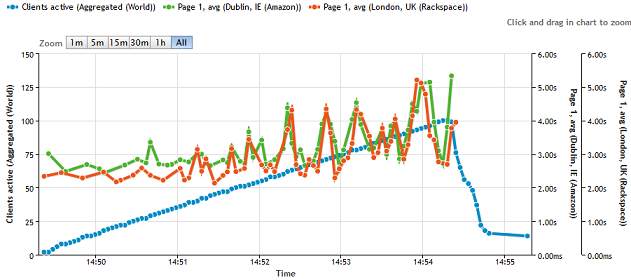
At the same time, the total data flow was close to 90 Mbps. I wanted to catch up with the channel to the shelf, but there were no credits left.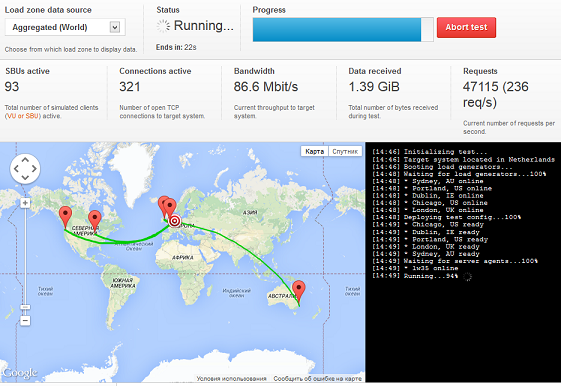
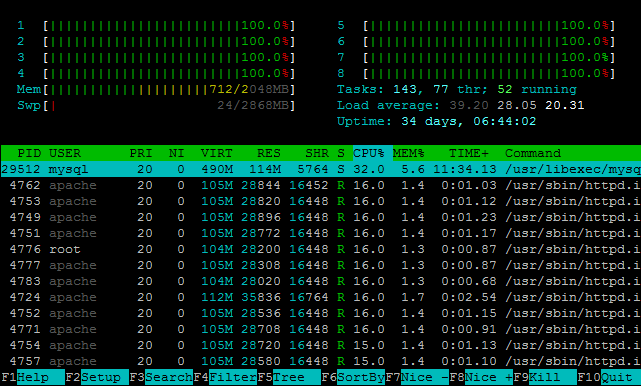
The load on the processor becomes noticeable, however, Load average cannot be compared with ab tests.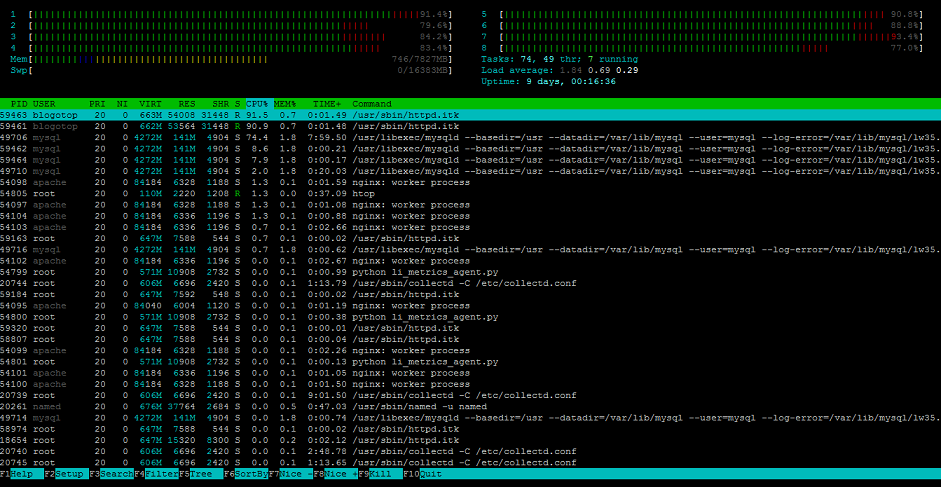
- In conclusion, I inclined the usual small information SDL and set Loadimpact from 8 different points on it. All test points accessed different pages of the site. In 10 minutes the number of SBU also reached 100.
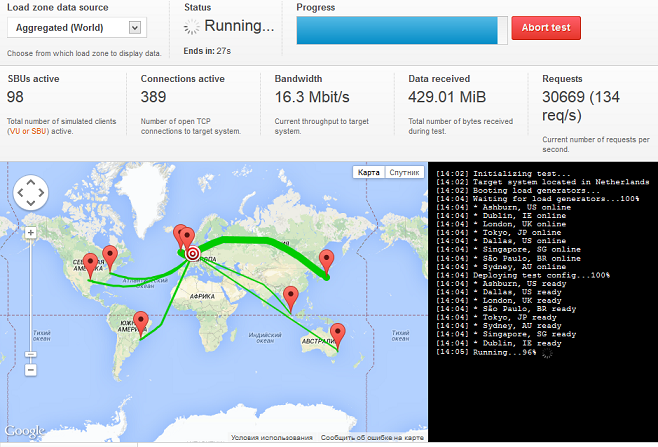
The payoff was very even, with no apparent slowdowns.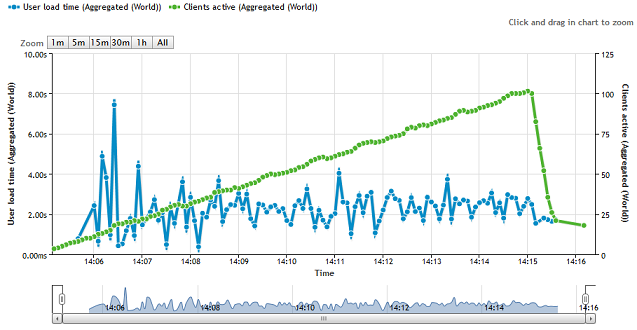
At the same time, the server of this test almost did not notice.
Instead of conclusion
I considered the impact on the speed of the site only two essential parameters, because I will be grateful to everyone who can give additional useful tips on the subject. In addition, somewhere 5 days after the publication, the test environments will still be alive, and if you have any other optimization recommendations or testing proposals, I will try to bring them to life and add them to the article during this period. I urge everyone to share their own optimization experience and their tricks. And thank you for reading it patiently.
Source: https://habr.com/ru/post/208986/
All Articles