How I earned $ 500K on machine learning and high frequency trading - Part 1
 From the translator: Recently, a topic was published on Habré about how an IT specialist to save and increase his money, which caused quite a lot of interest. I have recently been interested in financial topics, and I came across an interesting story of a guy who, using his technological skills, was able to earn half a million dollars in a year. It seems to me that his experience may be of interest to many habriters (even though he already had experience on the stock exchange), so I decided to translate this text (it is very lengthy, so there will be two parts).
This post describes in detail how I earned about half a million dollars in high-frequency trading from 2009 to 2010. Since I worked completely independently and no longer use my program, I can freely tell all about it. For the most part, I participated in trading in DAX and Russell 2000 futures contracts.
The key to my success, in my opinion, was not the use of complex financial equations, but rather the application of a general algorithmic approach that linked together many simple components and included the principle of machine learning to optimize the algorithm and achieve maximum profitability. While reading this article, you will not need to know any specific terminology - when I launched my program, I relied only on intuition. (Unfortunately, Andrew Ng’s wonderful machine learning course was not yet available to the public - by the way, if you click on the link, you will be taken to my current project: CourseTalk, website for mass open online courses / MOOC) .
First, I just want to demonstrate that my success was not just a happy coincidence. My program carried out 1000-4000 transactions per day (both “long” and “short”), but in a unit of time I have always had only a few contracts open. This means that my chances of sudden success were rather quickly averaged. This also means that I have never lost more than $ 2,000 per day and have never seen losses in the monthly period.
')

(Amendment: these are figures minus commissions)
And here is a graph showing variations in my earnings during the day. Note that there are no last 7 months on this chart, because — as soon as the amounts stopped growing — I lost the motivation to enter them.

My experience of trading on the exchange
Before I started working with my automated trading program, I worked as a trader for two years in a “normal” mode. It was in 2001 - in the years of the formation of electronic trading, when small speculators had the opportunity to earn good money. The way I worked at that time was in a certain sense akin to computer and gambling. To be successful meant to be fast, disciplined, and have a good ability to intuitively recognize patterns of market behavior. I earned about $ 250k, which allowed me to pay tuition and even save it. Profit!
Over the next five years, I tried to raise a couple of startups, while at the same time improving my programming skills. I could hardly go back to trading before 2008. However, playing at the stock exchange seemed to me a good opportunity to improve my financial situation at the moment when the money from the sale of the last startup began to come to an end - such an activity would give me the opportunity to think about the next steps.
API for trading
In 2008 I was an ordinary day trader in the futures market and used software called T4. I really wanted to get some custom shortcuts to give commands, so when I learned that T4 has an open API, I bother to learn C # (the programming language used by the API), and then I went ahead and created the necessary “ Hotkeys".
Having tried my hand with the API, I decided to increase my appetites: I wanted to teach the computer to trade for me. The API provides both streaming data from the market and an easy way to send commands to the exchange — and all I had to do was create the logic that would connect these two events.
Below is a screenshot of the T4 working window. Particularly good was that, having created my own program, I could observe computer trading from the same interface. Watching how real commands appear and disappear in the working window (appear by themselves, tied to my real money) was both frightening and exciting at the same time.
Designing your own algorithm
At first, my goal was to create a system about which I could be reasonably sure — it makes a profit — even before the real game starts on the exchange. In order to achieve such confidence, it was necessary for me to create a framework that simulates trading, which could, as accurately as possible, recreate market behavior.
[Usually, for this purpose, test access to the exchange is used; this possibility is also available on domestic platforms. Also, many traders use ready-made frameworks to develop trading robots (for Russian exchanges there are several such solutions , mostly paid) - approx. transl.]
Since real trading requires the processing of market updates, which are streamed through the API, the simulation mode required organizing the reading of market updates from a data file. To collect this data, I installed the first version of my program just to connect to the API and record market updates with time stamps. In order to test and train my system, it took me a total of 4 weeks to collect current information from the markets.
Even with a basic framework, I still had to figure out how to create a profitable trading system. As it turned out, my algorithm breaks down into two separate components, which I will consider separately:
- Prediction of price movements
- Organization of profitable trades
Prediction of price movements
Perhaps the obvious component of any trading system is the ability to predict how prices will change. And my system was no exception. I determined the current prices as the average value between the domestic price of demand and domestic supply and set the goal to predict how the price will change in the next 10 seconds. Thus, my algorithm would need to predict the price position from time to time throughout the day.
Creating and optimizing indicators
I created several indicators at once, with the help of which it was possible to confirm my ability to predict price movements in the short term. Each indicator gave some value that was either positive or negative. The benefit of such indicators was that, most often, a positive value corresponded to an increase, and a negative one to a fall in the market.
My system allowed me to quickly determine the quality of the predictions of each of the indicators, so I could experiment with a large number of them to find out which of them work most accurately. Many indicators are given by formulas containing variables — knowing these formulas, I could choose the optimal values of the variables, making pairwise comparisons of the results achieved using different values.
Indicators that turned out to be as useful as possible were relatively simple and were based on the latest data from the market on which I was trading, as well as information from other markets where similar securities were traded.
Accurate price predictions
However, to have indicators that simply predict price increases or decreases were not enough. I needed to know how accurately each value of each indicator predicts a specific price change. I needed a formula that could convert the indicator value to the exact price.
To achieve this, I distributed the predicted price spikes across 50 groups, differing in the range of indicator values. This allowed us to make a unique prediction for each group, based on the values of which I could build a graph in Excel. As you can see, the probability of a change in the predicted price increases with increasing indicator value.
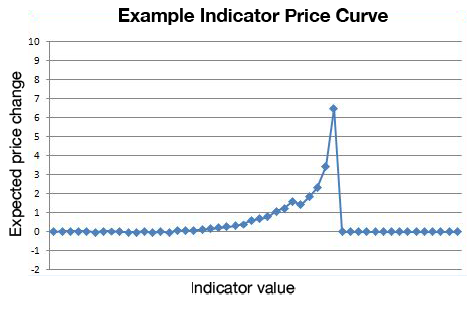
Based on this graph, I was able to create a formula that matched the resulting curve. At first, I did this “curve fitting” manually, but soon I wrote a small subroutine that automated this process.
By the way, not all indicator curves had similar graphs. In addition, the groups were distributed logarithmically, so that in each group there was approximately an equal number of initial values. It is also worth noting that the negative values of the indicators (and the corresponding predictions of lower prices) were taken in absolute value and arranged with positive values (my algorithm works with increasing and decreasing prices in exactly the same way).
Layout of indicators to obtain an unambiguous prediction of price behavior
It is important to pay attention to this point: all the indicators were not completely independent. I could not just dump all the predictions of the indicators and choose from them the final value. It was important to highlight the added predictive value, with which each indicator complements the already predicted value. It was not so difficult to do, but it meant that if I manually adjusted the values of several indicators to the curve at the same time, I had to be careful - changing one indicator could cause the others to change.
In order to adjust all indicators to a given curve at the same time, I set up the optimizer so that with each iteration the prediction curve changes in the direction set by only 30%. This 30% jump allowed the prediction curves to stabilize in a small number of iterations.
Due to the fact that now each indicator only added accuracy to the price prediction, I could use all the indicators at once to get an unambiguous prediction as to where the market would be in the next 10 seconds.
Why not just predict prices
It may seem to you that with such a market advantage I could get rich. But it is important to remember that the market consists of supply and demand - and not just market prices. Success in high-frequency trading comes to those who offer the best prices, and this is not easy.
Difficulties in creating a system that allows to make profitable transactions, the following can be identified:
- With each trading operation, I need to pay a commission to my broker and the exchange.
- The fact of the existence of a spread (the difference between the best purchase and sale price) means that if I just bought and sold at random, I would lose a lot of money.
- Most of the market is occupied by other bots, who will make a deal with me only if they consider it statistically beneficial.
- Finding an attractive offer does not mean making a deal. By the time the purchase order reaches the stock exchange, the offer is likely to become irrelevant.
- As a small player in the market, I cannot alone compete at the expense of speed.
To be continued...
Source: https://habr.com/ru/post/208500/
All Articles