Why behind the market share of 80% only half of smartphone users can hide
A guide to understanding all these quarterly numbers of Android, Apple and Windows. What they mean and what they don't mean.

Market share of smartphones
Read the first paragraph, and then check to see if you can find the flaw in the last sentence. (The text is taken from here , simply because it was at hand)
So what is wrong with this sentence? In the third quarter of 2013, Android really occupied 80% of the smartphone market. That's right - here are the abi research figures.
It would be a mistake to conclude from these figures that four out of five smartphones are in people's hands working on Android. And the reality is: at the time of this writing, more than 40% of the smartphones used in the US (the key market for Nike) are the iPhone. Only about 51% of smartphones in the hands of people in the US work on Android. The ratio is still in favor of the latter, but to meet an Android smartphone in four cases out of five is possible only in China (and probably in India).
Well, what then means market share?
This is a copy of how many devices were sold (or shipped) on the market for a certain period. Consider the following example: you were told that in the recent fiscal quarter (a three-month period), sales data show that in country Z the market shares for the Product are equal:
Does this mean that 80% of people in country Z use Product A?
Not! In fact, you cannot draw any conclusions about the number of users of Product A in country Z based on the figures of “market shares”.
But it says "market share"! Same number and so on!
Yes, it is written. But the market share is an indicator of the number of sales. Only in rare cases when the market is saturated - that is, anyone who wants the Product has it, and the market replaces old goods with new ones, then the market share is consistent with the “total number of devices” (installed base).
')
Total number of devices (installed base)? What is this?
This is an indicator of how many Products are already in use. That is, if 100 million people use Products, the total number of devices (installed base) will be 100 million.
Now suppose that there are different kinds of Product — A, B, and C — and they are distributed as follows.
Aaaa, now information about the market share - A takes 80%, B takes 15%, and C takes 5% - means that Product A captures the market? Its market share is higher!
Perhaps it is. But it is impossible to draw conclusions from this data. Firstly, you do not know how many Products were sold / shipped during this period.
What if only 10 units were sold? These sales will not have a significant impact on the total number of devices in the hundreds of millions of units.
Secondly, it is not known whether the market is expanding (or shrinking, which is generally a rarity for IT markets). If the market expands, then some units get to new users who did not hold the Product before.
Wait, what's the thing: sold / shipped?
Many technical operations, at least for the iron market, include middlemen. Handset makers produce handsets, sell them to retail chains, which resell them to end customers. The phone market in this case records the number of units shipped. But this does not mean that all the tubes will fall into the hands of customers. If something goes wrong, then the retail network can return the unsold phones to the manufacturer. Different manufacturers differently determine when the goods are shipped. But basically, this is the moment when they get money for it from someone who took the goods into ownership.
This, however, does not mean that the product will reach customers. For example, HTC First - an Android phone made by HTC with a built-in home screen from Facebook - was selling so badly that AT & T took them out of the sale . Unsold stocks left back to HTC. Shipped but not sold, and definitely not in the hands of users.
In general, this difference is not so important. Analysts call the shipment to intermediaries "initial sale" ("sell-in") [translation options: "wholesale", "sales to distributors"]; the total number of goods actually reaching customers is “retail” (“sell-through”) [translation options: “pass-through sale”, “successful sale of goods on the market”].
These rates are often close. But sometimes (for example, before launching a new product) “initial sales” may fall if the phone market is trying to sell the remnants of the old model, or take off, if sellers are trying to fill the warehouses with new products. BlackBerry delighted everyone with the large numbers of its Z10 flagship “initial sales” after its launch in January 2013. But retail sales were much more modest.
Okay. I realized that the total number of devices and the market share are not the same. Then what conclusions can be drawn from the market share?
In general, not very much. Take, for example, the following figures, given that we consider only country Z, where, as you remember, 20 million own Product A, 50 million - product B, 30 million - product B.
Let the market share for the last quarter be as follows: 80% - A, 15% - B, 5% - B. And for the reporting period 10 million units were sold. Then we can conclude (without taking into account all these "initial sales" / "retail sales") that 8 million A, 1.5 million B and 0.5 million V. were sold.
I understood! Now the users of Product A are 28 million, B - 51.5 million, C - 30.5 million. It's simple.
Not. You can't say that. You do not have enough data.
Why? We also have market shares and the total number of devices. We add the first to the second and get what we need.
But you do not know whether the market is expanding or retaining its size. And you do not know the replacement levels for A, B, and B. What if all customers in the last quarter replaced old products with new products? Then the total number of devices will remain unchanged, and the ratio of users will remain.
On the other hand, if the market is only expanding and there is no substitution of existing Products, then the picture will be as you expected: 28 / 51.5 / 30.5.
In fact, there will be something in between these two scenarios: some Products will fall into the hands of new customers, and some - to existing users. The larger the total number of devices, the more units are replaced. (For example, most people change their mobile phones every few years, and the total number of devices has little variation.)
The fact is that without additional data it is impossible to say how the total number of devices changes.
It is very difficult for analysts to simulate changes in the total number of devices for large volumes of products (like Apple and Android phones): you need to simulate how often people change their devices, how many devices there are at the moment, how fast the market is growing. Therefore, they hunt for any piece of information that will give an idea of the total number of devices.
There is a simple refutation of the idea that "80% of the market share for Android smartphones means that four out of five device owners are using Android." This information is available on the Android developer dashboard page .

Android dashboard for the seven days preceding November 1, 2013, shows Android versions on devices that connect to Google Play.
In the picture you see the statistics for the seven days preceding November 1, 2013, which shows which Android versions are installed on devices that connected to Google Play. Among them are "Froyo" (2.2) and "Honeycomb" (3.0). Now you can not buy a device with this version of Android. But at the same time they have a significant proportion in the chart. The latest version, “Jelly Bean” (which includes three different versions of Android), is 52.1% of devices. With that, Jelly Bean is installed on all new models of Android smartphones - the very 80% for the last quarter. This means that the total number of devices does not match the market share.
Okay. But I saw figures that last year Apple’s share of the tablet market was 50%, and now it’s 30%. So Apple began to sell fewer devices?
No, this data says something completely different. What if the total number of tablets sold doubled? If last year 100 million devices were sold, and this is 200 million, then the number of Apple tablets sold last year is 50 million, and this year 60 million. (The figures are not true. They are taken as an example.)
That is, if there are no absolute figures, then it is impossible to say exactly which particular trend in the market. Such a comparison of one year with another can help to make a general picture of the market landscape, but in rapidly changing markets it is not enough to give one figure. Such indicators are more confusing than help.
(Note that the above Google chart only contains shares, and nothing more. We don’t know if the number of devices connected to Google Play has increased since last month or last year)
Here is an example, from YouGov in 2013, which showed a decrease in Apple's market share .
Apple's share in the total number of devices has decreased, according to YouGov, from 73% to 63% (note that the values of the proportion of the total number of devices, and not the market share are given)

Shares of tablet owners in the UK according to YouGov, showing a fall in Apple's share from the first quarter of 2012 to the first quarter of 2013.
But if you add information about the number of units purchased, it turns out that Apple has increased the number of its devices and strengthened its leadership in the total volume of devices. This is counterintuitive. But such conclusions follow from simple calculations: the total number of iPads has grown from 2 million to 5.2 million; the total number of devices exceeded the total number of competitors' devices by 0.6 million, and this figure rose to 3.1 million.
This does not mean that the number of non-iPad devices will not exceed the iPad once. But this means that you need to be careful with absolute numbers when you use the word "share". Absolute numbers tend to be important.
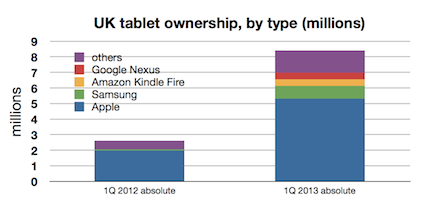
How the total number of tablets in the UK has actually changed from the first quarter of 2012 to the first quarter of 2013, according to YouGov.
But if the market share is so useless, why is it constantly quoted?
We got to the bottom. This is because the easiest way to measure the market share is much simpler than the total number of devices, for the study of which you need a large staff who will conduct regular surveys. (In the US, ComScore is engaged in this, which provides information on the total number of smartphone users since the end of 2009. According to this company, for three months of 2013, the share of Android in the total number of devices is 51.8%, or 76.6 million units. IPhone share - 40.6% or 60 million units. And 80% of the share of Android phones is not even close.)
Plus, the “market share” gives reason to journalists, fans of metaphorical racing, to write at least something - pay attention to the prevalence of various polls in the press, especially during the presidential campaign in the United States. The problem is that this information is often of very little sense.
The market share shows us who ship most of the product. If you combine these numbers with other business indicators — such as income and profit — you can shed light on companies that run their business more efficiently. It will also help you understand the direction in which the market is moving, if you have historical information.
Unfortunately, some people do not understand how little the market share tells us by itself. As a result, focusing only on these indicators leads to incorrect conclusions, as in the quote at the very beginning of the article.
Are there any other limitations when using market share to predict the total number of devices?
Market share is used to measure sales of new products. Some people buy a new TV and dump an old one in a landfill; others move the old television to another room. If the new TV has the prefix “smart” and the old one does not, then in the first case the total number of “smart” TVs in the apartment will be 100%; in the second case - 50%.
Nevertheless, it is difficult to measure the market for second-hand goods. Which further complicates the calculation of the total number of devices. (Second-hand products also affect product substitution rates). If there is a significant difference in the number of users of second-hand products of Product A, Product B and Product C, then the market share values even more diverge from the total number of devices.
Who actually needs this total number of devices?
This is a key indicator for application developers, accessory manufacturers, and users when choosing their next purchase (because repairs, support, and service will most likely work where the total number of devices is greater). The link at the beginning of the article just shows the dilemma of the total number of devices and developers. The lack of devices (despite the values of the "market share") is usually the reason for the lack of applications for the new platform: developers need a good reason to justify investing in the platform.
Wait, Windows works on 95% of personal computers - this is the total number of devices - and at the same time, the market share of Windows is 95%! You breed me!
You are right - in Windows operating system market share coincides with the total number of devices. This is because the personal computer market is already saturated: the number of PC users (or Macs manufactured by Apple) is unlikely to grow.
This means that if 10 personal computers are shipped, they will almost certainly replace the 10 obsolete ones. How much has come - so much gone. Truth be told, personal computer manufacturers are facing a problem - most of them are happy. Computers live longer, and therefore they need to change less.
Windows reached its dominance in the nineties, and no one can topple them from desktops to the present day. In the context of the 1.4 billion personal computers in the world, several million Apple computers sold quarterly cannot significantly affect the ratio of the total number of Windows: Mac.
Does this mean that the market share will equal the total number of devices over time?
Yes, over time. But do not forget about all the above comments about substitutions.
What about search queries? If Google’s market share is 90% in Europe, is there any trick here?
No, because search queries are not saved. You have completed the search - you get the result. For temporal things, “market share” corresponds to the proportion of users, and there is no concept of “total number of products” for search queries.
So what should I do when I see the news next time with the market share figures?
Look for auxiliary indicators: total market volume, and what is known about the total number of devices. And what the indicators say about what is happening in the scale of the entire market. For example, the enormous share of Samsung in the market of smartphones and mobile phones is reflected in the total number of devices, as well as the revenues and total weight of the company in the world. Sometimes numbers can be helpful. But never by themselves.
The term “installed base” is used in the original article. I did not find a well-established translation into Russian. The meaning of this market indicator is the total number of products at the hands of consumers. I did not like the translation option “installation base”. The article uses the translation "total number of devices" , although the English term refers not only to devices, but to any products in principle. I would be grateful for ideas for a more accurate translation.
And at the request of workers survey for the owner of smartphones running on Android and iOS:
Market share of smartphones
Read the first paragraph, and then check to see if you can find the flaw in the last sentence. (The text is taken from here , simply because it was at hand)
It has been 20 months since the first launch of the FuelBand with Nike. And although it is planned to launch the FuelBand application on Android in the near future, the bracelet for tracking activity remains compatible with iOS today.
Many are surprised by this apparent omission in the Nike arsenal, since Android occupies approximately 80% of the smartphone market.
So what is wrong with this sentence? In the third quarter of 2013, Android really occupied 80% of the smartphone market. That's right - here are the abi research figures.
It would be a mistake to conclude from these figures that four out of five smartphones are in people's hands working on Android. And the reality is: at the time of this writing, more than 40% of the smartphones used in the US (the key market for Nike) are the iPhone. Only about 51% of smartphones in the hands of people in the US work on Android. The ratio is still in favor of the latter, but to meet an Android smartphone in four cases out of five is possible only in China (and probably in India).
Well, what then means market share?
This is a copy of how many devices were sold (or shipped) on the market for a certain period. Consider the following example: you were told that in the recent fiscal quarter (a three-month period), sales data show that in country Z the market shares for the Product are equal:
- Product A: 80%
- Product B: 15%
- Product B: 5%
Does this mean that 80% of people in country Z use Product A?
Not! In fact, you cannot draw any conclusions about the number of users of Product A in country Z based on the figures of “market shares”.
But it says "market share"! Same number and so on!
Yes, it is written. But the market share is an indicator of the number of sales. Only in rare cases when the market is saturated - that is, anyone who wants the Product has it, and the market replaces old goods with new ones, then the market share is consistent with the “total number of devices” (installed base).
')
Total number of devices (installed base)? What is this?
This is an indicator of how many Products are already in use. That is, if 100 million people use Products, the total number of devices (installed base) will be 100 million.
Now suppose that there are different kinds of Product — A, B, and C — and they are distributed as follows.
- 20 million have Product A
- 50 million possess Product B
- 30 million have Product B
Aaaa, now information about the market share - A takes 80%, B takes 15%, and C takes 5% - means that Product A captures the market? Its market share is higher!
Perhaps it is. But it is impossible to draw conclusions from this data. Firstly, you do not know how many Products were sold / shipped during this period.
What if only 10 units were sold? These sales will not have a significant impact on the total number of devices in the hundreds of millions of units.
Secondly, it is not known whether the market is expanding (or shrinking, which is generally a rarity for IT markets). If the market expands, then some units get to new users who did not hold the Product before.
Wait, what's the thing: sold / shipped?
Many technical operations, at least for the iron market, include middlemen. Handset makers produce handsets, sell them to retail chains, which resell them to end customers. The phone market in this case records the number of units shipped. But this does not mean that all the tubes will fall into the hands of customers. If something goes wrong, then the retail network can return the unsold phones to the manufacturer. Different manufacturers differently determine when the goods are shipped. But basically, this is the moment when they get money for it from someone who took the goods into ownership.
This, however, does not mean that the product will reach customers. For example, HTC First - an Android phone made by HTC with a built-in home screen from Facebook - was selling so badly that AT & T took them out of the sale . Unsold stocks left back to HTC. Shipped but not sold, and definitely not in the hands of users.
In general, this difference is not so important. Analysts call the shipment to intermediaries "initial sale" ("sell-in") [translation options: "wholesale", "sales to distributors"]; the total number of goods actually reaching customers is “retail” (“sell-through”) [translation options: “pass-through sale”, “successful sale of goods on the market”].
These rates are often close. But sometimes (for example, before launching a new product) “initial sales” may fall if the phone market is trying to sell the remnants of the old model, or take off, if sellers are trying to fill the warehouses with new products. BlackBerry delighted everyone with the large numbers of its Z10 flagship “initial sales” after its launch in January 2013. But retail sales were much more modest.
Okay. I realized that the total number of devices and the market share are not the same. Then what conclusions can be drawn from the market share?
In general, not very much. Take, for example, the following figures, given that we consider only country Z, where, as you remember, 20 million own Product A, 50 million - product B, 30 million - product B.
Let the market share for the last quarter be as follows: 80% - A, 15% - B, 5% - B. And for the reporting period 10 million units were sold. Then we can conclude (without taking into account all these "initial sales" / "retail sales") that 8 million A, 1.5 million B and 0.5 million V. were sold.
I understood! Now the users of Product A are 28 million, B - 51.5 million, C - 30.5 million. It's simple.
Not. You can't say that. You do not have enough data.
Why? We also have market shares and the total number of devices. We add the first to the second and get what we need.
But you do not know whether the market is expanding or retaining its size. And you do not know the replacement levels for A, B, and B. What if all customers in the last quarter replaced old products with new products? Then the total number of devices will remain unchanged, and the ratio of users will remain.
On the other hand, if the market is only expanding and there is no substitution of existing Products, then the picture will be as you expected: 28 / 51.5 / 30.5.
In fact, there will be something in between these two scenarios: some Products will fall into the hands of new customers, and some - to existing users. The larger the total number of devices, the more units are replaced. (For example, most people change their mobile phones every few years, and the total number of devices has little variation.)
The fact is that without additional data it is impossible to say how the total number of devices changes.
It is very difficult for analysts to simulate changes in the total number of devices for large volumes of products (like Apple and Android phones): you need to simulate how often people change their devices, how many devices there are at the moment, how fast the market is growing. Therefore, they hunt for any piece of information that will give an idea of the total number of devices.
There is a simple refutation of the idea that "80% of the market share for Android smartphones means that four out of five device owners are using Android." This information is available on the Android developer dashboard page .
Android dashboard for the seven days preceding November 1, 2013, shows Android versions on devices that connect to Google Play.
In the picture you see the statistics for the seven days preceding November 1, 2013, which shows which Android versions are installed on devices that connected to Google Play. Among them are "Froyo" (2.2) and "Honeycomb" (3.0). Now you can not buy a device with this version of Android. But at the same time they have a significant proportion in the chart. The latest version, “Jelly Bean” (which includes three different versions of Android), is 52.1% of devices. With that, Jelly Bean is installed on all new models of Android smartphones - the very 80% for the last quarter. This means that the total number of devices does not match the market share.
Okay. But I saw figures that last year Apple’s share of the tablet market was 50%, and now it’s 30%. So Apple began to sell fewer devices?
No, this data says something completely different. What if the total number of tablets sold doubled? If last year 100 million devices were sold, and this is 200 million, then the number of Apple tablets sold last year is 50 million, and this year 60 million. (The figures are not true. They are taken as an example.)
That is, if there are no absolute figures, then it is impossible to say exactly which particular trend in the market. Such a comparison of one year with another can help to make a general picture of the market landscape, but in rapidly changing markets it is not enough to give one figure. Such indicators are more confusing than help.
(Note that the above Google chart only contains shares, and nothing more. We don’t know if the number of devices connected to Google Play has increased since last month or last year)
Here is an example, from YouGov in 2013, which showed a decrease in Apple's market share .
Apple's share in the total number of devices has decreased, according to YouGov, from 73% to 63% (note that the values of the proportion of the total number of devices, and not the market share are given)
Shares of tablet owners in the UK according to YouGov, showing a fall in Apple's share from the first quarter of 2012 to the first quarter of 2013.
But if you add information about the number of units purchased, it turns out that Apple has increased the number of its devices and strengthened its leadership in the total volume of devices. This is counterintuitive. But such conclusions follow from simple calculations: the total number of iPads has grown from 2 million to 5.2 million; the total number of devices exceeded the total number of competitors' devices by 0.6 million, and this figure rose to 3.1 million.
This does not mean that the number of non-iPad devices will not exceed the iPad once. But this means that you need to be careful with absolute numbers when you use the word "share". Absolute numbers tend to be important.
How the total number of tablets in the UK has actually changed from the first quarter of 2012 to the first quarter of 2013, according to YouGov.
But if the market share is so useless, why is it constantly quoted?
We got to the bottom. This is because the easiest way to measure the market share is much simpler than the total number of devices, for the study of which you need a large staff who will conduct regular surveys. (In the US, ComScore is engaged in this, which provides information on the total number of smartphone users since the end of 2009. According to this company, for three months of 2013, the share of Android in the total number of devices is 51.8%, or 76.6 million units. IPhone share - 40.6% or 60 million units. And 80% of the share of Android phones is not even close.)
Plus, the “market share” gives reason to journalists, fans of metaphorical racing, to write at least something - pay attention to the prevalence of various polls in the press, especially during the presidential campaign in the United States. The problem is that this information is often of very little sense.
The market share shows us who ship most of the product. If you combine these numbers with other business indicators — such as income and profit — you can shed light on companies that run their business more efficiently. It will also help you understand the direction in which the market is moving, if you have historical information.
Unfortunately, some people do not understand how little the market share tells us by itself. As a result, focusing only on these indicators leads to incorrect conclusions, as in the quote at the very beginning of the article.
Are there any other limitations when using market share to predict the total number of devices?
Market share is used to measure sales of new products. Some people buy a new TV and dump an old one in a landfill; others move the old television to another room. If the new TV has the prefix “smart” and the old one does not, then in the first case the total number of “smart” TVs in the apartment will be 100%; in the second case - 50%.
Nevertheless, it is difficult to measure the market for second-hand goods. Which further complicates the calculation of the total number of devices. (Second-hand products also affect product substitution rates). If there is a significant difference in the number of users of second-hand products of Product A, Product B and Product C, then the market share values even more diverge from the total number of devices.
Who actually needs this total number of devices?
This is a key indicator for application developers, accessory manufacturers, and users when choosing their next purchase (because repairs, support, and service will most likely work where the total number of devices is greater). The link at the beginning of the article just shows the dilemma of the total number of devices and developers. The lack of devices (despite the values of the "market share") is usually the reason for the lack of applications for the new platform: developers need a good reason to justify investing in the platform.
Wait, Windows works on 95% of personal computers - this is the total number of devices - and at the same time, the market share of Windows is 95%! You breed me!
You are right - in Windows operating system market share coincides with the total number of devices. This is because the personal computer market is already saturated: the number of PC users (or Macs manufactured by Apple) is unlikely to grow.
This means that if 10 personal computers are shipped, they will almost certainly replace the 10 obsolete ones. How much has come - so much gone. Truth be told, personal computer manufacturers are facing a problem - most of them are happy. Computers live longer, and therefore they need to change less.
Windows reached its dominance in the nineties, and no one can topple them from desktops to the present day. In the context of the 1.4 billion personal computers in the world, several million Apple computers sold quarterly cannot significantly affect the ratio of the total number of Windows: Mac.
Does this mean that the market share will equal the total number of devices over time?
Yes, over time. But do not forget about all the above comments about substitutions.
What about search queries? If Google’s market share is 90% in Europe, is there any trick here?
No, because search queries are not saved. You have completed the search - you get the result. For temporal things, “market share” corresponds to the proportion of users, and there is no concept of “total number of products” for search queries.
So what should I do when I see the news next time with the market share figures?
Look for auxiliary indicators: total market volume, and what is known about the total number of devices. And what the indicators say about what is happening in the scale of the entire market. For example, the enormous share of Samsung in the market of smartphones and mobile phones is reflected in the total number of devices, as well as the revenues and total weight of the company in the world. Sometimes numbers can be helpful. But never by themselves.
Translator's Note
The term “installed base” is used in the original article. I did not find a well-established translation into Russian. The meaning of this market indicator is the total number of products at the hands of consumers. I did not like the translation option “installation base”. The article uses the translation "total number of devices" , although the English term refers not only to devices, but to any products in principle. I would be grateful for ideas for a more accurate translation.
And at the request of workers survey for the owner of smartphones running on Android and iOS:
Source: https://habr.com/ru/post/208154/
All Articles